PRTG Manual: SNMP Custom Sensor
The SNMP Custom sensor monitors a single parameter that is returned by a specific object identifier (OID) via the Simple Network Management Protocol (SNMP).
For a detailed list and descriptions of the channels that this sensor can show, see section Channel List.
- Dutch: SNMP (Klant specifiek)
- French: SNMP personnalisé
- German: SNMP Benutzerdefiniert
- Japanese: SNMP カスタム
- Portuguese: SNMP (customizado)
- Russian: Пользовательские параметры SNMP
- Simplified Chinese: SNMP 自定义
- Spanish: SNMP (personalizado)
Consider the following remarks and requirements for this sensor:
Remark |
Description |
|---|---|
IPv6 |
This sensor supports IPv6. |
Performance impact |
This sensor has a very low performance impact. |
Localhost |
It might not work to query data from a probe device via SNMP (querying localhost, 127.0.0.1, or ::1). Add this device with the IP address that it has in your network and create the sensor on this device instead. |
Knowledge Base |
Knowledge Base: How do I find out which OID I need for an SNMP Custom sensor? |
Setting |
Description |
|---|---|
Channel Name |
Enter a name for the channel in which the sensor shows the results for the OID. Enter a string.
|
Unit String |
Enter the unit for the values that this sensor returns. Enter a string.
|
The sensor has the following default tags that are automatically predefined in the sensor's settings when you add the sensor:
- snmpcustomsensor
For more information about basic sensor settings, see section Sensor Settings.
Setting |
Description |
|---|---|
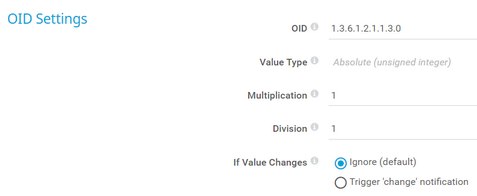
OID |
Enter the OID of the SNMP object that you want to receive numeric data from.
|
Value Type |
Select the expected numeric type of the results at the OID:
|
Multiplication |
If you want to multiply the received data with a certain value, enter the multiplier. Use the default value 1 to not change the received value. Enter an integer. |
Division |
If you want to divide the received data by a certain value, enter the divisor. Use the default value 1 to not change the received value. Enter an integer. |
Change Notifications |
Optionally have PRTG create a change notification in the sensor, parent object, and system logs. PRTG creates a log entry each time the trigger condition of the sensor is met. The trigger condition for this change notification is a change in the value that the OID returns. Define if the sensor logs change notifications:
|
Setting |
Description |
|---|---|
Primary Channel |
Select a channel from the list to define it as the primary channel. In the device tree, PRTG displays the last value of the primary channel below the sensor's name. The available options depend on what channels are available for this sensor.
|
Graph Type |
Define how this sensor shows different channels:
|
Stack Unit |
This setting is only visible if you select Stack channels on top of each other above. Select a unit from the list. PRTG stacks all channels with this unit on top of each other. By default, you cannot exclude single channels from stacking if they use the selected unit. However, there is an advanced procedure to do so. |
By default, all of these settings are inherited from objects that are higher in the hierarchy. We recommend that you change them centrally in the root group settings if necessary. To change a setting for this object only, click ![]() under the corresponding setting name to disable the inheritance and to display its options.
under the corresponding setting name to disable the inheritance and to display its options.
For more information, see section Inheritance of Settings.
Which channels the sensor actually shows might depend on the target device, the available components, and the sensor setup.
Channel |
Description |
|---|---|
Downtime |
In the channel table on the Overview tab, this channel never shows any values. PRTG uses this channel in graphs and reports to show the amount of time in which the sensor was in the Down status. |
[Value] |
The single numeric value (int64) for a specified OID
|
KNOWLEDGE BASE
How do I find out which OID I need for an SNMP Custom sensor?
What security features does PRTG include?
My SNMP sensors don’t work. What can I do?
VIDEO TUTORIAL
SNMP Custom sensor and SNMP Custom Library sensor


