PRTG Manual: SSH Disk Free Sensor
The SSH Disk Free sensor monitors the free space on disks of a Linux/Unix system using Secure Shell (SSH).
The free space that this sensor returns shows the available disk space of the volume, minus a reserve defined for this volume (for example, for redundancy purposes). So, this sensor shows the disk space that is actually available for use. You can define the size of the reserved disk space with tune2fs. For more information, see the Knowledge Base: Why do SSH Disk Free and SNMP Linux Disk Free show different values for my target Linux system?
For a detailed list and descriptions of the channels that this sensor can show, see section Channel List.
- Dutch: SSH Disk vrij
- French: Espace libre disque (SSH)
- German: SSH Datenträger-Speicher
- Japanese: SSH ディスク空き容量
- Portuguese: Disco livre (SSH)
- Russian: Свободное пространство диска по SSH
- Simplified Chinese: SSH 磁盘可用空间
- Spanish: Espacio libre en disco (SSH)
Consider the following remarks and requirements for this sensor:
Remark |
Description |
|---|---|
Credentials |
This sensor requires credentials for Linux/Solaris/macOS (SSH/WBEM) systems in the settings of the parent device. |
Distributions |
This sensor does not support all Linux/Unix and macOS distributions. |
Performance impact |
This sensor has a medium performance impact. |
IPv4 |
This sensor only supports IPv4. |
Limits |
This sensor has predefined limits for one or several metrics. |
Add Sensor dialog |
You can select up to 100 disks in the Add Sensor dialog. If you select more disks, you cannot create the sensor. Add the sensor multiple times to monitor more than 100 disks with several sensors. |
Knowledge Base |
|
The sensor has the following default tags that are automatically predefined in the sensor's settings when you add the sensor:
- diskfreesensor
- sshdiskfreesensor
For more information about basic sensor settings, see section Sensor Settings.
Setting |
Description |
|---|---|
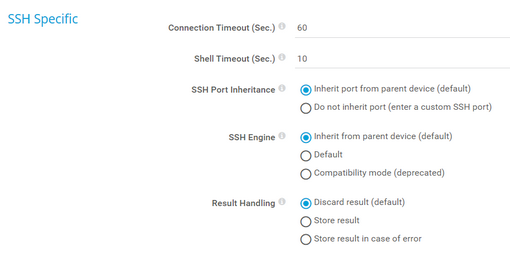
Connection Timeout (Sec.) |
Define a timeout in seconds for the connection. This is the time that the sensor waits to establish a connection to the host. Keep this value as low as possible. Enter an integer. The maximum timeout value is 900 seconds (15 minutes).
|
Shell Timeout (Sec.) |
Define a timeout in seconds for the shell response. This is the time in seconds the sensor waits for the shell to return a response after it has sent its specific command (for example, cat /proc/loadavg). The maximum value is 300 seconds (5 minutes). Enter an integer.
|
SSH Port Inheritance |
Define which port this sensor uses for the SSH connection:
|
Custom SSH Port |
This setting is only visible if you select Do not inherit port (enter a custom SSH port) above. Enter the port number (between 1 and 65535) that this sensor uses for the SSH connection. Enter an integer. |
SSH Engine |
Select the SSH engine that you want to use to access data with this SSH sensor:
|
Result Handling |
Define what PRTG does with the sensor result:
|
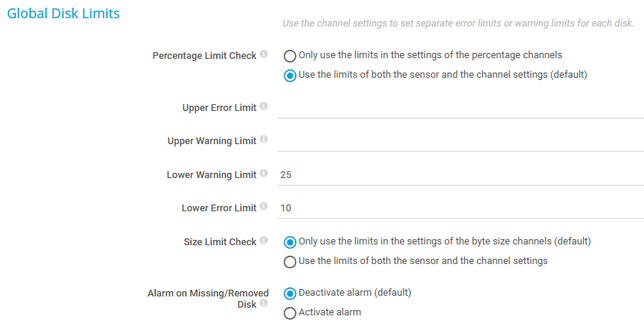
In this section, you can set limits for percentage channels and size channels. The limits that you define in these settings apply to all drives in the sensor. With limits, you can define when the sensor shows the Warning or Down status, depending on the data provided by all drives that this sensor monitors. If you want to individually define limits for separate channels, use the limit settings in the channel settings.
The limits that you set here are valid for all channels of this sensor. You can additionally set individual limits for each channel in the channel settings. Both the limits that you set here and in the channel settings are valid simultaneously. The channel gauge displays the limit with the highest value.
Setting |
Description |
|---|---|
Percentage Limit Check |
By default, the sensor enables percentage limits with a lower warning limit and a lower error limit. Enable or disable a limit check for the free space in percentage channels of all drives:
|
Upper Error Limit |
This setting is only visible if you select Use the limits of both the sensor and the channel settings (default) above. Specify an upper limit in percent for the Down status. If the free disk space of one of your drives exceeds this value, the sensor changes to the Down status. Enter an integer or leave the field empty. |
Upper Warning Limit |
This setting is only visible if you select Use the limits of both the sensor and the channel settings (default) above. Specify an upper limit in percent for the Warning status. If the free disk space of one of your drives exceeds this value, the sensor changes to the Warning status. Enter an integer or leave the field empty. |
Lower Warning Limit |
This setting is only visible if you select Use the limits of both the sensor and the channel settings (default) above. Specify a lower limit in percent for the Warning status. If the free disk space of one of your drives falls below this value, the sensor changes to the Warning status. Enter an integer or leave the field empty. |
Lower Error Limit |
This setting is only visible if you select Use the limits of both the sensor and the channel settings (default) above. Specify a lower limit in percent for the Down status. If the free disk space of one of your drives falls below this value, the sensor changes to the Down status. Enter an integer or leave the field empty. |
Size Limit Check |
Enable or disable a limit check for the free bytes channels of all drives:
|
Upper Error Limit |
This setting is only visible if you select Use the limits of both the sensor and the channel settings above. Specify an upper limit. Use the same unit as shown by the free bytes channels of this sensor. If the free disk space of one of your drives exceeds this value, the sensor changes to the Down status. Enter an integer or leave the field empty. |
Upper Warning Limit |
This setting is only visible if you select Use the limits of both the sensor and the channel settings above. Specify an upper limit. Use the same unit as shown by the free bytes channels of this sensor. If the free disk space of one of your drives exceeds this value, the sensor changes to the Warning status. Enter an integer or leave the field empty. |
Lower Warning Limit |
This setting is only visible if you select Use the limits of both the sensor and the channel settings above. Specify a lower limit. Use the same unit as shown by the free bytes channels of this sensor (the default unit is MB). If the free disk space of one of your drives falls below this value, the sensor changes to the Warning status. Enter an integer or leave the field empty. |
Lower Error Limit |
This setting is only visible if you select Use the limits of both the sensor and the channel settings above. Specify a lower limit. Use the same unit as shown by the free bytes channels of this sensor (the default unit is MB). If the free disk space of one of your drives falls below this value, the sensor changes to the Down status. Enter an integer or leave the field empty. |
Alarm on Missing/Removed Disk |
If a monitored disk is removed or not found, the sensor sets the values to zero. Select the alarm approach in this case:
|
Setting |
Description |
|---|---|
Primary Channel |
Select a channel from the list to define it as the primary channel. In the device tree, PRTG displays the last value of the primary channel below the sensor's name. The available options depend on what channels are available for this sensor.
|
Graph Type |
Define how this sensor shows different channels:
|
Stack Unit |
This setting is only visible if you select Stack channels on top of each other above. Select a unit from the list. PRTG stacks all channels with this unit on top of each other. By default, you cannot exclude single channels from stacking if they use the selected unit. However, there is an advanced procedure to do so. |
By default, all of these settings are inherited from objects that are higher in the hierarchy. We recommend that you change them centrally in the root group settings if necessary. To change a setting for this object only, click ![]() under the corresponding setting name to disable the inheritance and to display its options.
under the corresponding setting name to disable the inheritance and to display its options.
For more information, see section Inheritance of Settings.
Which channels the sensor actually shows might depend on the target device, the available components, and the sensor setup.
Channel |
Description |
|---|---|
Downtime |
In the channel table on the Overview tab, this channel never shows any values. PRTG uses this channel in graphs and reports to show the amount of time in which the sensor was in the Down status. |
Free Bytes [Mounted Partition] |
The free space |
Free Space [Mounted Partition] |
The free space (%)
|
Total |
The total space |
KNOWLEDGE BASE
Why do SSH Disk Free and SNMP Linux Disk Free show different values for my target Linux system?
Which encryption algorithms do PRTG SSH sensors support?
SSH and SFTP sensors in Unknown status
What security features does PRTG include?
How do I set up SSH sensors with my AWS Linux instances?


