PRTG Manual: Administrative Tools
On the Administrative Tools tab, you can start system-specific processes for debugging purposes.
This documentation refers to an administrator that accesses the PRTG web interface on a master node. Other user accounts, interfaces, or failover nodes might not have all of the options in the way described here. In a cluster, note that failover nodes are read-only by default.
If 15 minutes (900) seconds have passed since your last credential-based login and you open a setup page from a different setup page, PRTG asks you to enter your credentials again for security reasons. A dialog box appears. Enter your Login Name and Password and click OK to continue.
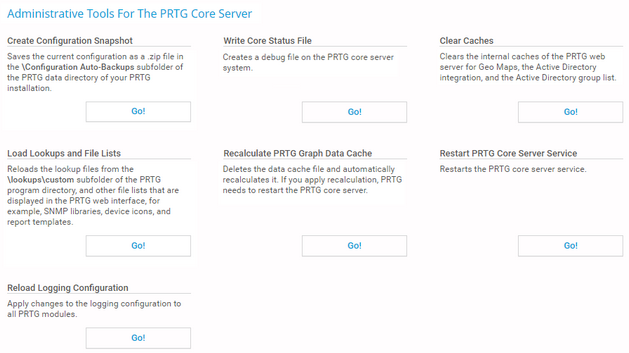
Administrative Tools For The PRTG Core Server
Setting |
Description |
|---|---|
Create Configuration Snapshot |
Create a snapshot of the PRTG configuration. This action might take up to 100 seconds. Once it finishes, you can find a .zip file that contains a *.dat file in the \Configuration Auto-Backups subfolder of the PRTG data directory.
|
Write Core Status File |
Create status files of the PRTG core server. You can find the two text files in the \Logs\debug subfolder of the PRTG data directory. PRTG creates new files every time you click Go!.
|
Clear Caches |
PRTG caches tiles for Geo Maps, user data for Active Directory Integration, and the Active Directory Group list. Click Go! to delete the cache if you encounter broken Geo Maps tiles, if you changed a user's password in the Active Directory, or if you added groups in the Active Directory.
|
Load Lookups and File Lists |
(Re)load the lookup files from the \lookups\custom subfolder of the PRTG program directory. In this subfolder, your customized lookup files are stored. If you have created a new lookup file or changed something in a lookup file, it might be necessary to load or to reload these files. With this option, you can also manually reload file lists in the PRTG web interface. If you have added new device icons, device templates, report templates, .oidlib files for the SNMP Library sensor, or language files to the PRTG program directory on the PRTG core server system while the server was running, reloading the file lists might be necessary to display new files in the PRTG web interface.
|
Recalculate PRTG Graph Data Cache |
PRTG constantly writes monitoring data to disk and keeps the graphs for your graph tabs in memory. If PRTG unexpectedly ends, the graph cache might become corrupted. In this case, graphs might be empty or show wrong data. If you experience graph display problems, a graph recalculation fixes the problem. Click Go! to delete the data cache file and to automatically recalculate it.
|
Restart the PRTG core server service manually. Click Go! to restart it.
|
|
Reload Logging Configuration |
For debugging reasons, it might be necessary to change the log levels of the PRTG core server. The Paessler support team takes you through the necessary steps that are required to change your logging configuration. The log level changes vary according to the PRTG installation, its setup, and the solution of an issue. To apply the changes, click Go!. |
Administrative Tools For Probes
Setting |
Description |
|---|---|
Write Probe Status Files |
Create status files of all probes. PRTG writes status files for the local probe on the PRTG core server (in a cluster, on the cluster node you are logged in to) as well as for all classic remote probes. PRTG creates new files each time you click Go!. On the respective systems, you find six text files in the \Logs\debug subfolder of the PRTG data directory. The files have the names Probe State (Global Debug Data).txt, Probe State (Memory Debug Data).txt, Probe State (Scheduler Debug Data).txt, Probe State (Syslog).txt, Probe State (Trap).txt, and Probe State (xFlow Debug Data).txt.
|
Restart All Probes |
Restart all probes as well as the local probe Windows service. If you have classic remote probes, this restarts the probe Windows services on the remote probe systems as well. To restart single probes only, see below.
|
Probe [#Number] "[Name]" |
This section shows information about the connection status. If the probe is connected, the field shows the source IP address and port number that the probe uses. For the local probe, the IP address is always 127.0.0.1. You also see information about the date when the last data packet was received from the probe. If you want to restart a single probe, click the corresponding Restart Probe button. Entries for every single probe follow.
|
There are some settings that you must define in the PRTG Administration Tool. For more information, see sections:

