PRTG Manual: Multi-Platform Probe Connection Health (Autonomous) Sensor
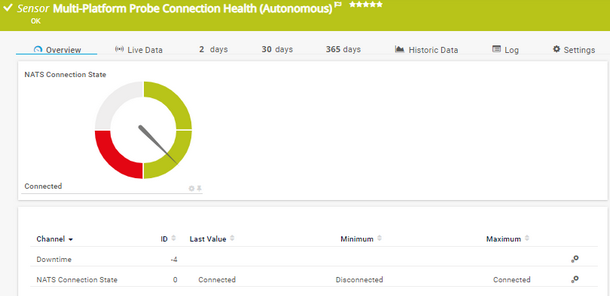
The Multi-Platform Probe Connection Health (Autonomous) sensor monitors the state of the connection between the PRTG core and multi-platform probes.
For a detailed list and descriptions of the channels that this sensor can show, see section Channel List.
- Dutch: Multi-Platform Probe Verbinding Status (Autonoom)
- French: État de la connexion de la sonde multi plate-forme (autonome)
- German: Zustand der Verbindungen mit Multi-Platform Probes (Autonom)
- Japanese: マルチプラットフォームプローブの接続の正常性(自律)
- Portuguese: Saúde da conexão da sonda multiplataforma (autônoma)
- Russian: Работоспособность подключения многоплатформенного зонда (автономно)
- Simplified Chinese: 多平台探针连接运行状况(自主)
- Spanish: Salud de conexión de sonda multiplataforma (autónomo)
Consider the following remarks and requirements for this sensor:
Remark |
Description |
|---|---|
Performance impact |
This sensor has a very low performance impact. |
Sensor creation |
PRTG automatically creates this sensor on the PRTG core server when you enable multi-platform probe connections under Setup | System Administration | Core & Probes. |
Lookups |
This sensor uses lookups to determine the status values of one or more channels. |
Multi-platform probe |
The sensor has the following default tags that are automatically predefined in the sensor's settings when you add the sensor:
- multiplatformprobeconnectionhealthsensor
For more information about basic sensor settings, see section Sensor Settings.
Setting |
Description |
|---|---|
Primary Channel |
Select a channel from the list to define it as the primary channel. In the device tree, PRTG displays the last value of the primary channel below the sensor's name. The available options depend on what channels are available for this sensor.
|
Graph Type |
Define how this sensor shows different channels:
|
Stack Unit |
This setting is only visible if you select Stack channels on top of each other above. Select a unit from the list. PRTG stacks all channels with this unit on top of each other. By default, you cannot exclude single channels from stacking if they use the selected unit. However, there is an advanced procedure to do so. |
Setting |
Description |
|---|---|
Result Handling |
Define what PRTG does with the sensor result:
|
By default, all of these settings are inherited from objects that are higher in the hierarchy. We recommend that you change them centrally in the root group settings if necessary. To change a setting for this object only, click ![]() under the corresponding setting name to disable the inheritance and to display its options.
under the corresponding setting name to disable the inheritance and to display its options.
For more information, see section Inheritance of Settings.
Which channels the sensor actually shows might depend on the target device, the available components, and the sensor setup.
Channel |
Description |
|---|---|
Downtime |
In the channel table on the Overview tab, this channel never shows any values. PRTG uses this channel in graphs and reports to show the amount of time in which the sensor was in the Down status. |
NATS Connection State |
The state of the connection to the NATS server
|
KNOWLEDGE BASE
What security features does PRTG include?
OTHER MANUALS


