PRTG Manual: Group Settings
The following settings are available on the Settings tab of a group.
This documentation does not refer to the settings of the root group. For more information, see section Root Group Settings.
We recommend that you define as many settings as possible in the root group settings so that you can inherit them to all other objects in the object hierarchy.
This documentation refers to an administrator that accesses the PRTG web interface on a master node. Other user accounts, interfaces, or failover nodes might not have all of the options in the way described here. In a cluster, note that failover nodes are read-only by default.
In this section:
- Basic Group Settings
- Auto-Discovery Settings
- Location
- Credentials for Windows Systems
- Credentials for Linux/Solaris/macOS (SSH/WBEM) Systems
- Credentials for VMware/XenServer
- Credentials for SNMP Devices
- Credentials for Database Management Systems
- Credentials for AWS
- Credentials for Microsoft 365
- Credentials for Script Sensors
- Credentials for Cisco Meraki
- Credentials for Dell EMC
- Credentials for FortiGate
- Credentials for HPE 3PAR
- Credentials for HTTP
- Credentials for Microsoft Azure
- Credentials for MQTT
- Credentials for NATS
- Credentials for NetApp
- Credentials for OPC UA
- Credentials for Soffico Orchestra
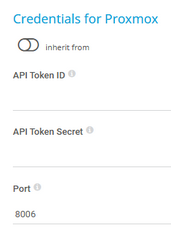
- Credentials for Proxmox
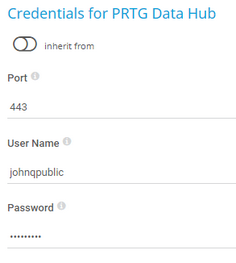
- Credentials for PRTG Data Hub
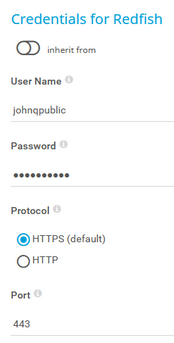
- Credentials for Redfish
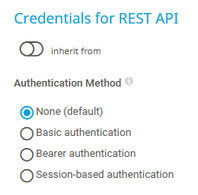
- Credentials for REST API
- Credentials for Veeam
- Windows Compatibility Options
- SNMP Compatibility Options
- Proxy Settings
- Connection Settings for Siemens S7
- Scanning Interval
- Schedules, Dependencies, and Maintenance Window
- Access Rights
- Channel Unit Configuration
- Advanced Network Analysis
- Number of Sensors Limitation
Setting |
Description |
|---|---|
Group Name |
Enter a name to identify the group. By default, PRTG shows this name in the device tree, as well as in alarms, logs, notifications, reports, maps, libraries, and tickets.
|
Monitoring Status |
Select the monitoring status of the group:
|
Parent Tags |
Shows the tags that this group inherits from its parent probe.
|
Tags |
Enter one or more tags. Confirm each tag with the Spacebar key, a comma, or the Enter key. You can use tags to group objects and use tag-filtered views later on. Tags are not case-sensitive. Tags are automatically inherited.
|
Priority |
Select a priority for the group. This setting determines the position of the group in lists. The highest priority is at the top of a list. You can choose from the lowest priority ( |
Setting |
Description |
|---|---|
Auto-Discovery Level |
Select the level of detail for the auto-discovery:
|
Device Templates |
This setting is only visible if you select Auto-discovery with specific device templates above. Select one or more device templates by enabling a checkbox in front of the template name. PRTG uses the device templates that you select for the auto-discovery on the device:
Once the auto-discovery is finished, PRTG creates a new ticket and lists the device templates that it used to create new sensors. |
Schedule |
Select when PRTG runs the auto-discovery:
|
IP Address Selection Method |
Select how you want to define the IP address range for the auto-discovery:
|
IPv4 Base |
This setting is only visible if you select Class C base IP address with start/end (IPv4) (default) above. Enter a class C network as the IP base for the auto-discovery. Enter the first three octets of an IPv4 address, for example, 192.168.0. |
IPv4 Range Start |
This setting is only visible if you select Class C base IP address with start/end (IPv4) (default) above. Enter the IP octet of the class C network (specified above) from which PRTG starts the auto-discovery. This completes the IP base to an IPv4 address. For example, enter 1 to discover from 192.168.0.1 onwards. |
IPv4 Range End |
This setting is only visible if you select Class C base IP address with start/end (IPv4) (default) above. Enter the IP octet of the class C network (specified above) at which PRTG stops the auto-discovery. This completes the IP base to an IPv4 address. For example, enter 254 to discover up to 192.168.0.254. |
IPv4/DNS Name List IPv6/DNS Name List |
This setting is only visible if you select List of individual IP addresses and DNS names (IPv4) or List of individual IP addresses and DNS names (IPv6) above. Enter a list of IP addresses or DNS names that the auto-discovery scans. Enter each address on a separate line. |
IPv4 and Subnet (IPv4) |
This setting is only visible if you select IP address and subnet (IPv4) above. Enter an expression in the format address/subnet, for example, 192.168.3.0/255.255.255.0. You can also use the short form like 192.168.3.0/24. If you want to include multiple addresses and subnets, enter them as a list separated by a comma, for example, 192.168.3.0/255.255.255.0, 192.169.0.0/255.255.255.0. PRTG scans the complete host range (without network and broadcast address) that is defined by the IP address and the subnet mask. |
IP Address with Octet Range |
This setting is only visible if you select IP address with octet range (IPv4) above. Enter an expression in the format a1.a2.a3.a4, where a1, a2, a3, and a4 are each a number between 0-255, or a range with two numbers and a hyphen like 1-127. PRTG calculates all permutations of all ranges. For example, 10.0.1-10.1-100 results in 1,000 IP addresses that PRTG scans during the auto-discovery. |
Organizational Unit |
This setting is only visible if you select Use computers from the Active Directory (maximum 1000 computers) above. Enter an organizational unit (OU) to restrict the Active Directory search to computers that are part of this OU. For top-level OUs, use the distinguished name (DN) format without OU= and without the domain components (DCS). If you leave this field empty, there are not any restrictions. Example:
If you have sub-OUs, use the DN format without the leading OU= and without the DCS. Examples:
|
Name Resolution |
Select how to monitor newly discovered devices. This only affects new devices. This does not change the setting for other devices. Depending on your selection, the IP Address/DNS Name field of an added device shows the DNS name or IP address that PRTG uses to access the target device:
|
Device Rescan |
Select how to handle known devices:
|
By default, all of these settings are inherited from objects that are higher in the hierarchy. We recommend that you change them centrally in the root group settings if necessary. To change a setting for this object only, click ![]() under the corresponding setting name to disable the inheritance and to display its options.
under the corresponding setting name to disable the inheritance and to display its options.
For more information, see section Inheritance of Settings.
Click ![]() to interrupt the inheritance.
to interrupt the inheritance.
Setting |
Description |
|---|---|
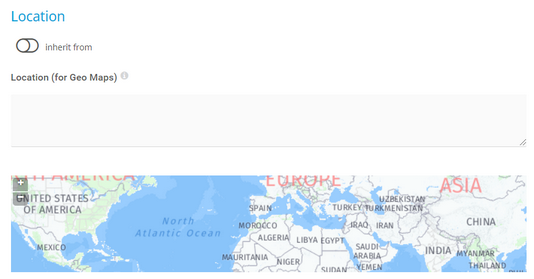
Location (for Geo Maps) |
If you want to use Geo Maps, enter a location in the first line. Geographical maps then display objects like devices or groups with a status icon using a color code similar to the sensor status icons (green–yellow–orange–red). You can enter a full postal address, city and country only, or latitude and longitude. It is possible to enter any text before, between, and after the coordinates, as PRTG automatically parses latitude and longitude, for example, enter 49.452778 11.077778, or enter 49.452778 any 11.077778 text. A minus sign (-) in the first line hides an object from a geographical map. In this case, you can enter location information in line two and following. You can define a specific label for each location. Enter a string denoting the label in the first line and provide the coordinates in the second line. This geographical marker then shows the object with the label in the geographical map.
|
Credentials for Windows Systems
Click ![]() to interrupt the inheritance.
to interrupt the inheritance.
The settings you define in this section apply to the following sensors:
Setting |
Description |
|---|---|
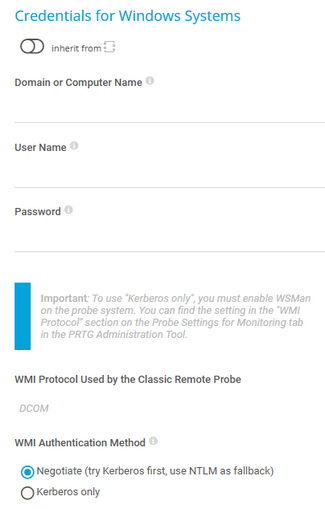
Domain or Computer Name |
Enter the domain or computer name of the user account with which you want to access the Windows system. PRTG uses this account for Windows Management Instrumentation (WMI) sensors and other Windows sensors. If you want to use a Windows local user account on the target device, enter the computer name. If you want to use a Windows domain user account (recommended), enter the domain name. PRTG automatically adds a prefix to use the NT LAN Manager (NTLM) protocol if you do not explicitly define it. Do not leave this field empty.
|
User Name |
Enter the user name for access to the Windows system. Usually, you use credentials with administrator rights. |
Password |
Enter the password for access to the Windows system. Usually, you use credentials with administrator rights. |
WMI Protocol Used by the Classic Remote Probe |
Shows the WMI protocol that the parent probe device of this object uses for authentication. PRTG shows this setting for reference purposes only. You can change the protocol in the PRTG Administration Tool.
|
WMI Authentication Method |
Define how a probe authenticates with Windows systems:
|
Credentials for Linux/Solaris/macOS (SSH/WBEM) Systems
Click ![]() to interrupt the inheritance.
to interrupt the inheritance.
The settings you define in this section apply to the following sensors:
- SSH Disk Free
- SSH Disk Free v2
- SSH INodes Free v2
- SSH Load Average v2
- SSH Meminfo v2
- SSH Remote Ping v2
- SSH SAN Enclosure
- SSH SAN Logical Disk
- SSH SAN Physical Disk
- SSH SAN System Health
- SSH Script
- SSH Script v2
- SSH Script Advanced
- VMware Host Hardware (WBEM)
Setting |
Description |
|---|---|
User Name |
Enter the user name for access to the Linux/Solaris/macOS system via Secure Shell (SSH) and Web-based Enterprise Management (WBEM). Usually, you use credentials with administrator rights. |
Authentication Method |
Select the authentication method for the login:
|
Password |
This setting is only visible if you select Password above. Enter a password for access to the Linux/Solaris/macOS system via SSH and WBEM. Usually, you use credentials with administrator rights. |
Private Key |
This setting is only visible if you select Private key above. Paste the entire RSA private key, including the BEGIN and END lines. Make sure that a corresponding public key exists on the target device.
|
WBEM Protocol |
Select the protocol that you want to use for the connection to the system via WBEM:
|
WBEM Port |
Select if you want to use one of the default ports for the connection to the system via WBEM or if you want to set a custom port:
|
Custom WBEM Port |
This setting is only visible if you select Custom above. Enter a custom WBEM port. Enter an integer. |
SSH Port |
Enter the port for SSH connections. Enter an integer. The default port is 22.
|
SSH Rights Elevation |
Select the rights that you want to use to run the command on the target system:
|
Target System User Name |
This setting is only visible if you select an option that includes sudo or su above. Enter a user name to run the specified command on the target system as a different user than the root user. If you leave this field empty, you run the command as a root user. Make sure that you set the Linux password even if you use a public key or a private key for authentication. This is not necessary if the user is allowed to run the command without a password. |
Password |
This setting is only visible if you select an option that includes sudo or su with password above. Enter the password to run the sudo command or the su command. |
SSH Connection Mode |
Select the connection mode that you want to use to access data with SSH sensors:
|
Credentials for VMware/XenServer
Click ![]() to interrupt the inheritance.
to interrupt the inheritance.
The settings you define in this section apply to the following sensors:
- Citrix XenServer Host
- Citrix XenServer Virtual Machine
- VMware Datastore (SOAP)
- VMware Host Hardware (WBEM)
- VMware Host Hardware Status (SOAP)
- VMware Host Performance (SOAP)
- VMware Virtual Machine (SOAP)
Setting |
Description |
|---|---|
User Name |
Enter the user name for access to VMware ESXi, vCenter Server, or Citrix XenServer. Usually, you use credentials with administrator rights. |
Password |
Enter the password for access to VMware ESXi, vCenter Server, or Citrix XenServer. Usually, you use credentials with administrator rights.
|
VMware Protocol |
Select the protocol for the connection to VMware ESXi, vCenter Server, or Citrix XenServer:
|
Session Handling |
Select if you want to reuse a session for VMware sensors:
|
Click ![]() to interrupt the inheritance.
to interrupt the inheritance.
The settings you define in this section apply to the following sensors:
Setting |
Description |
|---|---|
SNMP Version |
Select the Simple Network Management Protocol (SNMP) version for the connection to the target SNMP device:
|
Community String |
This setting is only visible if you select SNMP v1 or SNMP v2c (default) above. Enter the community string of your device. This is like a clear-text password for simple authentication.
|
Authentication Method |
This setting is only visible if you select SNMP v3 above. Select the authentication method:
|
User Name |
This setting is only visible if you select SNMP v3 above. Enter the user name for access to the target SNMP device.
|
Password |
This setting is only visible if you select SNMP v3 above. Enter the password for access to the target SNMP device.
|
Encryption Type |
This setting is only visible if you select SNMP v3 above. Select an encryption type:
|
Encryption Key |
This setting is only visible if you select SNMP v3 above. Enter an encryption key. If you provide a key, PRTG encrypts SNMP data packets with the encryption algorithm that you selected above. Leave this setting blank if you select None for the Encryption Type. Enter a string or leave the field empty.
|
Context Name |
This setting is only visible if you select SNMP v3 above. Enter a context name only if the configuration of the device requires it. Context is a collection of management information that is accessible by an SNMP device. Enter a string. |
SNMP Port |
Enter the port for the connection to the SNMP target device. Enter an integer. The default port is 161.
|
Timeout (Sec.) |
Enter a timeout in seconds for the request. Enter an integer. The maximum timeout value is 300 seconds (5 minutes). |
Credentials for Database Management Systems
Click ![]() to interrupt the inheritance.
to interrupt the inheritance.
The settings you define in this section apply to the following sensors:
Setting |
Description |
|---|---|
Port |
Select the port that PRTG uses for connections to the monitored databases:
|
Custom Port |
Enter a custom port for database connections. Enter an integer.
|
Authentication Method |
Select the authentication method for the connection to the Structured Query Language (SQL) database:
|
User Name |
This setting is only visible if you select SQL server authentication above. Enter the user name for the database connection. |
Password |
This setting is only visible if you select SQL server authentication above. Enter the password for the database connection. |
Timeout (Sec.) |
Enter a timeout in seconds for the request. Enter an integer. The maximum timeout value is 900 seconds (15 minutes). |
Click ![]() to interrupt the inheritance.
to interrupt the inheritance.
The settings you define in this section apply to the following sensors:
For more information about the permissions that are necessary to query the AWS API, see the Knowledge Base: How do I set permissions for the Amazon Web Services (AWS) API key to use certain sensors in PRTG?
Setting |
Description |
|---|---|
Access Key ID |
Enter the Amazon Web Services (AWS) access key ID. |
Secret Access Key |
Enter the AWS secret access key. |
Click ![]() to interrupt the inheritance.
to interrupt the inheritance.
The settings you define in this section apply to the following sensors:
The sensors use the credentials to authenticate with Microsoft Entra ID.
For more information about the credentials and the permissions that are necessary to use the Microsoft 365 Service Status sensor and the Microsoft 365 Service Status Advanced sensor, see the Knowledge Base: How do I obtain credentials and set permissions for the Microsoft 365 Service Status sensors?
For more information about the credentials and the permissions that are necessary to use the Microsoft 365 Mailbox sensor, see the Knowledge Base: How do I obtain credentials and set permissions for the Microsoft 365 Mailbox sensor?
Setting |
Description |
|---|---|
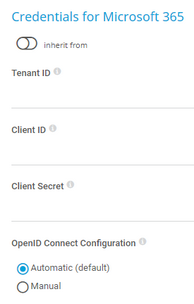
Tenant ID |
Enter the Microsoft Entra tenant ID.
|
Client ID |
Enter the Microsoft Entra client ID. |
Client Secret |
Enter the Microsoft Entra client secret. |
OpenID Connect Configuration |
Select if you want to manually enter the authorization endpoint URL and token endpoint URL that PRTG uses to access Microsoft Graph:
|
Authorization Endpoint |
Enter the authorization endpoint URL including the server. Authorization endpoint URL example: https://login.microsoftonline.com/<tenant-ID>/oauth2/v2.0/authorize
|
Token Endpoint |
Enter the token endpoint URL including the server. Token endpoint URL example: https://login.microsoftonline.com/<tenant-ID>/oauth2/v2.0/token
|
Credentials for Script Sensors
Click ![]() to interrupt the inheritance.
to interrupt the inheritance.
The settings you define in this section apply to the following sensors:
Setting |
Description |
|---|---|
Placeholder 1 Description |
Enter a description for Placeholder 1, for example information about the purpose or content of the placeholder. |
Placeholder 1 |
Enter a value for the placeholder. PRTG inserts the value for the script execution if you add %scriptplaceholder1 in the argument list. PRTG does not display the value in the sensor log or the sensor's settings. |
Placeholder 2 Description |
Enter a description for Placeholder 2, for example information about the purpose or content of the placeholder. |
Placeholder 2 |
Enter a value for the placeholder. PRTG inserts the value for the script execution if you add %scriptplaceholder2 in the argument list. PRTG does not display the value in the sensor log or the sensor's settings. |
Placeholder 3 Description |
Enter a description for Placeholder 3, for example information about the purpose or content of the placeholder. |
Placeholder 3 |
Enter a value for the placeholder. PRTG inserts the value for the script execution if you add %scriptplaceholder3 in the argument list. PRTG does not display the value in the sensor log or the sensor's settings. |
Placeholder 4 Description |
Enter a description for Placeholder 4, for example information about the purpose or content of the placeholder. |
Placeholder 4 |
Enter a value for the placeholder. PRTG inserts the value for the script execution if you add %scriptplaceholder4 in the argument list. PRTG does not display the value in the sensor log or the sensor's settings. |
Placeholder 5 Description |
Enter a description for Placeholder 5, for example information about the purpose or content of the placeholder. |
Placeholder 5 |
Enter a value for the placeholder. PRTG inserts the value for the script execution if you add %scriptplaceholder5 in the argument list. PRTG does not display the value in the sensor log or the sensor's settings. |
Click ![]() to interrupt the inheritance.
to interrupt the inheritance.
The settings you define in this section apply to the following sensors:
Setting |
Description |
|---|---|
API Key |
Enter an API key that the sensor uses for authentication against the Cisco Meraki Dashboard API. |
Meraki Dashboard API Endpoint |
Enter the endpoint for the Cisco Meraki Dashboard API. The default api.meraki.com should be valid for most use cases.
|
Click ![]() to interrupt the inheritance.
to interrupt the inheritance.
The settings you define in this section apply to the following sensors:
- Dell EMC Unity Enclosure Health v2
- Dell EMC Unity File System v2
- Dell EMC Unity Storage Capacity v2
- Dell EMC Unity Storage LUN v2
- Dell EMC Unity Storage Pool v2
- Dell EMC Unity VMware Datastore v2
Setting |
Description |
|---|---|
User Name |
Enter the user name for access to the Dell EMC system. |
Password |
Enter the password for access to the Dell EMC system. |
Port |
Enter the port for the connection to the Dell EMC system. The default port for secure connections is 443. |
Click ![]() to interrupt the inheritance.
to interrupt the inheritance.
The settings you define in this section apply to the following sensors:
Setting |
Description |
|---|---|
API Token |
Enter the API token for access to the FortiGate system. |
Port |
Enter the port for the connection to the FortiGate system. The default port for secure connections is 443. |
Click ![]() to interrupt the inheritance.
to interrupt the inheritance.
The settings you define in this section apply to the following sensors:
Setting |
Description |
|---|---|
User Name |
Enter the user name for access to the HPE 3PAR system. |
Password |
Enter the password for access to the HPE 3PAR system. |
Protocol |
Select the protocol that you want to use for the connection to the HPE 3PAR system:
|
WSAPI Port |
Enter the Web Services API (WSAPI) port for the connection to the HPE 3PAR system. The default port for secure connections is 8080 and the default port for unsecure connections is 8008.
|
SSH Port |
Enter the SSH port for the connection to the HPE 3PAR system. The default port for secure connections is 22. |
Click ![]() to interrupt the inheritance.
to interrupt the inheritance.
The settings you define in this section apply to the following sensor:
Setting |
Description |
|---|---|
Authentication Method |
Select the authentication method for access to the server:
|
User Name |
This setting is only visible if you select Basic authentication above. Enter the user name for access to the server. |
Password |
This setting is only visible if you select Basic authentication above. Enter the password for access to the server. |
Bearer Token |
This setting is only visible if you select Bearer authentication above. Enter a bearer token for access to the server. |
Placeholder 1 Description |
Enter a description for Placeholder 1, for example information about the purpose or content of the placeholder. |
Placeholder 1 |
Enter a value for the placeholder. PRTG inserts the value for the HTTP request if you add %httpplaceholder1 in the URL, POST Body, and Custom Headers fields of the HTTP v2 sensor. PRTG does not display the value in the sensor log or the sensor's settings. |
Placeholder 2 Description |
Enter a description for Placeholder 2, for example information about the purpose or content of the placeholder. |
Placeholder 2 |
Enter a value for the placeholder. PRTG inserts the value for the HTTP request if you add %httpplaceholder2 in the URL, POST Body, and Custom Headers fields of the HTTP v2 sensor. PRTG does not display the value in the sensor log or the sensor's settings. |
Placeholder 3 Description |
Enter a description for Placeholder 3, for example information about the purpose or content of the placeholder. |
Placeholder 3 |
Enter a value for the placeholder. PRTG inserts the value for the HTTP request if you add %httpplaceholder3 in the URL, POST Body, and Custom Headers fields of the HTTP v2 sensor. PRTG does not display the value in the sensor log or the sensor's settings. |
Placeholder 4 Description |
Enter a description for Placeholder 4, for example information about the purpose or content of the placeholder. |
Placeholder 4 |
Enter a value for the placeholder. PRTG inserts the value for the HTTP request if you add %httpplaceholder4 in the URL, POST Body, and Custom Headers fields of the HTTP v2 sensor. PRTG does not display the value in the sensor log or the sensor's settings. |
Placeholder 5 Description |
Enter a description for Placeholder 5, for example information about the purpose or content of the placeholder. |
Placeholder 5 |
Enter a value for the placeholder. PRTG inserts the value for the HTTP request if you add %httpplaceholder5 in the URL, POST Body, and Custom Headers fields of the HTTP v2 sensor. PRTG does not display the value in the sensor log or the sensor's settings. |
Credentials for Microsoft Azure
Click ![]() to interrupt the inheritance.
to interrupt the inheritance.
The settings you define in this section apply to the following sensors:
- Microsoft Azure SQL Database
- Microsoft Azure Storage Account
- Microsoft Azure Subscription Cost
- Microsoft Azure Virtual Machine
The sensors use the credentials to authenticate with Microsoft Entra ID.
For more information about the credentials and permissions that are necessary use the Microsoft Azure sensors, see the Knowledge Base: How do I obtain credentials and create custom roles for the Microsoft Azure sensors?
Setting |
Description |
|---|---|
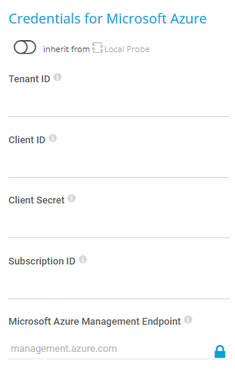
Tenant ID |
Enter the Microsoft Entra tenant ID.
|
Client ID |
Enter the Microsoft Entra client ID. |
Client Secret |
Enter the Microsoft Entra client secret. |
Subscription ID |
Enter the Microsoft Entra subscription ID. |
Microsoft Azure Management Endpoint |
The Microsoft Azure API Management endpoint that all sensors on this object connect to. The default endpoint is management.azure.com.
|
Click ![]() to interrupt the inheritance.
to interrupt the inheritance.
The settings you define in this section apply to the following sensors:
Setting |
Description |
|---|---|
Authentication Method |
Select if you want to connect without credentials or define credentials for access to the MQTT broker:
|
User Name |
This setting is only visible if you select User name and password above. Enter the user name for access to the Message Queue Telemetry Transport (MQTT) broker. |
Password |
This setting is only visible if you select User name and password above. Enter the password for access to the MQTT broker. |
Port |
Enter the port for the connection to the MQTT broker. The default port for secure connections is 8883 and the default port for unsecure connections is 1883. |
Transport-Level Security |
Select if you want to use a Secure Sockets Layer (SSL)/Transport Layer Security (TLS) secured connection:
|
Server Authentication |
This setting is only visible if you select Use transport-level security above. Select if you want to use a certificate for server authentication:
|
CA Certificate |
This setting is only visible if you select Enable above. Enter the certificate authority (CA) certificate for the verification of the MQTT broker.
|
Client Authentication |
This setting is only visible if you select Use transport-level security above. Select if you want to use a certificate for client authentication:
|
Client Certificate |
This setting is only visible if you select Enable above. Enter the certificate that you created for authenticating the sensor against the MQTT broker.
|
Client Key |
This setting is only visible if you select Enable above. Enter the client key for access to the MQTT broker.
|
Client Key Password |
This setting is only visible if you select Enable above. Enter the password for the client key. |
Click ![]() to interrupt the inheritance.
to interrupt the inheritance.
The settings you define in this section apply to the following sensor:
Setting |
Description |
|---|---|
Connection Security |
Select if you want to use an encrypted Transport Layer Security (TLS) connection to the NATS server:
|
TLS-First Handshake |
This setting is only visible if you select Use TLS (default) above. Specify if the sensor connects to the NATS server using a TLS-first handshake:
|
Authentication Method |
Select how PRTG authenticates against the NATS server:
|
User Name |
This setting is only visible if you select User name and password (default) above. Enter a user name for access to the NATS server. |
Password |
This setting is only visible if you select User name and password (default) above. Enter the password for access to the NATS server. |
User NKey |
This setting is only visible if you select NKey above. Enter the user NKey to authenticate against the NATS server. The user NKey is prefixed with a U. |
Seed NKey |
This setting is only visible if you select NKey above. Enter the seed NKey to authenticate against the NATS server. The seed NKey is prefixed with an S. |
NATS Credentials |
This setting is only visible if you select NATS credentials above. Enter the NATS credentials in the NATS credentials file format to authenticate against the NATS server. |
Port |
Enter the port for the connection to the NATS server. The default port is 4222. |
Click ![]() to interrupt the inheritance.
to interrupt the inheritance.
The settings you define in this section apply to the following sensors:
- NetApp Aggregate v2
- NetApp I/O v2
- NetApp LIF v2
- NetApp LUN v2
- NetApp NIC v2
- NetApp Physical Disk v2
- NetApp SnapMirror v2
- NetApp System Health v2
- NetApp Volume v2
The sensors use the credentials for access to the ONTAP System Manager.
Setting |
Description |
|---|---|
User Name |
Enter a user name for access to the ONTAP System Manager. |
Password |
Enter the password for access to the ONTAP System Manager. |
Port |
Enter the port for the connection to the ONTAP System Manager. The default port for secure connections is 443. |
Protocol |
Select the protocol that you want to use for the connection to the ONTAP System Manager:
|
Click ![]() to interrupt the inheritance.
to interrupt the inheritance.
The settings you define in this section apply to the following sensors:
Setting |
Description |
|---|---|
Port |
Enter the port for the connection to the OPC Unified Architecture (OPC UA) server. The default port for secure connections is 4840. |
Server Path |
Enter the path of the OPC UA server endpoint if you run more than one server under the same IP address or DNS name. |
Security Mode |
Select if you want to use encryption:
|
Security Policy |
This setting is only visible if you select Sign or Sign & Encrypt above. Select if you want to use a security policy and define which policy you want to use:
|
Client Certificate |
This setting is only visible if you select Sign or Sign & Encrypt above. Enter the certificate that you created for authenticating the sensor against the OPC UA server.
|
Client Key |
This setting is only visible if you select Sign or Sign & Encrypt above. Enter the client key for access to the OPC UA server.
|
Client Key Password |
This setting is only visible if you select Sign or Sign & Encrypt above. Enter the password for the client key. |
Select if you want to connect without credentials or define credentials for access to the OPC UA server:
|
|
User Name |
This setting is only visible if you select User name and password above. Enter the user name for access to the OPC UA server. |
Password |
This setting is only visible if you select User name and password above. Enter the password for access to the OPC UA server. |
Credentials for Soffico Orchestra
Click ![]() to interrupt the inheritance.
to interrupt the inheritance.
The settings you define in this section apply to the following sensor:
Setting |
Description |
|---|---|
Authentication Method |
Select if you want to connect without credentials or define credentials for access to the Orchestra platform:
|
User Name |
This setting is only visible if you select User name and password above. Enter the user name for access to the Orchestra platform. |
Password |
This setting is only visible if you select User name and password above. Enter the password for access to the Orchestra platform. |
Timeout (Sec.) |
Enter a timeout in seconds for the request. Enter an integer. The maximum timeout value is 300 seconds (5 minutes). |
Port |
Enter the port for the connection to the Orchestra platform. The default port for secure connections is 8443 and the default port for unsecure connections is 8019. |
Protocol |
Select the protocol that you want to use for the connection to the Orchestra platform:
|
Click ![]() to interrupt the inheritance.
to interrupt the inheritance.
The settings you define in this section apply to the following sensors:
- Proxmox VE Cluster Health
- Proxmox VE Container Status
- Proxmox VE Node Performance
- Proxmox VE Virtual Machine Status
Setting |
Description |
|---|---|
API Token ID |
Enter the full API token ID for authentication of the Proxmox Virtual Environment (Proxmox VE) API in the format user@realm!tokenID.
|
API Token Secret |
Enter the UUID secret of the Proxmox VE API token. |
Port |
Enter the port for the connection to the Proxmox VE virtual machine. The default port is 8006. PRTG supports ports 1-65535. |
Click ![]() to interrupt the inheritance.
to interrupt the inheritance.
The settings you define in this section apply to the following sensors:
Setting |
Description |
|---|---|
Port |
Enter the port for the metrics endpoint of the PRTG Data Hub API. The default port is 443. |
User Name |
Enter the user name for access to the PRTG Data Hub API. |
Password |
Enter the password for access to the PRTG Data Hub API. |
Click ![]() to interrupt the inheritance.
to interrupt the inheritance.
The settings you define in this section apply to the following sensors:
Setting |
Description |
|---|---|
User Name |
Enter the user name for access to the Redfish system. |
Password |
Enter the password for access to the Redfish system. |
Protocol |
Select the protocol that you want to use for the connection to the Redfish system:
|
Port |
Enter the port for the connection to the Redfish system. The default port for secure connections is 443. |
Click ![]() to interrupt the inheritance.
to interrupt the inheritance.
The settings you define in this section apply to the following sensor:
Setting |
Description |
|---|---|
Authentication Method |
Select the authentication method for access to the Representational State Transfer (REST) application programming interface (API):
|
User Name |
This setting is only visible if you select Basic authentication above. Enter the user name for access to the REST API. |
Password |
This setting is only visible if you select Basic authentication above. Enter the password for access to the REST API. |
Bearer Token |
This setting is only visible if you select Bearer authentication above. Enter a bearer token for access to the REST API. |
Login Path |
This setting is only visible if you select Session-based authentication above. Enter a URL for the login request that uses GET or POST, for example, /api/login. You can optionally add a specific port number to the request, for example, https://:443/api/login. |
Authentication Header |
This setting is only visible if you select Session-based authentication above. Select whether to include an authentication header in the login request:
|
Login Request Method |
This setting is only visible if you select Session-based authentication above. Select the method for the login request:
|
POST Data |
This setting is only visible if you select Session-based authentication and POST above. Enter the data to POST to the login path. You can use placeholders, for example, %restusername or %restpassword. |
Custom Headers |
This setting is only visible if you select Session-based authentication above. Enter any custom headers. Enter one header per line. |
Login Result Type |
This setting is only visible if you select Session-based authentication above. Select the type of the login result.
|
Login Header Name |
This setting is only visible if you select Session-based authentication and Header (default) above. Enter the header name to get the session key value in the login response. For example, X-Authenticate. This setting is case-sensitive. |
Login Cookie Name |
This setting is only visible if you select Session-based authentication and Cookie above. Enter the cookie name to get the session key value in the login response. For example, X-Authenticate. This setting is case-sensitive. |
JSONPath |
This setting is only visible if you select Session-based authentication and JSON above. Enter the JSONPath to the session key value in the login response. For example, $["X-Authenticate"]. This setting is case-sensitive. |
XPath |
This setting is only visible if you select Session-based authentication and XML above. Enter the XML path (XPath) to the session key value in the login response. For example, /root/X-Authenticate/text(). This setting is case-sensitive. |
Token Type |
This setting is only visible if you select Session-based authentication above. Select the token type to use for authorization:
|
Header Name |
This setting is only visible if you select Session-based authentication and Via header above. Enter the header name to use for authorization. For example, X-Authenticate. This setting is case-sensitive. |
Cookie Name |
This setting is only visible if you select Session-based authentication and Via cookie above. Enter the cookie name to use for authorization. For example, X-Authenticate. This setting is case-sensitive. |
Placeholder 1 Description |
Enter a description for Placeholder 1, for example information about the purpose or content of the placeholder. |
Placeholder 1 |
Enter a value for the placeholder. PRTG inserts the value for the REST API request if you add %restplaceholder1 in the Request URL, POST Body, and Custom Headers fields of the REST Custom v2 sensor. PRTG does not display the value in the sensor log or the sensor's settings. |
Placeholder 2 Description |
Enter a description for Placeholder 2, for example information about the purpose or content of the placeholder. |
Placeholder 2 |
Enter a value for the placeholder. PRTG inserts the value for the REST API request if you add %restplaceholder2 in the Request URL, POST Body, and Custom Headers fields of the REST Custom v2 sensor. PRTG does not display the value in the sensor log or the sensor's settings. |
Placeholder 3 Description |
Enter a description for Placeholder 3, for example information about the purpose or content of the placeholder. |
Placeholder 3 |
Enter a value for the placeholder. PRTG inserts the value for the REST API request if you add %restplaceholder3 in the Request URL, POST Body, and Custom Headers fields of the REST Custom v2 sensor. PRTG does not display the value in the sensor log or the sensor's settings. |
Placeholder 4 Description |
Enter a description for Placeholder 4, for example information about the purpose or content of the placeholder. |
Placeholder 4 |
Enter a value for the placeholder. PRTG inserts the value for the REST API request if you add %restplaceholder4 in the Request URL, POST Body, and Custom Headers fields of the REST Custom v2 sensor. PRTG does not display the value in the sensor log or the sensor's settings. |
Placeholder 5 Description |
Enter a description for Placeholder 5, for example information about the purpose or content of the placeholder. |
Placeholder 5 |
Enter a value for the placeholder. PRTG inserts the value for the REST API request if you add %restplaceholder5 in the Request URL, POST Body, and Custom Headers fields of the REST Custom v2 sensor. PRTG does not display the value in the sensor log or the sensor's settings. |
Click ![]() to interrupt the inheritance.
to interrupt the inheritance.
The settings you define in this section apply to the following sensors:
Setting |
Description |
|---|---|
User Name |
Enter the user name for access to the Veeam Backup Enterprise Manager. |
Password |
Enter the password for access to the Veeam Backup Enterprise Manager. |
Port |
Enter the port for the connection to the Veeam Backup Enterprise Manager. The default port for secure connections is 9398. |
Click ![]() to interrupt the inheritance.
to interrupt the inheritance.
If you experience problems when you monitor via Windows sensors, use the following compatibility options for troubleshooting.
Setting |
Description |
|---|---|
Preferred Data Source |
Define the method that Windows sensors use to query data:
|
Timeout Method |
Select the time that the sensor waits for the return of the WMI query before the sensor cancels the query and shows an error message:
|
Timeout (Sec.) |
This setting is only visible if you select Set manually above. Enter the time the sensor waits for the return of its WMI query before it cancels it and shows an error message. Enter an integer. The maximum timeout value is 900 seconds (15 minutes). |
Click ![]() to interrupt the inheritance.
to interrupt the inheritance.
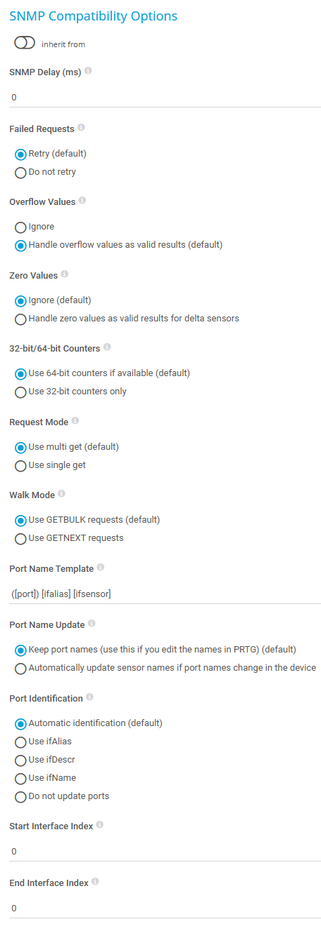
If you experience problems when you monitor via Simple Network Management Protocol (SNMP) sensors, use the following compatibility options for troubleshooting.
Setting |
Description |
|---|---|
SNMP Delay (ms) |
Enter the time in milliseconds (ms) that PRTG waits between two SNMP requests. You can define a delay between 0 and 100. Enter an integer.
|
Failed Requests |
Select if an SNMP sensor tries again after a request fails:
|
Overflow Values |
Select how PRTG handles overflow values. Some devices do not correctly handle internal buffer overflows. This can cause false peaks. PRTG can handle overflow values in two ways:
|
Zero Values |
Select how PRTG handles zero values. Some devices send incorrect zero values. This can cause false peaks. PRTG can handle zero values in two ways:
|
32-bit/64-bit Counters |
Select the type of traffic counters that PRTG searches for on a device:
|
Request Mode |
Select the request method that PRTG uses for SNMP sensors:
|
Walk Mode |
Select the kind of SNMP walk that PRTG uses for SNMP sensors:
|
Port Name Template |
Select how PRTG displays the name of SNMP sensors. Enter a template that uses several variables. When you add new sensors, PRTG scans the interface for available counters at certain OIDs. At each OID, several fields with interface descriptions are usually available. They are different for every device and OID. PRTG uses the information in these fields to name the sensors. If a field is empty or if it is not available, PRTG adds an empty string to the name. By default, the port name template is ([port]) [ifalias] [ifsensor], which creates a name like (001) Ethernet1 Traffic. You can use and combine any field names that are available at an OID of your device, for example:
|
Port Name Update |
Select how PRTG reacts if you change the names of ports in your physical device (for example, a switch or router):
|
Port Identification |
Select the field that PRTG uses for SNMP interface identification:
|
Start Interface Index |
Enter the index at which PRTG starts to query the interface range during sensor creation. Enter 0 for the automatic mode.
|
End Interface Index |
Enter the index at which PRTG stops querying the interface range during sensor creation. Enter 0 for the automatic mode.
|
Click ![]() to interrupt the inheritance.
to interrupt the inheritance.
The settings you define in this section apply to the following sensors:
The proxy settings determine how a sensor connects to a URL. You can enter data for an HTTP proxy server that sensors use when they connect via HTTP or HTTPS.
This setting only applies to sensors and how they monitor. For more information on how to change the proxy settings for the PRTG core server, see section Core & Probes.
The SSL Certificate sensor and the SSL Security Check sensor do not support HTTP proxies but you can configure connections via SOCKS proxies in the sensors' settings:
Setting |
Description |
|---|---|
IP Address/DNS Name |
Enter the IP address or Domain Name System (DNS) name of the proxy server. If you leave this field empty, sensors do not use a proxy.
|
Port |
Enter the port number of the proxy. The default port is 8080. Enter an integer. |
User Name |
If the proxy requires authentication, enter the user name for the proxy login. Enter a string or leave the field empty.
|
Password |
If the proxy requires authentication, enter the password for the proxy login. Enter a string or leave the field empty.
|
Connection Settings for Siemens S7
Click ![]() to interrupt the inheritance.
to interrupt the inheritance.
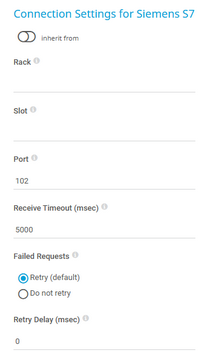
The settings you define in this section apply to the following sensors:
Setting |
Description |
|---|---|
Rack |
Enter the rack number of the CPU that this sensor monitors. You can define a rack from 0 to 7. |
Slot |
Enter the slot number of the CPU that this sensor monitors. You can define a slot from 0 to 31. |
Port |
Enter the port for the S7 protocol. The default port is 102. |
Receive Timeout (msec) |
Enter a receive timeout in milliseconds (msec). If the reply from the device takes longer than this value, PRTG aborts the request and triggers an error message. The default is 5000 msec (5 seconds). |
Failed Requests |
Select if PRTG tries again after a request fails:
|
Retry Delay (msec) |
Enter the time in msec that PRTG waits before it sends another READ request when a request fails. The default delay is 0 msec. You can define a delay between 0 and 100. |
Click ![]() to interrupt the inheritance.
to interrupt the inheritance.
Setting |
Description |
|---|---|
Scanning Interval |
Select a scanning interval from the dropdown list that determines the amount of time that the sensor waits between two scans:
|
If a Sensor Scan Fails |
Select the number of scanning intervals that the sensor has time to reach and to check a device again if a sensor scan fails. Depending on the option that you select, the sensor can try to reach and to check a device again several times before the sensor shows the Down status. This can avoid false alarms if the target device only has temporary issues. For previous scanning intervals with failed requests, the sensor shows the Warning status. The following options are available:
|
Schedules, Dependencies, and Maintenance Window
You cannot interrupt the inheritance for schedules, dependencies, and maintenance windows. The corresponding settings from the parent objects are always active. However, you can define additional schedules, dependencies, and maintenance windows. They are active at the same time as the parent objects' settings.
Setting |
Description |
|---|---|
Schedule |
Select a schedule from the list. You can use schedules to monitor during a certain time span (days or hours) every week:
|
Maintenance Window |
Select if you want to set up a one-time maintenance window:
|
Maintenance Begins |
This setting is only visible if you select Set up a one-time maintenance window above. Use the date time picker to enter the start date and time of the one-time maintenance window. |
Maintenance Ends |
This setting is only visible if you select Set up a one-time maintenance window above. Use the date time picker to enter the end date and time of the one-time maintenance window. |
Dependency Type |
Select a dependency type. You can use dependencies to pause monitoring for an object depending on the status of a different object:
|
Dependency |
This setting is only visible if you select Select a sensor above. Click |
Dependency Delay (Sec.) |
This setting is only visible if you select Select a sensor above. Define a time span in seconds for the dependency delay. After the master sensor for this dependency returns to the Up status, PRTG additionally delays the monitoring of the dependent objects by the time span you define. This can prevent false alarms, for example, after a server restart or to give systems more time for all services to start. Enter an integer. |
Click ![]() to interrupt the inheritance.
to interrupt the inheritance.
Setting |
Description |
|---|---|
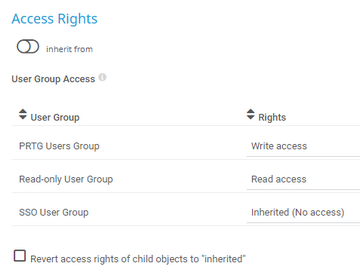
User Group Access |
Select the user groups that have access to the object. You see a table with user groups and group access rights. The table contains all user groups in your setup. For each user group, you can choose from the following group access rights:
To automatically set all child objects to inherit this object's access rights, select the Revert access rights of child objects to "inherited" option.
|
Click ![]() to interrupt the inheritance.
to interrupt the inheritance.
Setting |
Description |
|---|---|
Channel Unit Types |
For each type of channel, select the unit in which PRTG displays the data. If you define this setting on probe, group, or device level, you can inherit these settings to all sensors underneath. You can set units for the following channel types (if available):
|
Click ![]() to interrupt the inheritance.
to interrupt the inheritance.
Setting |
Description |
|---|---|
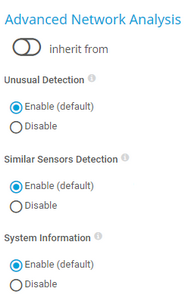
Unusual Detection |
Select if you want to use the unusual detection for sensors:
|
Similar Sensors Detection |
Select if you want to activate the similar sensors analysis:
|
System Information |
Select if you want to retrieve and show system information for your devices:
|
Setting |
Description |
|---|---|
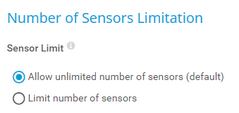
Sensor Limit |
Define a limit for the maximum number of sensors in this group, including subgroups:
|
Maximum Number of Sensors |
This setting is only visible if you select Limit number of sensors above. Define how many sensors are allowed in this group and its subgroups. Sensors that exceed this group sensor limit are set to the Paused state. Enter an integer.
|
Save your settings. If you change tabs or use the main menu without saving, all changes to the settings are lost.
KNOWLEDGE BASE
What security features does PRTG include?
How do I set permissions for the Amazon Web Services (AWS) API key to use certain sensors in PRTG?
Where can I find the Web Services API (WSAPI) port for the connection to the HPE 3PAR system?
How do I obtain credentials and set permissions for the Microsoft 365 Service Status sensors?
How do I obtain credentials and create custom roles for the Microsoft Azure sensors?
What is the Overflow Values setting in the SNMP Compatibility Options?
How can I change the defaults for names automatically generated for new SNMP sensors?
Automatically update port name and number for SNMP Traffic sensors when the device changes them


