PRTG Manual: NetApp SnapMirror Sensor
The NetApp SnapMirror sensor monitors SnapMirror relationships of a NetApp cDOT or ONTAP storage system accessing the application programming interface (API) via the Simple Object Access Protocol (SOAP).
For a detailed list and descriptions of the channels that this sensor can show, see section Channel List.
- Dutch: NetApp SnapMirror
- French: NetApp SnapMirror
- German: NetApp SnapMirror
- Japanese: NetApp SnapMirror
- Portuguese: NetApp SnapMirror
- Russian: NetApp SnapMirror
- Simplified Chinese: NetApp SnapMirror
- Spanish: NetApp SnapMirror
- This sensor requires .NET 4.7.2 or later on the probe system.
- The ONTAPI user account that you use with this sensor needs access to the DATA ONTAP API (ONTAPI) so that the sensor can request data from it. The access is enabled by default.
- For this sensor, read-only user rights are sufficient for the ONTAPI user account that you use to access ONTAPI. Modify or add this user with a suitable role in the console under Cluster | ClusterX | Configuration | Security | Users
- This sensor supports NetApp cDOT as of version 8.3 and NetApp ONTAP as of version 9.0.
- This sensor supports the IPv6 protocol.
- This sensor has a very low performance impact.
- You can define NetApp API credentials (User and Password) in the credentials for Windows systems settings of the parent device. This way, you do not have to individually enter credentials for each NetApp sensor that you add to the same device.
- This sensor uses lookups to determine the status values of one or more channels. This means that possible states are defined in a lookup file. You can change the behavior of a channel by editing the lookup file that the channel uses. For details, see section Define Lookups.
Requirement |
Description |
---|---|
.NET Framework |
This sensor requires the Microsoft .NET Framework. .NET 4.7.2 or later must be installed on the probe system (on every cluster node, if on a cluster probe). If the framework is missing, you cannot create this sensor.
|
Enabled ONTAPI access |
NetApp sensors require access to ONTAPI for the utilized user account. This is enabled by default. If access is disabled, locally use the following command on the cluster console to enable ONTAPI access for the user: services web> modify -vserver clusterd -name ontapi -enabled true |
The Add Sensor dialog appears when you manually add a new sensor to a device. It only shows the setting fields that are required for creating the sensor. Therefore, you do not see all setting fields in this dialog. You can change (nearly) all settings in the sensor's Settings tab later.
PRTG performs a meta-scan before you can actually add this sensor and requires basic information for this scan in advance. Provide the requested information in the appearing dialog box. During the scan, PRTG recognizes all items available for monitoring based on your input. The following settings differ in comparison to the sensor's Settings tab.
Select the SnapMirrors that you want to monitor. PRTG creates one sensor for each SnapMirror that you select in the Add Sensor dialog. The settings you select are valid for all sensors that you create when you finish this dialog. The following settings in the Add Sensor dialog differ in comparison to the sensor's Settings tab.
Setting |
Description |
---|---|
SnapMirrors |
Select the SnapMirrors that you want to add a sensor for. You see a list with the names of all items that you can monitor. Add check marks in front of the respective lines to select the desired items. You can also use the check box in the table header to select all items or cancel the selection.
|
Click the Settings tab of a sensor to change its settings.
Usually, a sensor connects to the IP Address or DNS Name of the parent device on which you created the sensor. See the device settings for details. For some sensors, you can explicitly define the monitoring target in the sensor settings. See below for details on available settings.
Setting |
Description |
---|---|
Sensor Name |
Enter a meaningful name to identify the sensor. By default, PRTG shows this name in the device tree, as well as in alarms, logs, notifications, reports, maps, libraries, and tickets.
|
Parent Tags |
Shows tags that the sensor inherits from its parent device, parent group, and parent probe. This setting is shown for your information only and cannot be changed here. |
Tags |
Enter one or more tags. Confirm each tag with the Spacebar key, a comma, or the Enter key. You can use tags to group objects and use tag-filtered views later on. Tags are not case-sensitive. Tags are automatically inherited.
The sensor has the following default tags that are automatically predefined in the sensor's settings when you add the sensor:
|
Priority |
Select a priority for the sensor. This setting determines the position of the sensor in lists. The highest priority is at the top of a list. Choose from the lowest priority ( |
Setting |
Description |
---|---|
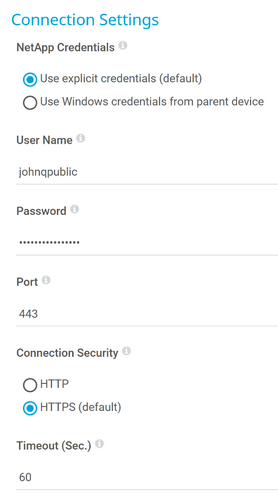
NetApp Credentials |
Specify which credentials you want to use to connect to the NetApp API:
|
Username |
This setting is only visible if you select Use explicit credentials above. Enter a username for access to the NetApp API. Read-only rights for this ONTAP user account are sufficient. Enter a string. |
Password |
This setting is only visible if you select Use explicit credentials above. Enter the password of the user that you entered above for access to the NetApp API. Enter a string. |
Port |
Enter a port number on which you can access the NetApp API. Enter an integer value. The default port is 443. |
Connection Security |
Define if the connection to the NetApp API is Secure Sockets Layer (SSL)/Transport Layer Security (TLS) secured:
|
Timeout (Sec.) |
Enter a timeout in seconds for the request. If the reply takes longer than this value, the sensor cancels the request and shows a corresponding error message. Enter an integer value. The maximum value is 900 seconds (15 minutes). |
NetApp Specific
Setting |
Description |
---|---|
SnapMirrors |
Shows the SnapMirror that this sensor monitors. Once you have created the sensor, you cannot change this value. It is shown for reference purposes only. If you need to change this value, add the sensor anew. |
Setting |
Description |
---|---|
Result Handling |
Define what PRTG does with the sensor result:
|
Setting |
Description |
---|---|
Primary Channel |
Select a channel from the list to define it as the primary channel. In the device tree, the last value of the primary channel is always displayed below the sensor's name. The available options depend on what channels are available for this sensor.
|
Graph Type |
Define how different channels are shown for this sensor:
|
Stack Unit |
This setting is only visible if you enable Stack channels on top of each other as Graph Type. Select a unit from the list. All channels with this unit are stacked on top of each other. By default, you cannot exclude single channels from stacking if they use the selected unit. However, there is an advanced procedure to do so. |
By default, all of the following settings are inherited from objects that are higher in the hierarchy. You should change them centrally in the root group settings if necessary. To change a setting for this object only, click under the corresponding setting name to disable the inheritance. You then see the options described below.
For more information, see section Inheritance of Settings.
Click to interrupt the inheritance.
Setting |
Description |
---|---|
Scanning Interval |
Select a scanning interval from the dropdown list. The scanning interval determines the amount of time that the sensor waits between two scans. Choose from:
|
If a Sensor Query Fails |
Select the number of scanning intervals that the sensor has time to reach and to check a device again if a sensor query fails. Depending on the option that you select, the sensor can try to reach and to check a device again several times before the sensor shows the Down status. This can avoid false alarms if the monitored device only has temporary issues. For previous scanning intervals with failed requests, the sensor shows the Warning status. Choose from:
|
Schedules, Dependencies, and Maintenance Windows
You cannot interrupt the inheritance for schedules, dependencies, and maintenance windows. The corresponding settings from the parent objects are always active. However, you can define additional schedules, dependencies, and maintenance windows. They are active at the same time as the parent objects' settings.
Setting |
Description |
---|---|
Schedule |
Select a schedule from the list. You can use schedules to monitor during a certain time span (days or hours) every week. Choose from:
|
Maintenance Window |
Select if you want to set up a one-time maintenance window. During a maintenance window, monitoring stops for the selected object and all child objects. They show the Paused status instead. Choose between:
|
Maintenance Begins |
This setting is only visible if you enable Set up a one-time maintenance window above. Use the date time picker to enter the start date and time of the one-time maintenance window. |
Maintenance Ends |
This setting is only visible if you enable Set up a one-time maintenance window above. Use the date time picker to enter the end date and time of the one-time maintenance window. |
Dependency Type |
Select a dependency type. You can use dependencies to pause monitoring for an object depending on the status of a different object. You can choose from:
|
Dependency |
This setting is only visible if you enable Select a sensor above. Click |
Dependency Delay (Sec.) |
This setting is only visible if you enable Select a sensor above. Define a time span in seconds for the dependency delay. After the master sensor for this dependency returns to the Up status, PRTG additionally delays the monitoring of the dependent objects by the time span you define. This can prevent false alarms, for example, after a server restart or to give systems more time for all services to start. Enter an integer value.
|
Click to interrupt the inheritance.
Setting |
Description |
---|---|
User Group Access |
Define the user groups that have access to the sensor. You see a table with user groups and group access rights. The table contains all user groups in your setup. For each user group, you can choose from the following group access rights:
|
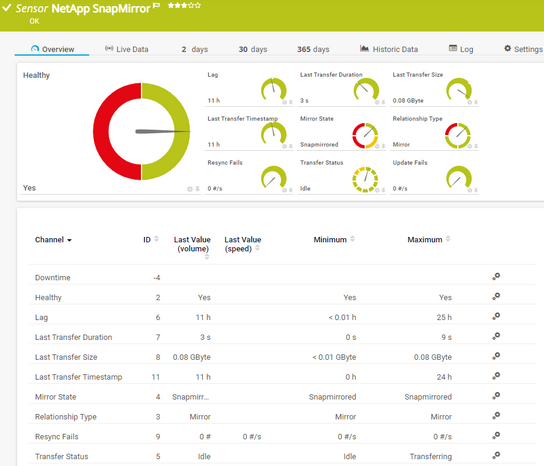
Which channels the sensor actually shows might depend on the monitored device, the available components, and the sensor setup.
Channel |
Description |
---|---|
Downtime |
In the channel table on the Overview tab, this channel never shows any values. PRTG uses this channel in graphs and reports to show the amount of time in which the sensor was in the Down status in percent. |
Healthy |
If the system is healthy
|
Lag |
The lag transfer duration |
Last Transfer Duration |
The duration of the last transfer |
Last Transfer Size |
The size of the last transfer |
Last Transfer Timestamp |
The time stamp of the last transfer |
Mirror State |
The mirror state
|
Relationship Type |
The relationship type
|
Resync Fails |
The number of resynchronization fails per second |
Transfer Status |
The transfer status (relationship status returned from the API)
|
Update Fails |
The number of update fails per second |
KNOWLEDGE BASE
Which .NET version does PRTG require?
What security features does PRTG include?
For more information about sensor settings, see the following sections: