PRTG Manual: Libraries
With the Libraries feature, you can create additional, customized views of your device tree.
For more information, see the video tutorial: Libraries in PRTG
In this section:
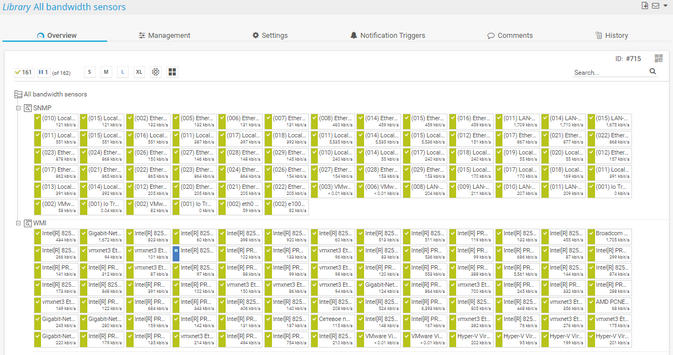
With libraries, you can create custom device tree views of your network's status and monitoring data. PRTG updates these views in the same interval as your device tree. The library views display the same monitoring data, but arranged the way you want, for example, based on target groups or a specific use case. For example, you can create a library that contains an overview of all your bandwidth monitoring sensors, regardless of the device that they run on.
The Libraries feature includes the following options:
- Create libraries that contain library nodes with objects from your entire configuration.
- Show data from different probes in one library.
- Show different branches of your device tree right next to each other.
- Arrange sensors in a tree-like view regardless of the device that they run on.
- Filter your entire device tree or parts of it by sensor type, status, or tag, and only show matching sensors.
PRTG provides several preconfigured libraries that you can also edit or delete.
Preconfigured libraries are only visible to administrators.
The following libraries are automatically created when you install PRTG for the first time. Some of these libraries are initially empty, but as you add more sensors, PRTG automatically fills them according to the filter settings defined for the library nodes:
- All bandwidth sensors
- All CPU load sensors
- All diskspace sensors
- All memory sensors
- All sensors grouped by state
- All VMware sensors
- Sensors grouped by priority
Sensors that you add to libraries do not count against the maximum number of sensors of your license.
Click Libraries in the main menu bar to open an overview list of all libraries. Hover over Libraries to show other options.
Option |
Description |
|---|---|
All |
Open the Libraries list where you can view or add custom device tree views of your network status and monitoring data. |
Add Library |
Open a dialog to create a new library. |
Select Library |
Open a library. Hover over Select Library to show more options. Follow the alphabetical menu path that is specific to your setup to view your libraries. Click a library to open it. |
In the All view, you see a list of all libraries. Enable the checkbox next to a library and use the quick action buttons:
- Used by (
 ): Show which objects use this library.
 - Clone (
 ): Create a clone of this library.
 - Delete (
 ): Delete this library.
 - Settings (
 ): Open this library and change the settings of the library and its library nodes.
To add a new library, hover over ![]() and select Add Library from the menu.
and select Add Library from the menu.
See also sections Working with Table Lists and Multi-Edit.
For more information on how to work with libraries, see the following sections:
PAESSLER WEBSITE
How to use libraries in PRTG in 4 steps
VIDEO TUTORIAL
Libraries in PRTG

