![]()
Network traffic analyzer PRTG
All-in-one monitoring tool for network traffic, data packets, bandwidth & more
- Detect network strain and maximize network performance
- Prevent issues before they occur with custom real-time alerts
- Visualize network status with easy-to-read dashboards
- Easily analyize network traffic by IP address, ports & more
Comprehensive network traffic analyzer that also monitors your entire IT infrastructure
Our users give top ratings for monitoring with Paessler PRTG


The complete solution for network traffic analysis
Network traffic analysis is easy with PRTG
Custom alerts and data visualization make it easy to monitor, identify, and prevent performance issues.
How you can benefit from our network traffic analyzer PRTG
Less need for help desk support
With Paessler PRTG, your network is more stable, which results in fewer help desk support requests. Let’s face it: working in your company's IT support team can be quite stressful, especially if problems and complaints are pressing and complicated. Save yourself this hassle with PRTG.
More time for important tasks
Our network traffic monitor with its customizable alerting system lets you concentrate on the really important tasks in your everyday work. If PRTG doesn't notify you of an issue, you can have total peace of mind knowing that everything's working as expected. Take the extra time to maintain your network or install new hardware, for example.
More time for capacity planning
PRTG monitors your network traffic as well as your entire IT infrastructure round the clock. This means that you do not only benefit from live data analysis, but also from historical monitoring data that you can compare and analyze. Use data collected over a longer period of time, for example, to optimize your network capacity planning.
What network traffic analysis looks like in PRTG
Diagnose network issues by continuously monitoring all your network traffic and bandwidth. Show traffic status in real time and visualize data in graphic maps & dashboards to more easily identify problems. Gain the visibility you need to troubleshoot issues with your network traffic.
![]() How PRTG defines sensors (FAQ)
How PRTG defines sensors (FAQ)
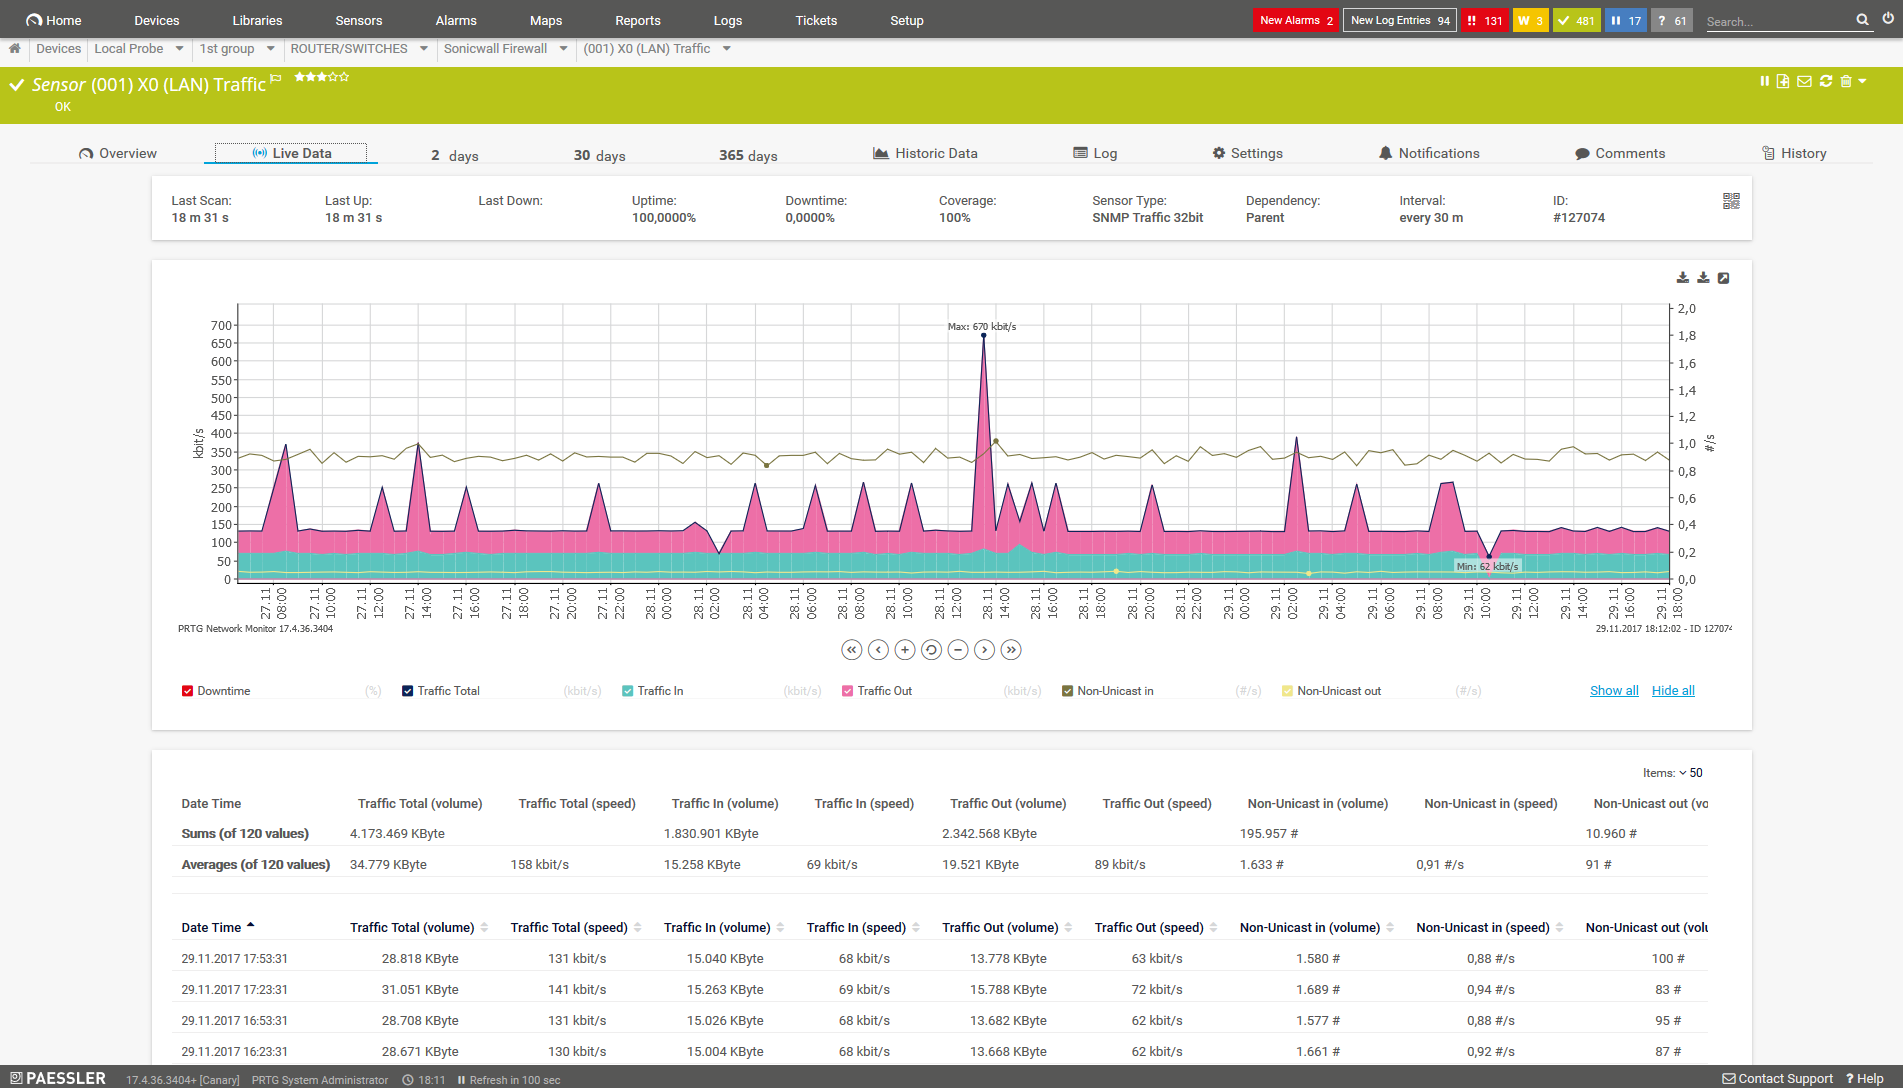
Live traffic graph for an SNMP Traffic sensor
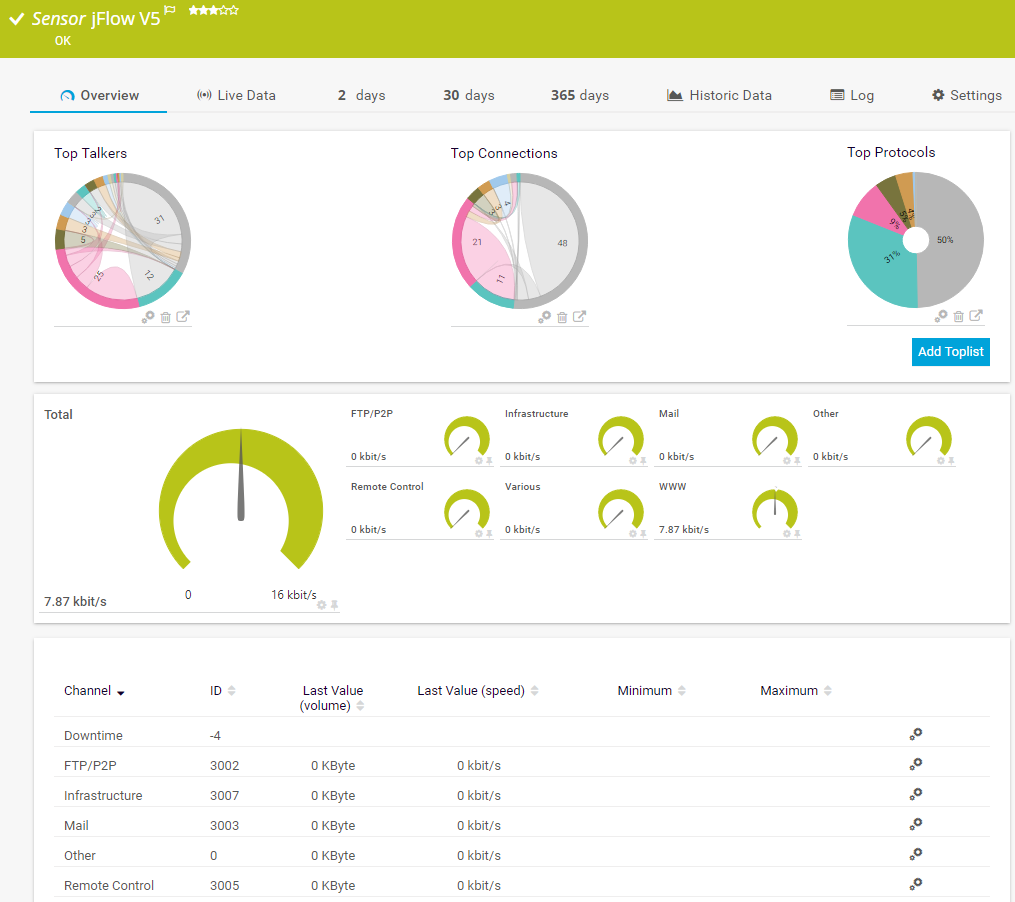
Toplists of an jFlow v5 sensor
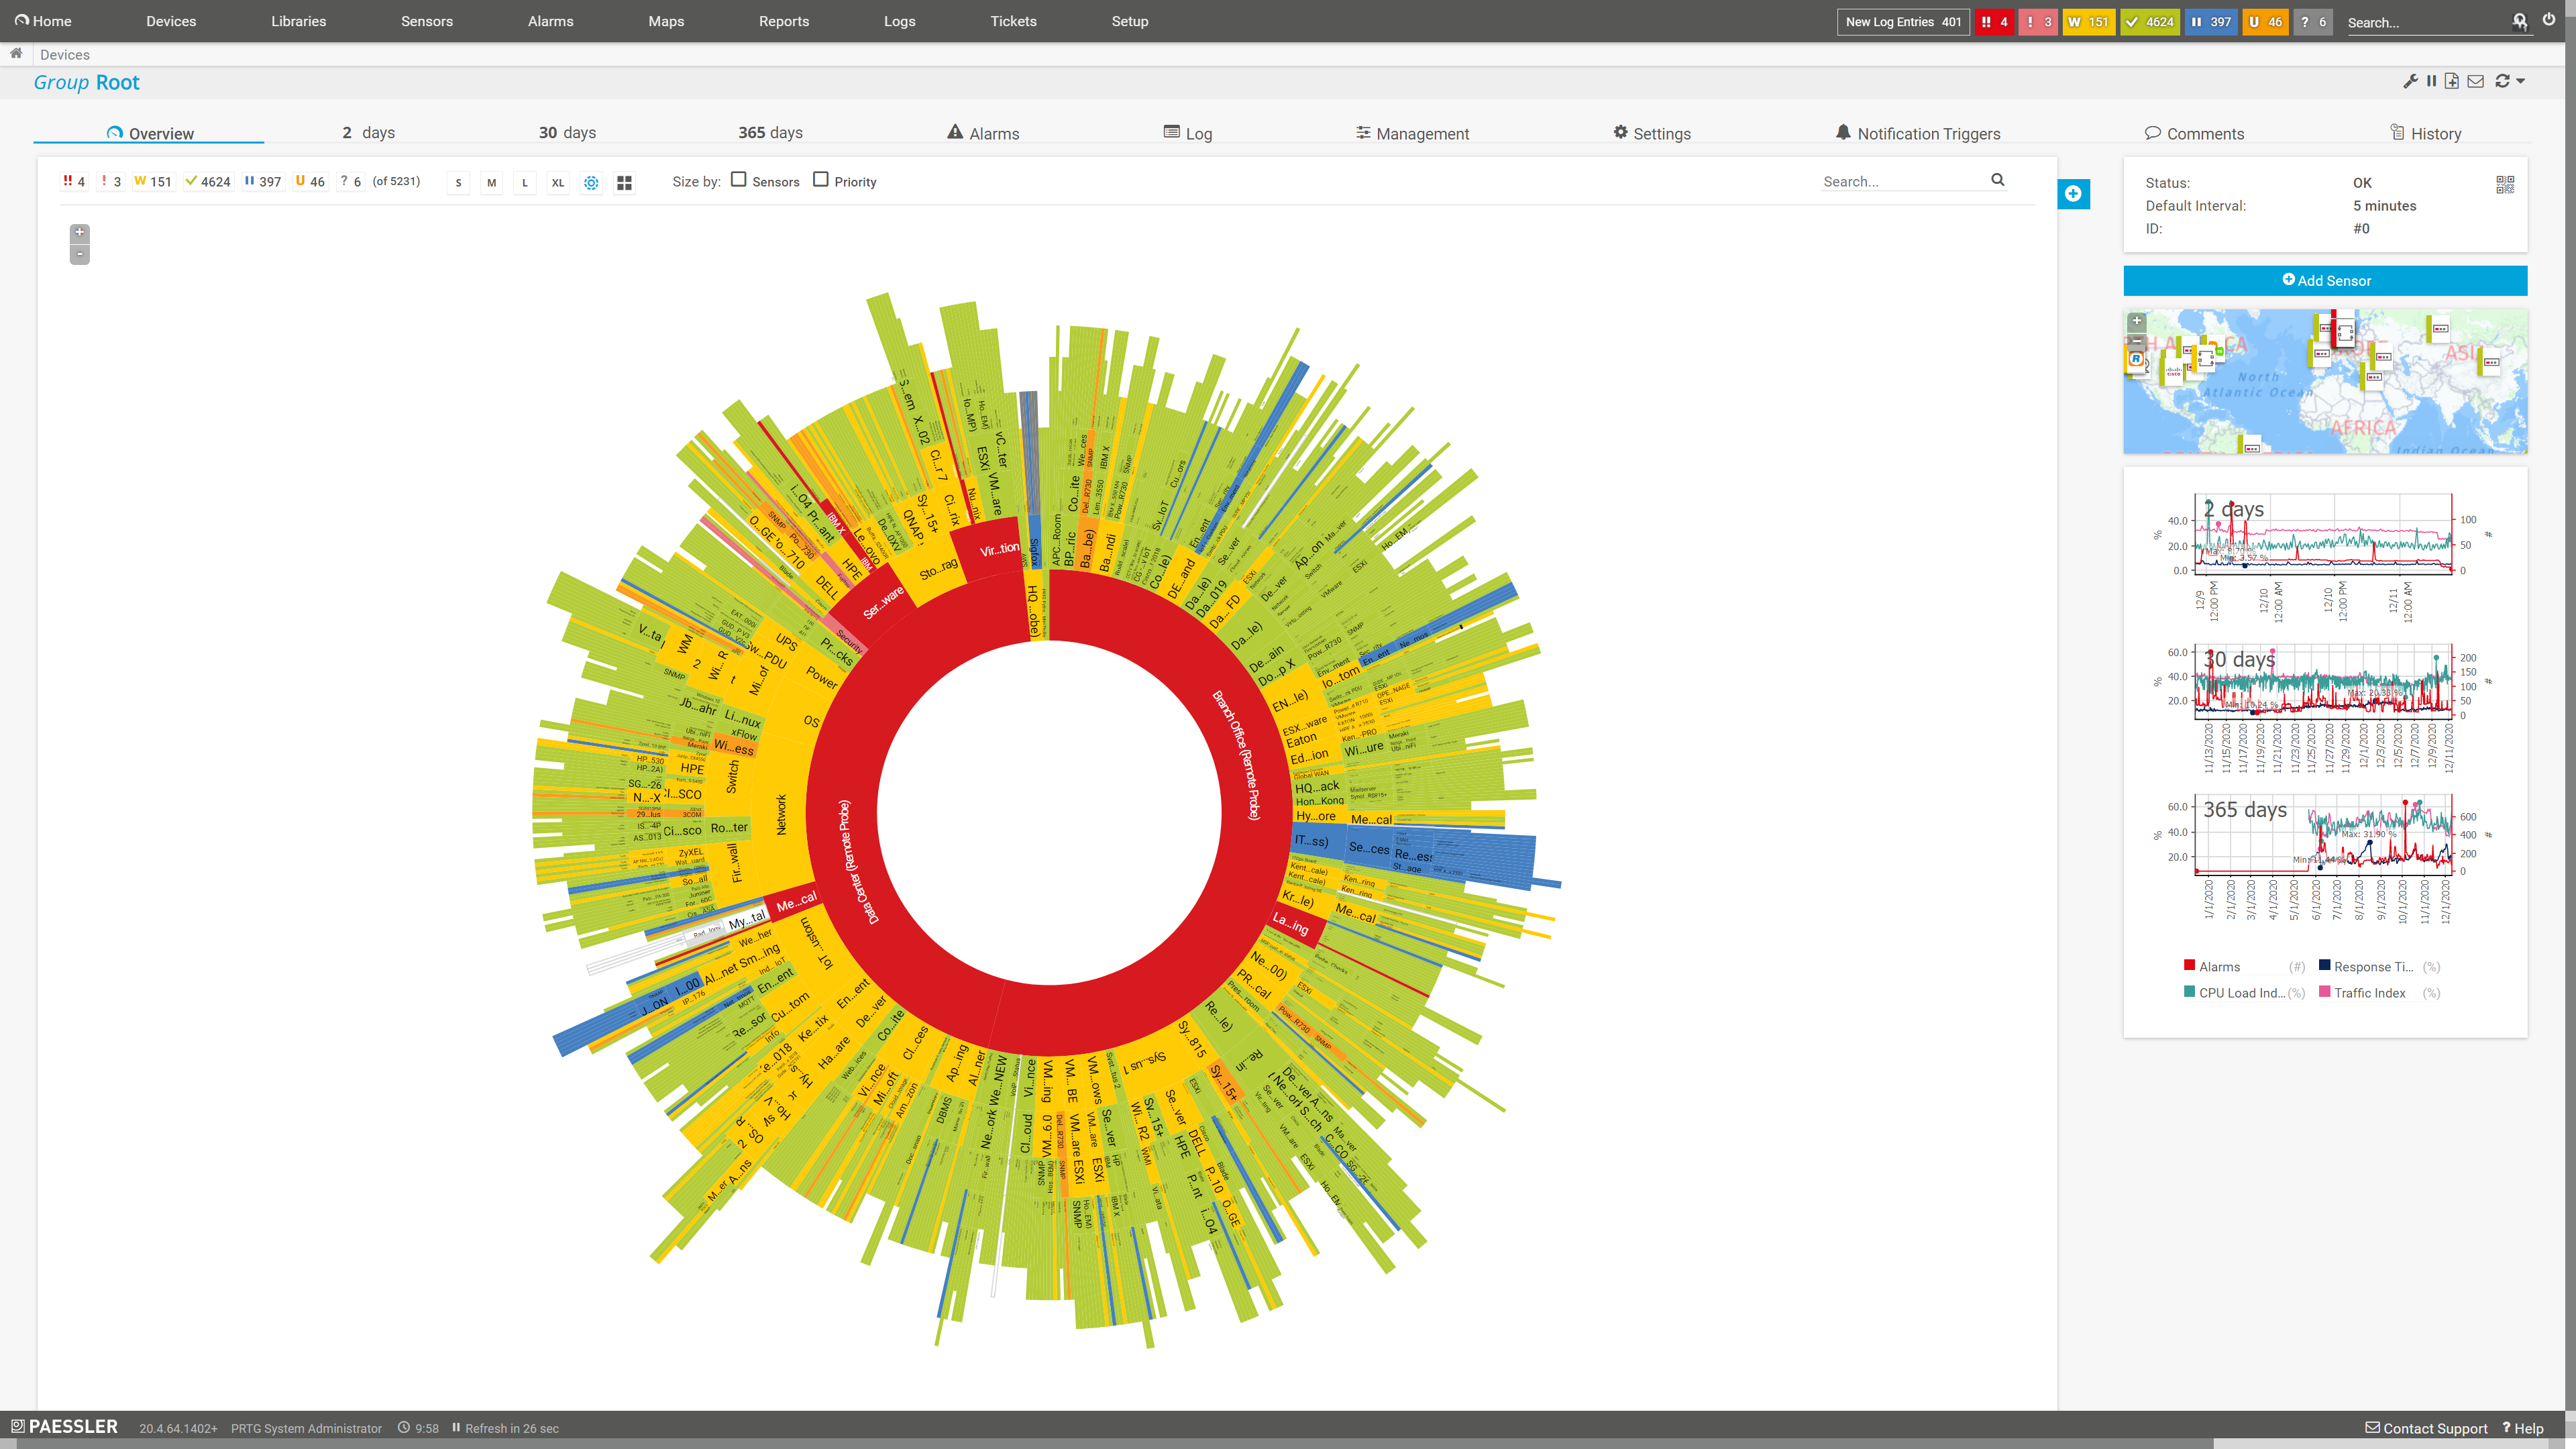
PRTG Sunburst view
Your network traffic monitor at a glance – even on the go
Set up PRTG in minutes and use it on almost any mobile device.


Start analyzing network traffic with PRTG and see how it can make your network more reliable and your job easier.
3 use cases for PRTG network traffic analyzer
Optimize the network
Get an overview of how much traffic is flowing through your network. You can also determine if your full data allowance is actually being used or if you can make do with less. PRTG lets you optimize network capacity planning in an easy way.
- Complete network traffic overview
- Determine data allowance usage
- Optimize network capacity planning
Analyze the network
Is your company’s internet connection becoming less reliable or do other errors occur in your network? With PRTG, you get a network traffic tool that analyzes your data consumption & uncovers the causes of network disruptions as well as bottlenecks and security leaks.
- Analyze network traffic data
- Troubleshoot network disruptions
- Identify bottlenecks and security leaks
Identify bandwidth hogs
Every network has a bandwidth hog. It might be an individual application, video stream, or overloaded WLAN. However, it could also be a simple print job containing some big files that are temporarily clogging the network. Our PRTG network analyzer helps you to identify bandwidth hogs at one glance.
- Detect high bandwidth consumption
- Identify network-clogging activities
- Visualize data in clear dashboards
Case study: Hume Bank uses PRTG for smooth operations
www.humebank.com.au
“PRTG lets us constantly work in accordance with the two-man rule. PRTG notifies us immediately if something is wrong in our network. Thanks to PRTG, we can use our time and resources for the things which really demand our attention.”
Brad Mennen, System Administrator at Hume Bank in Australia. Hume Bank uses PRTG to monitor its LANs, WANs, servers, website, applications, and more. To the case study
5 advantages of analyzing your network traffic with PRTG
![]()
One tool to monitor everything
Network traffic, speed, uptime, performance, servers, routers, switches, and more: PRTG is an all-in-one monitoring tool for your entire network. If problems occur, you’ll benefit from easy-to-read dashboards that show you the issue at a glance. With PRTG, finding the source of an error is quick and easy – which also means that you'll save both time and money.
What's more: with our PRTG apps for iOS or Android, you can display your network’s traffic on your tablet or smartphone. This is perfect when you're away from your desk, for example, while working on a rack in the server room.
![]()
Detailed reports for different purposes
Our PRTG network traffic analysis tool collects all monitoring data and displays live as well as historical data in structured charts and graphs. This data can also be included in highly customizable reports that you can send to individual people or entire teams automatically.
It is also possible to include information at different levels of depth. For example, you can use reports with easy-to read graphs to show non-IT managers why the company needs to invest in the network. With PRTG, you can not only configure the reports as such to meet your own specific needs – but also restrict data access as required.
![]()
Immediate alerting in case of an issue
Configure PRTG to send you alerts at different escalation levels. Set, for example, custom warning and error thresholds to be notified well in advance – such as when a sensor reveals a problem, but the affected network device is yet to fail. This means that you can react proactively and even before the error leads to a more serious issue.
Sysadmins love our software’s built-in, customizable notification system. It lets them confidently go about their daily tasks without having to constantly worry that something might go wrong with the network.
![]()
The right technology at hand
As a comprehensive network traffic analyzer, PRTG uses the following key technologies: SNMP, packet sniffing, flow protocols (NetFlow, jFlow, sFlow, IPFIX), WMI, and performance counters.
Whether you’re dealing with a Windows server or a Cisco router: with PRTG, you always have the suitable technology for your network traffic analysis right at your fingertips.
![]()
Long-term analysis of historical data
Capture network traffic not only in real time, but also over a longer period of time. This long-term data collection helps you to see if peak loads occur at regular intervals over and over again. Analyzing historical network traffic data with PRTG lets you quickly get to the root cause of the problem.
What’s more: if you’re faced with a critical issue and want to perform an in-depth analysis of your network traffic, you can easily use PRTG together with another traffic analysis tool such as Wireshark. This enables you to get an even more comprehensive look at the flow of your data.
IT experts agree: Paessler PRTG is a great solution for IT infrastructure monitoring

“All-around winning
network monitor”

“The real beauty of PRTG is the endless possibilities it offers”

“PRTG Network Monitor
is very hard to beat”
PRTG is compatible with all major vendors & manufacturers
![]()
Reduce costs with our network traffic analyzer
Save money by buying bandwidth & hardware according to actual load.
PRTG vs. other network traffic analysis tools
As an administrator, you need to optimize your network performance. But should you use an array of small tools or one central monitoring tool for your entire IT infrastructure?
Other tools: limited network traffic
analysis
Administrators need network traffic analysis tools to measure and analyze the traffic in their IT infrastructure. Some tools let you have a detailed look into the live data of a network.
Wireshark, for example, captures live, unfiltered network traffic. Analyzing this data, however, is difficult unless you know what to look for. Moreover, these tools don't offer the same comprehensive feature set as PRTG does.
PRTG: all-in-one network analysis & monitoring
PRTG provides structured, long-term recording of your network traffic data so that you can easily compare and analyze the data set if issues come up.
Instead of managing numerous small tools to comprehensively monitor and analyze your network traffic, PRTG provides you with combined network analysis & IT infrastructure monitoring – all in one tool and at one glance.
“Cisco has continuously developed the NetFlow technology. Administrators must therefore find out beforehand which NetFlow version is supported by their routers and switches. With the right PRTG sensors, setting up NetFlow monitoring is quick and easy.” Gerald Schoch, release manager at Paessler
Practical tip: “Hey Gerald, what would you tell administrators looking to use PRTG as a NetFlow Analyzer?”
![]()
SNMP
PRTG comes with several preconfigured SNMP sensors for general monitoring via SNMP, a protocol that puts very little strain on CPU and network load.
For an overview of your network traffic, choose the SNMP Traffic sensor. A detailed network analysis including traffic filters, however, is not possible with this sensor.
![]()
Packet sniffing
With packet sniffing, you can analyze header traffic in more detail and filter traffic by IP addresses, protocols, and types of data. This technology generates much higher CPU and network load than SNMP, however.
Set up the Packet Sniffer sensor to monitor web traffic, mail traffic, file transfer traffic, and more.
![]()
Flow protocols
Flow protocols (NetFlow, IPFIX, jFlow, sFlow) are best suited for Cisco, Juniper, and HPE routers but are used by other manufacturers as well.
With flow technologies, you can carry out an in-depth analysis of your network traffic – in comparison to packet sniffing, for example, with which you can only analyze header traffic.
![]()
WMI
With Windows Management Instrumentation (WMI) and Windows performance counters, you can monitor and analyze network traffic on your Windows servers.
Compared to other technologies for network traffic analysis, WMI needs the most network resources. SNMP is a good alternative if you are looking to minimize strain on your network.
![]()
And more
PRTG supports many other technolgies for monitoring your entire IT infrastructure, for example, SSH, HTTPS, or SOAP.
In addition, it supports other network utilities like ping, nslookup, and traceroute.
Our network traffic analyzer saves you time and money

Comprehensively monitor your network traffic
Filter traffic by IP address, protocol & more
Keep an eye on data packets that pass your network
Use SNMP, packet sniffing, WMI, or flow technologies
Discover our preconfigured PRTG sensors for network traffic analysis
Here are some examples of sensors that can be used for network traffic analysis with PRTG.
Packet Sniffer
The Packet Sniffer sensor monitors the headers of data packets that pass a local network using a built-in packet sniffer. The sensor can show the following traffic types:
- Chat (IRC, AIM)
- Citrix
- FTP/P2P
- Mail, WWW
- Remote control (RDP, SSH, Telnet, VNC)
Note: The sensor only analyzes header traffic.
NetFlow v5
The NetFlow v5 sensor shows traffic for devices that support NetFlow v5. Traffic types include:
- Chat (IRC, AIM)
- Citrix
- FTP/P2P
- Mail, WWW
- Remote control (RDP, SSH, Telnet, VNC)
NetFlow v9
The NetFlow v9 sensor shows traffic for devices that support NetFlow v9. Traffic types include:
- Chat (IRC, AIM)
- Citrix
- FTP/P2P
- Mail, WWW
- Remote control (RDP, SSH, Telnet, VNC)
Windows Network Card
The Windows Network Card sensor monitors bandwidth usage and traffic on a network interface using WMI or Windows Performance Counters and can show among others:
- Total traffic on the network card
- Number of received and sent packets
- Number of discards, errors, unicast packets, and unknown protocols
And more...
Find more of our preconfigured PRTG network traffic analyzer sensors, including custom sensors for monitoring network traffic the way you need, here: List of available sensor types
An overview: WMI, SNMP, packet sniffing, flow protocols
|
| WMI | SNMP | Packet Sniffing | Flow (IPFIX, NetFlow, sFlow, jFlow) |
|---|---|---|---|---|
| Setup | Medium | Easy | Easy to complex (depending on filter rules used) | Can be complex (for example, the switch must be configured) |
| Traffic can be filtered |
|
|
| |
| Differentiate bandwidth usage by protocol or IPs |
|
|
|
|
| PRTG can show toplists (Top Talkers, Top Connections, Top Protocols, custom) |
|
|
|
|
| Filter bandwidth usage by IP address |
|
|
| |
| Filter bandwidth usage by MAC address |
|
|
|
|
| Filter bandwidth usage by physical network port |
|
|
|
|
| Monitor network parameters other than bandwidth usage |
|
|
|
|
| CPU load on the system running PRTG | Medium | Low | Higher, depends on the amount of traffic | Higher, depends on the amount of traffic |
| Excess bandwidth usage of monitoring | Small | Small | None (except if switch ports are monitored) | Depends on the traffic |
![]()
“We can all work with greater peace of mind knowing
that our systems are constantly being monitored.”
Markus Puke, Network Administrator, Schüchtermann Klinik, Germany
Easily find the source of the problem with PRTG network traffic analyzer
Real-time alerts and custom notifications make it easy to solve issues with network performance & bottlenecks.
Network traffic monitoring: active or passive?
Two everyday examples
![]()
Active: the sysadmin puts out a fire
The day starts well. Then, all of a sudden, the network crashes. E-mails stay put in the outbox, applications slow down to a snail’s pace, and the technical support hotline doesn’t stop ringing anymore.
The sysadmin immediately gets to work. They need to look for a tool that displays their network’s traffic to get down to the root cause of the failure. They search, compare data, and, after a very long time, finally find and troubleshoot the issue. The problem: in the meantime, they’ve not only lost a lot of time, but also nerves and money.
![]()
Passive: a 24 x 7 tool
With a network traffic monitoring & analysis tool like PRTG, the sysadmin can monitor the traffic in their network round the clock. They’ll quickly be able to tell if the volume of data has increased, and with it the strain on the entire IT infrastructure.
At the first sign of a possible disruption, PRTG sends them an alert so that they can take action proactively and upgrade the weak spots in their network. This way, they can go about their daily business with peace of mind knowing that if PRTG doesn’t notify them, everything’s working fine.

PRTG: The multi-tool for sysadmins
Adapt PRTG individually and dynamically to your needs and rely on a strong API:- HTTP API: Access monitoring data and manipulate monitoring objects via HTTP requests
- Custom sensors: Create your own PRTG sensors for customized monitoring
- Custom notifications: Create your own notifications and send action triggers to external systems
- REST Custom sensor: Monitor almost everything that provides data in XML or JSON format
Create innovative solutions with Paessler’s partners
Partnering with innovative vendors, Paessler unleashes synergies to create
new and additional benefits for joined customers.


With ScriptRunner, Paessler integrates a powerful event automation platform into PRTG Network Monitor.
ScriptRunner
PRTG provides many custom options for monitoring and analyzing your network traffic
Choose and customize your monitoring sensors as you see fit to save time and money where it counts.
PRTG makes your job easier
Our monitoring software frees you to focus on other tasks by promptly notifying you of potential issues.
![]()
Save effort
PRTG gives you one central monitoring tool for your servers and entire network. Enjoy a quick overview of your whole infrastructure via our dashboard and app.
![]()
Save time
Getting started with PRTG is a breeze. Setting up or switching from another network monitoring tool is easy thanks to the auto-discovery and pre-configured device templates.
![]()
Save money
80% of our customers report substantial cost savings with network monitoring. Your costs of licenses will likely pay for themselves within weeks.
We asked: would you recommend PRTG?
Over 95% of our customers say yes!
Paessler conducted trials in over 600 IT departments worldwide to tune its network monitoring software closer to the needs of sysadmins.
The result of the survey: over 95% of the participants would recommend PRTG – or already have.

Start using our network traffic analyzer PRTG and see how it can make your network more reliable and your job easier.
Network traffic analyzer FAQs
1. What is network traffic?
Network traffic is defined as the amount of data that passes through a network at a given point in time.
2. What technologies are used for network traffic analysis?
For analyzing network traffic, you can use technologies such as SNMP, WMI, packet sniffing, or flow (NetFlow, jFlow, sFlow, IPFIX). Choosing the right technology depends on the system you use, the manufacturers of your network devices, and the load on your network.
3. What does a network traffic analyzer do?
Network traffic analysis is the process of collecting and examining data from a network in order to understand and improve its performance. It can help identify bottlenecks in the system that may be causing slowdowns or impacting quality of service for end users.
4. What tool do I use for monitoring & analyzing network traffic?
PRTG is the perfect tool for network monitoring and analysis. It is known for being a powerful tool for system administrators and IT professionals, allowing them to detect network issues quickly and troubleshoot network errors in real-time.
What’s more: PRTG not only offers network traffic monitoring – with it, you can also monitor your entire IT infrastructure and benefit from a comprehensive & customizable alerting, notification, reporting, and visualization system.
5. What is NetFlow?
NetFlow is a protocol for collecting, aggregating, and recording traffic flow data in a network. NetFlow data provide a more granular view of bandwidth and network traffic in comparison to SNMP, for example. NetFlow was developed by Cisco and is integrated in Cisco’s IOS software on the company’s routers and switches.
6. What is a sensor in PRTG?
In PRTG, “sensors” are the basic monitoring elements. One sensor usually monitors one measured value in your network, for example the traffic of a switch port, the CPU load of a server, or the free space on a disk drive.
On average, you need about 5-10 sensors per device or one sensor per switch port.
Learn about other types of PRTG monitoring
Jitter monitoring
Monitor network jitter, run jitter tests, and keep an eye on VoIP and QoS

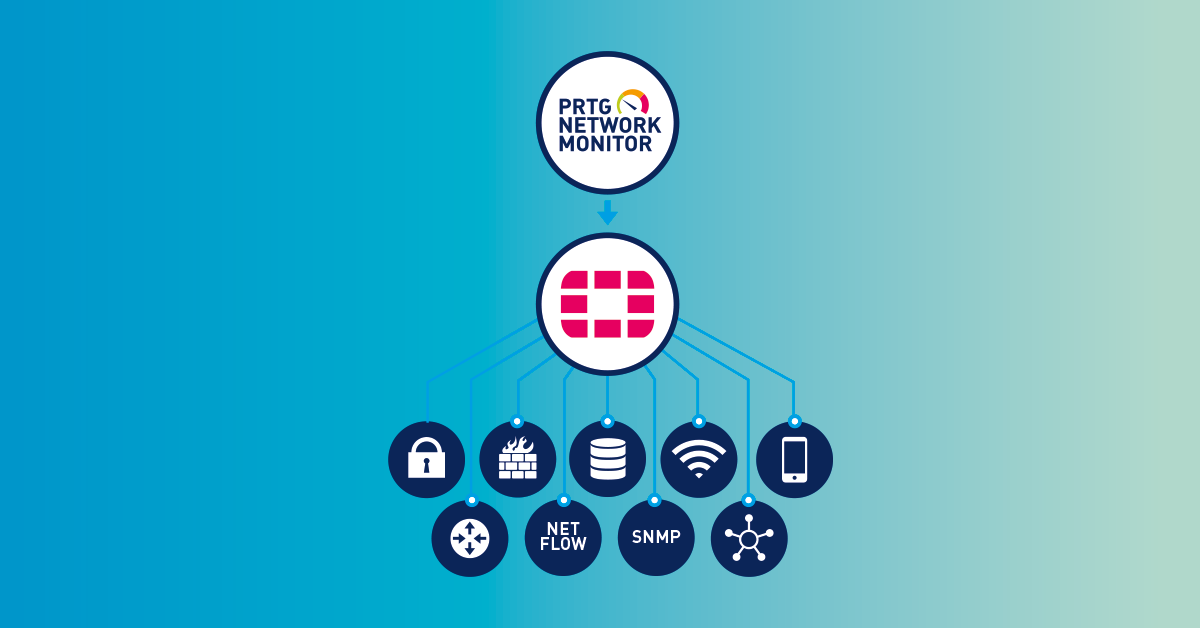
Fortinet monitoring
Monitor system health & VPN connections of FortiGate firewalls out-of-the-box
Still not convinced?
More than 500,000
sysadmins love PRTG
Paessler PRTG is used by companies of all sizes. Sysadmins love PRTG because it makes their job a whole lot easier.
Monitor your entire IT infrastructure
Bandwidth, servers, virtual environments, websites, VoIP services – PRTG keeps an eye on your entire network.
![]()
Start analyzing your network with PRTG and see how it can make your network more reliable and your job easier.
|
PRTG |
Network Monitoring Software - Version 24.2.96.1375 (June 26th, 2024) |
|
Hosting |
Download for Windows and cloud-based version PRTG Hosted Monitor available |
Languages |
English, German, Spanish, French, Portuguese, Dutch, Russian, Japanese, and Simplified Chinese |
Pricing |
Up to 100 sensors for free (Price List) |
Unified Monitoring |
Network devices, bandwidth, servers, applications, virtual environments, remote systems, IoT, and more |
Supported Vendors & Applications |
|
Combining the broad monitoring feature set of PRTG with IP Fabric’s automated network assurance creates a new level of network visibility and reliability.