Custom alerts and data visualization let you quickly identify and prevent corrupted data, hardware errors, low disk space, and other database performance issues.
SQL databases are an absolutely critical part of your network.
They keep your data accurate, consistent, and reliable, and applications and services working efficiently. More importantly, they ensure your organization runs smoothly (and your colleagues and bosses are happy).
Don't let corrupt data, faulty configurations, and other database issues bring your network down. With Paessler PRTG's powerful network monitoring software, you can consistently maintain optimal availability and performance.

All your database health stats in one place. Get a comprehensive overview of hardware status, availability, execution times, read/write speed, disk space, memory, and other important database performance indicators, and prepare reports for your higher-ups in a few clicks.
Want to monitor specific parameters using self-defined SQL queries? Need to create custom reports or optimize business processes? PRTG has got you covered. Our Oracle monitoring software is flexible by design, so you can choose what to track and how the data's presented.
When it comes to your network's health, prevention is always better than cure. PRTG spots potential issues before they become critical errors. That means they're easier and quicker to fix, saving you stress and frustration (and angry calls from annoyed colleagues).
Diagnose network issues by continuously tracking Oracle database servers across your network. Show response times, wait times, disk space, active sessions, and other performance metrics in real time. Visualize monitoring data in clear graphs and dashboards to identify problems more easily. Gain the overview you need to troubleshoot configuration errors, underperformance, and other issues with your Oracle instances for enhanced end-user experience.

Device tree view of the complete monitoring setup

Custom PRTG dashboard for keeping an eye on the entire IT infrastructure
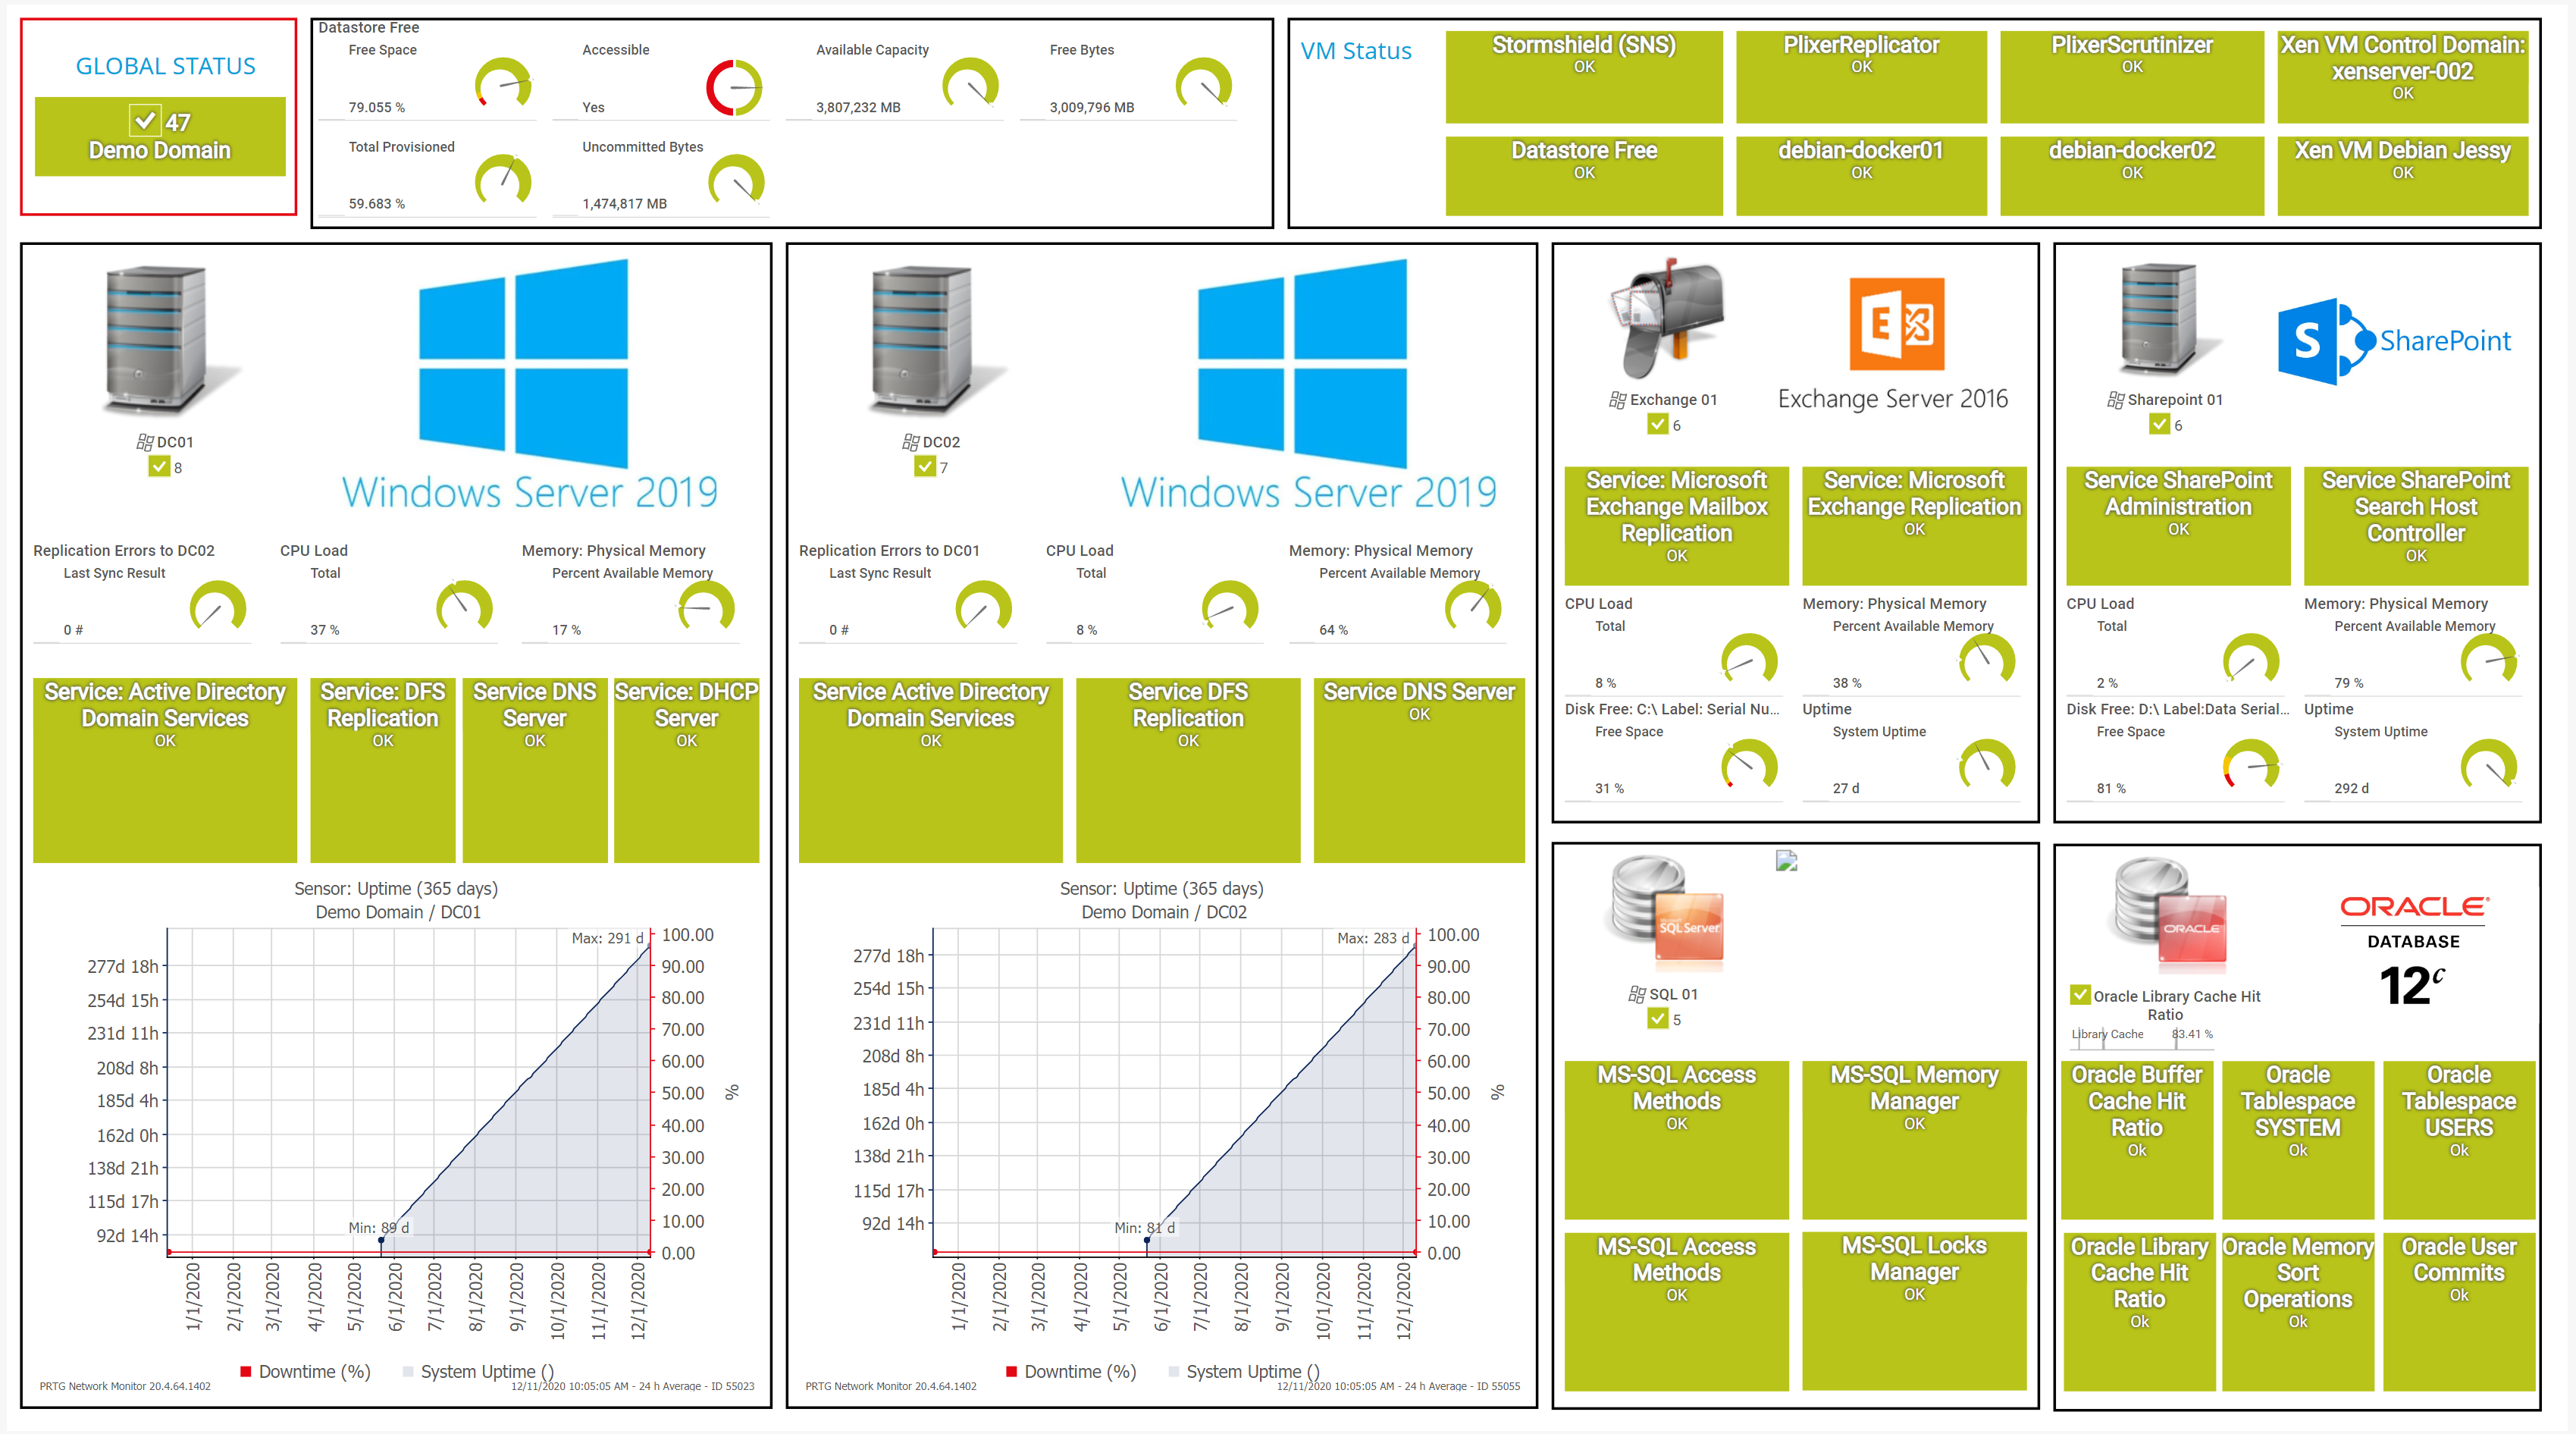
Custom PRTG dashboard for keeping an eye on the entire IT infrastructure
“All-around winning
network monitor”
“The real beauty of PRTG is the endless possibilities it offers”
“PRTG Network Monitor
is very hard to beat”
PRTG comes with more than 250 native sensor types for monitoring your entire on-premises, cloud, and hybrid cloud environment out of the box. Check out some examples below!
The Oracle SQL v2 sensor monitors a database on an Oracle server and executes a query. It can show the following:
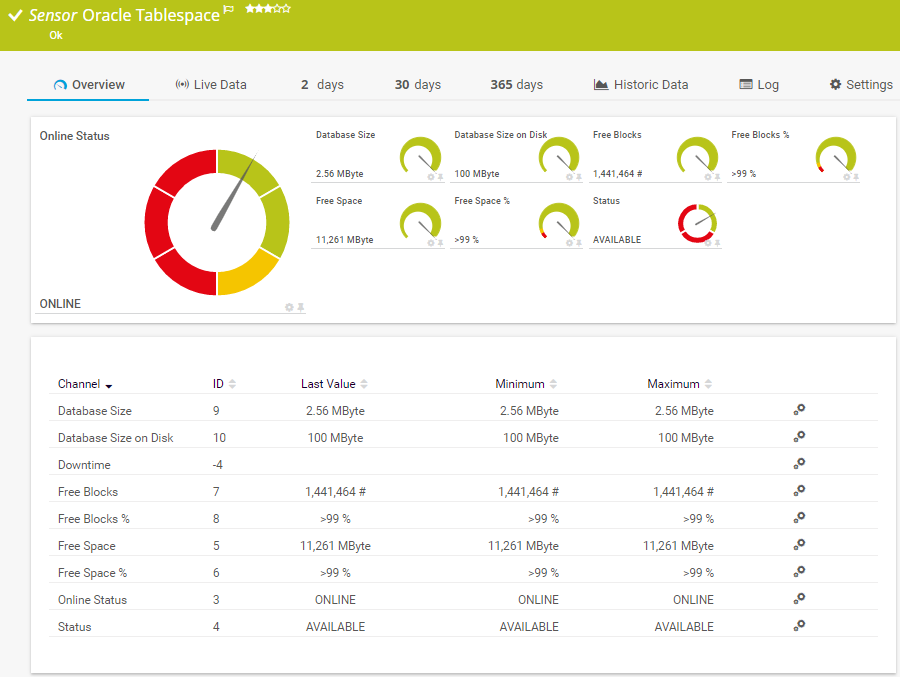
The Oracle Tablespace sensor monitors a tablespace on an Oracle server. It can show the following:
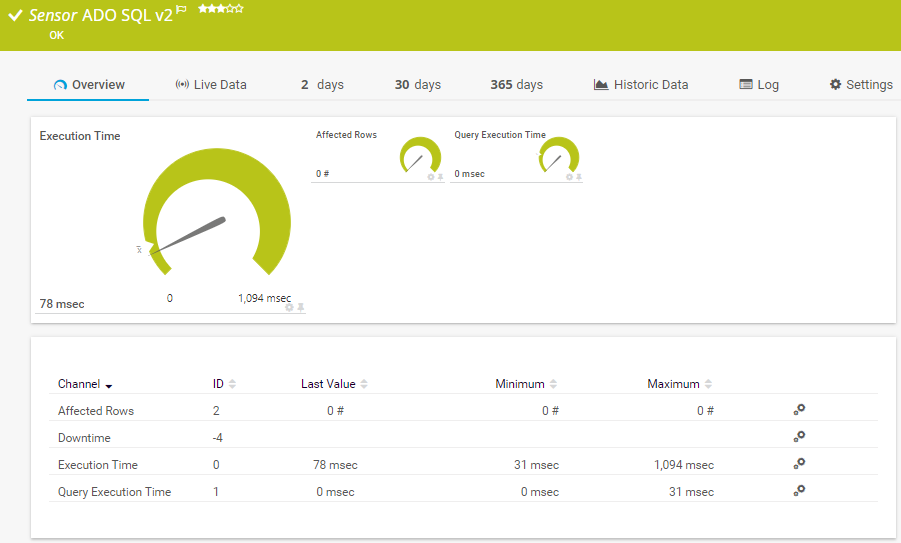
The ADO SQL v2 sensor monitors a database via an ActiveX Data Objects (ADO) connection and it executes an SQL query. It can show the following:
See the PRTG Manual for a list of all available sensor types.

Custom alerts and data visualization let you quickly identify and prevent corrupted data, hardware errors, low disk space, and other database performance issues.
PRTG is set up in a matter of minutes and can be used on a wide variety of mobile devices.


“Excellent tool for detailed monitoring. Alarms and notifications work greatly. Equipment addition is straight forward and server initial setup is very easy. ...feel safe to purchase it if you intend to monitor a large networking landscape.”
Partnering with innovative IT vendors, Paessler unleashes synergies to create
new and additional benefits for joined customers.
Combining PRTG’s broad monitoring feature set with IP Fabric’s automated network assurance creates a new level of network visibility and reliability.
Siemon and Paessler bring together intelligent building technology and advanced monitoring and make your vision of intelligent buildings and data centers become reality.
UVexplorer integrates tightly with PRTG to bring fast and accurate network discovery, detailed device inventory, and automatic network mapping to the PRTG platform.
Real-time notifications mean faster troubleshooting so that you can act before more serious issues occur.
Network Monitoring Software – Version 26.1.116.1532 (February 9th, 2026)
Download for Windows and cloud-based version PRTG Hosted Monitor available
English, German, Spanish, French, Portuguese, Dutch, Russian, Japanese, and Simplified Chinese
Network devices, bandwidth, servers, applications, virtual environments, remote systems, IoT, and more
Choose the PRTG Network Monitor subscription that's best for you

A Relational Database Management System (RDBMS) is a type of database management system (DBMS) that organizes data into tables with rows and columns, where each row represents a record and each column represents a specific attribute or field.
RDBMSs use structured query language (SQL) for managing and querying data. They provide mechanisms for ensuring the integrity and consistency of data through features like transactions, constraints, and referential integrity.
PRTG is a proprietary software tool that tracks the health and performance of Oracle databases and other important components of your enterprise network. Available for on-premises Windows and Linux servers or as a cloud-hosted SaaS monitoring service, it's capable of monitoring unlimited local, remote, and virtual network devices, bringing critical system data together in one simple, intuitive interface you can access from anywhere: at the office, at home, or on the go.
Yes. PRTG has preconfigured sensors for most major SQL database vendors, including Microsoft SQL, MySQL, and PostgreSQL. And if you need to enhance the functionality of Paessler PRTG and benefit from even more advanced database monitoring, check out our new product extension PRTG Database Observer.
Using Oracle monitoring software like PRTG has several benefits, for example:
In an SQL database, data is organized into tables, each with predefined columns and data types. SQL (Structured Query Language) is used to define, manipulate, and query the data. When a query is executed, the database management system (DBMS) interprets and optimizes the SQL statements to interact with the underlying data.
The DBMS processes queries using algorithms to efficiently retrieve, update, or delete records. Additionally, SQL databases enforce data integrity through constraints like primary keys, foreign keys, and unique constraints, ensuring consistency and reliability in the stored data.
In PRTG, “sensors” are the basic monitoring elements. One sensor usually monitors one measured value in your network, for example the traffic of a switch port, the CPU load of a server, or the free space on a disk drive. On average, you need about 5-10 sensors per device or one sensor per switch port.
Paessler conducted trials in over 600 IT departments worldwide to tune its network monitoring software closer to the needs of sysadmins. The result of the survey: over 95% of the participants would recommend PRTG – or already have.

Paessler PRTG is used by companies of all sizes. Sysadmins love PRTG because it makes their job a whole lot easier.
Bandwidth, servers, virtual environments, websites, VoIP services – PRTG keeps an eye on your entire network.
Everyone has different monitoring needs. That’s why we let you try PRTG for free.