Custom alerts and data visualization let you quickly identify and prevent performance issues such as slow response times or hardware overloads.
Performance bottlenecks lead to serious business impacts, such as slow responses, delayed transactions, and poor end user experience. Paessler PRTG, your all-in-one database monitoring tool, helps keep your colleagues happy by making sure your databases stay reliable, fast, and efficient.
Diagnose network issues by continuously tracking response time, latency, query execution time, and hardware health. Show key database performance metrics in real time. Visualize monitoring data in clear graphs and dashboards to identify problems more easily. Gain the overview you need to troubleshoot database bottlenecks, outages, and other database performance issues.
MS SQL Database with PRTG

Device tree view of the complete monitoring setup

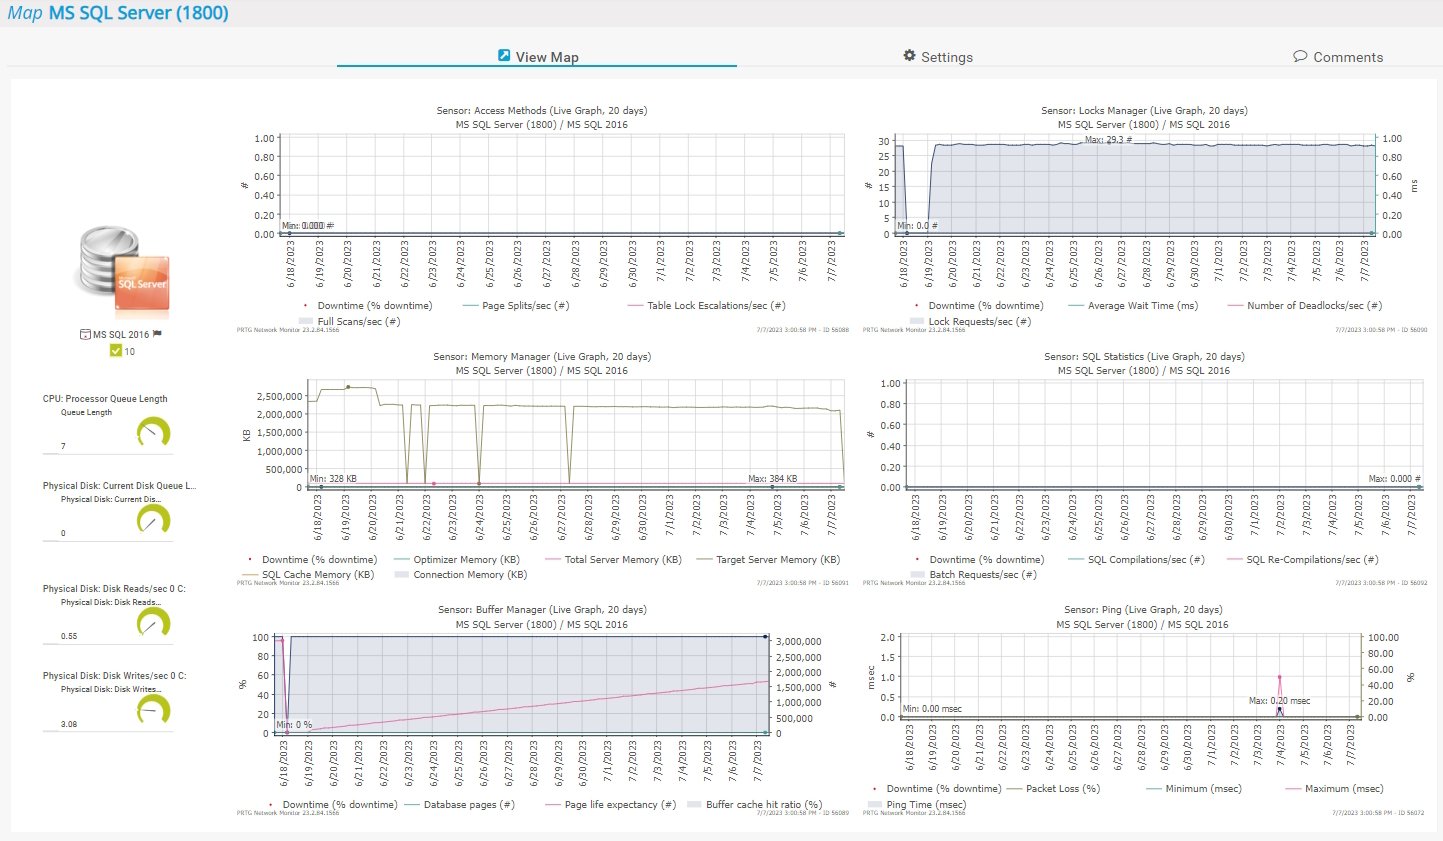
Custom PRTG dashboard for keeping an eye on the entire IT infrastructure

Live traffic data graph in PRTG
“All-around winning
network monitor”
“The real beauty of PRTG is the endless possibilities it offers”
“PRTG Network Monitor
is very hard to beat”
PRTG comes with more than 250 native sensor types for monitoring your entire on-premises, cloud, and hybrid cloud environment out of the box. Check out some examples below!
The Microsoft SQL v2 sensor monitors a database on a Microsoft SQL server and executes a query. It can show the following:
The Oracle SQL v2 sensor monitors a database on an Oracle server and executes a query. It can show the following:
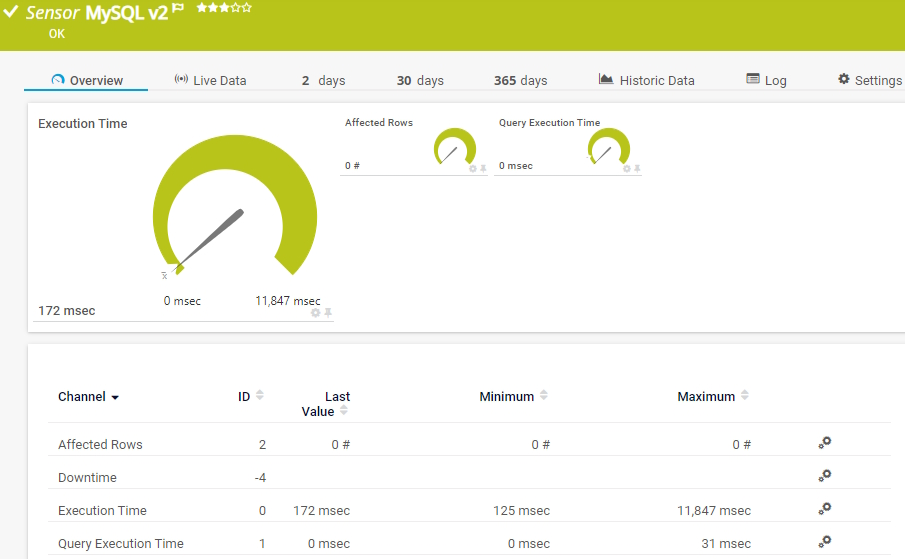
The MySQL v2 sensor monitors a database on a MySQL server and executes a query. It can show the following:
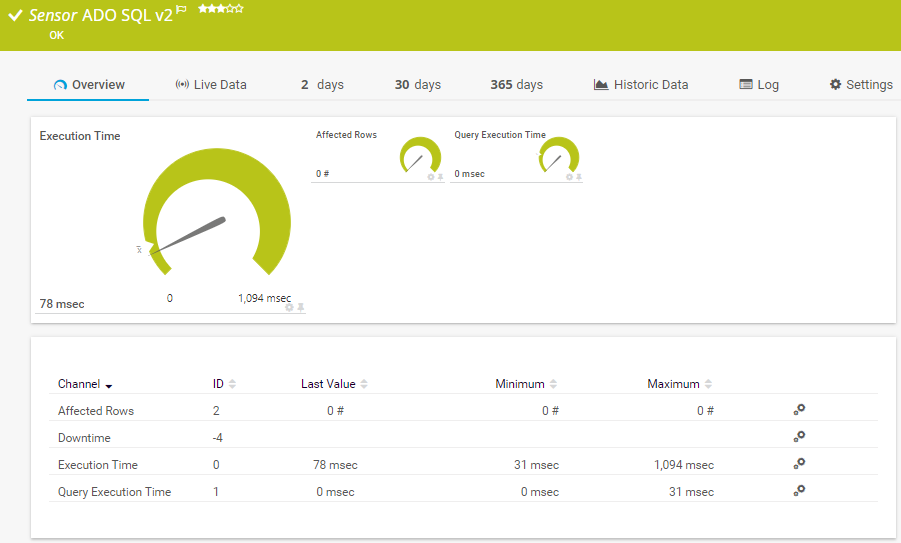
The ADO SQL v2 sensor monitors a database via an ActiveX Data Objects (ADO) connection and it executes an SQL query. It can show the following:
See the PRTG Manual for a list of all available sensor types.

Real-time notifications mean faster troubleshooting so that you can act before more serious issues occur.
PRTG is set up in a matter of minutes and can be used on a wide variety of mobile devices.


“Excellent tool for detailed monitoring. Alarms and notifications work greatly. Equipment addition is straight forward and server initial setup is very easy. ...feel safe to purchase it if you intend to monitor a large networking landscape.”
Partnering with innovative IT vendors, Paessler unleashes synergies to create
new and additional benefits for joined customers.
IT that works constitutes a business-critical basis for a company's success. Availability and security must be defined for the respective purpose and closely monitored – by OT and IT alike.
Integrating monitoring results from PRTG into NetBrain maps makes the foundation for network automation.
With ScriptRunner Paessler integrates a powerful event automation platform into PRTG Network Monitor.
Custom alerts and data visualization let you quickly identify and prevent performance issues such as slow response times or hardware overloads.
Network Monitoring Software – Version 26.1.116.1532 (February 9th, 2026)
Download for Windows and cloud-based version PRTG Hosted Monitor available
English, German, Spanish, French, Portuguese, Dutch, Russian, Japanese, and Simplified Chinese
Network devices, bandwidth, servers, applications, virtual environments, remote systems, IoT, and more
Choose the PRTG Network Monitor subscription that's best for you


With database performance monitoring, the performance of a specific database is measured in real time. The performance of both the software and hardware of database servers is considered. The goal is to identify problems and find ways to quickly improve performance. Database performance monitoring should always be part of an effective database management strategy.
If the performance of your databases drops even a little, each and every process in your company can suffer. In today’s world, the effectiveness of business processes depends on quick and reliable databases. Optimized databases make for faster applications. In many instances, you can greatly increase the speed of your applications simply by optimizing your databases.
PRTG can monitor databases directly from the user’s perspective. To do so, it sends queries to the database server and measures the time required for each individual step. You can also configure PRTG to monitor the return value and define your own threshold values for the latter.
If one of these thresholds is exceeded, you’ll be informed immediately by email, SMS, or push notification.
Key metrics include CPU usage, memory usage, disk I/O, query execution times, transaction throughput, error rates, and concurrency.
PRTG provides real-time alerts and notifications through various channels, including email, SMS, and push notifications.
Yes, PRTG allows you to set up custom alerts and notifications based on specific performance thresholds and conditions.
In PRTG, “sensors” are the basic monitoring elements. One sensor usually monitors one measured value in your network, for example the traffic of a switch port, the CPU load of a server, or the free space on a disk drive. On average, you need about 5-10 sensors per device or one sensor per switch port.
Paessler conducted trials in over 600 IT departments worldwide to tune its network monitoring software closer to the needs of sysadmins. The result of the survey: over 95% of the participants would recommend PRTG – or already have.

Paessler PRTG is used by companies of all sizes. Sysadmins love PRTG because it makes their job a whole lot easier.
Bandwidth, servers, virtual environments, websites, VoIP services – PRTG keeps an eye on your entire network.
Everyone has different monitoring needs. That’s why we let you try PRTG for free.