
- English
- Deutsch
- Español
- Français
- Italiano
- Português
Monitoring business processes means more than checking if a server is up. It means knowing whether the services your operations depend on are actually functioning, end to end, across every component, protocol, and location they rely on. A single component going green tells you nothing about whether the service itself is healthy.
Paessler PRTG combines sensors from across your infrastructure into a single aggregated service-level monitor, up to 50 channels per Business Process sensor. Instead of tracking server health, network status, and application availability separately, you define a service. Whether its remote access, a web application, or an ERP system, and PRTG watches every component it relies on. One combined status in real time. When something degrades, you see exactly which part is affected.
PRTG monitors services built on: web servers, VPN gateways, RDP/RDS environments, Active Directory, SQL databases, cloud endpoints (HTTP/HTTPS), SNMP-enabled network devices, WMI-monitored Windows systems, and external HTTP/HTTPS endpoints.
Supported protocols and methods: SNMP, WMI, HTTP/HTTPS, ICMP ping, RDP, REST API.

Individual components show green, but the service is not responding. By the time a ticket arrives, the disruption has already started, and your business operations are paying for it.
PRTG gives you service-level visibility. Define which components make up a service, set warning and error thresholds that reflect your operational KPIs (key performance indicators), and PRTG continuously monitors combined process health. When any part degrades past your threshold, an alert fires, enabling corrective action before the impact reaches your users. Before customer satisfaction takes the hit.
Modern services span many components. When one falls silent, you're cross-referencing dashboards to identify bottlenecks and possible causes, while users are already affected and process efficiency drops.
PRTG pulls everything into one structured service view. Sensors from different devices, protocols, and locations feed into a single model. External HTTP/HTTPS endpoints, a third-party API, a payment provider, are included too. You define the service once. PRTG watches the full chain, giving you the performance data you need to streamline troubleshooting across every dependency. That data supports data-driven decision making about where inefficiencies actually sit.

Scheduled reports, always on time
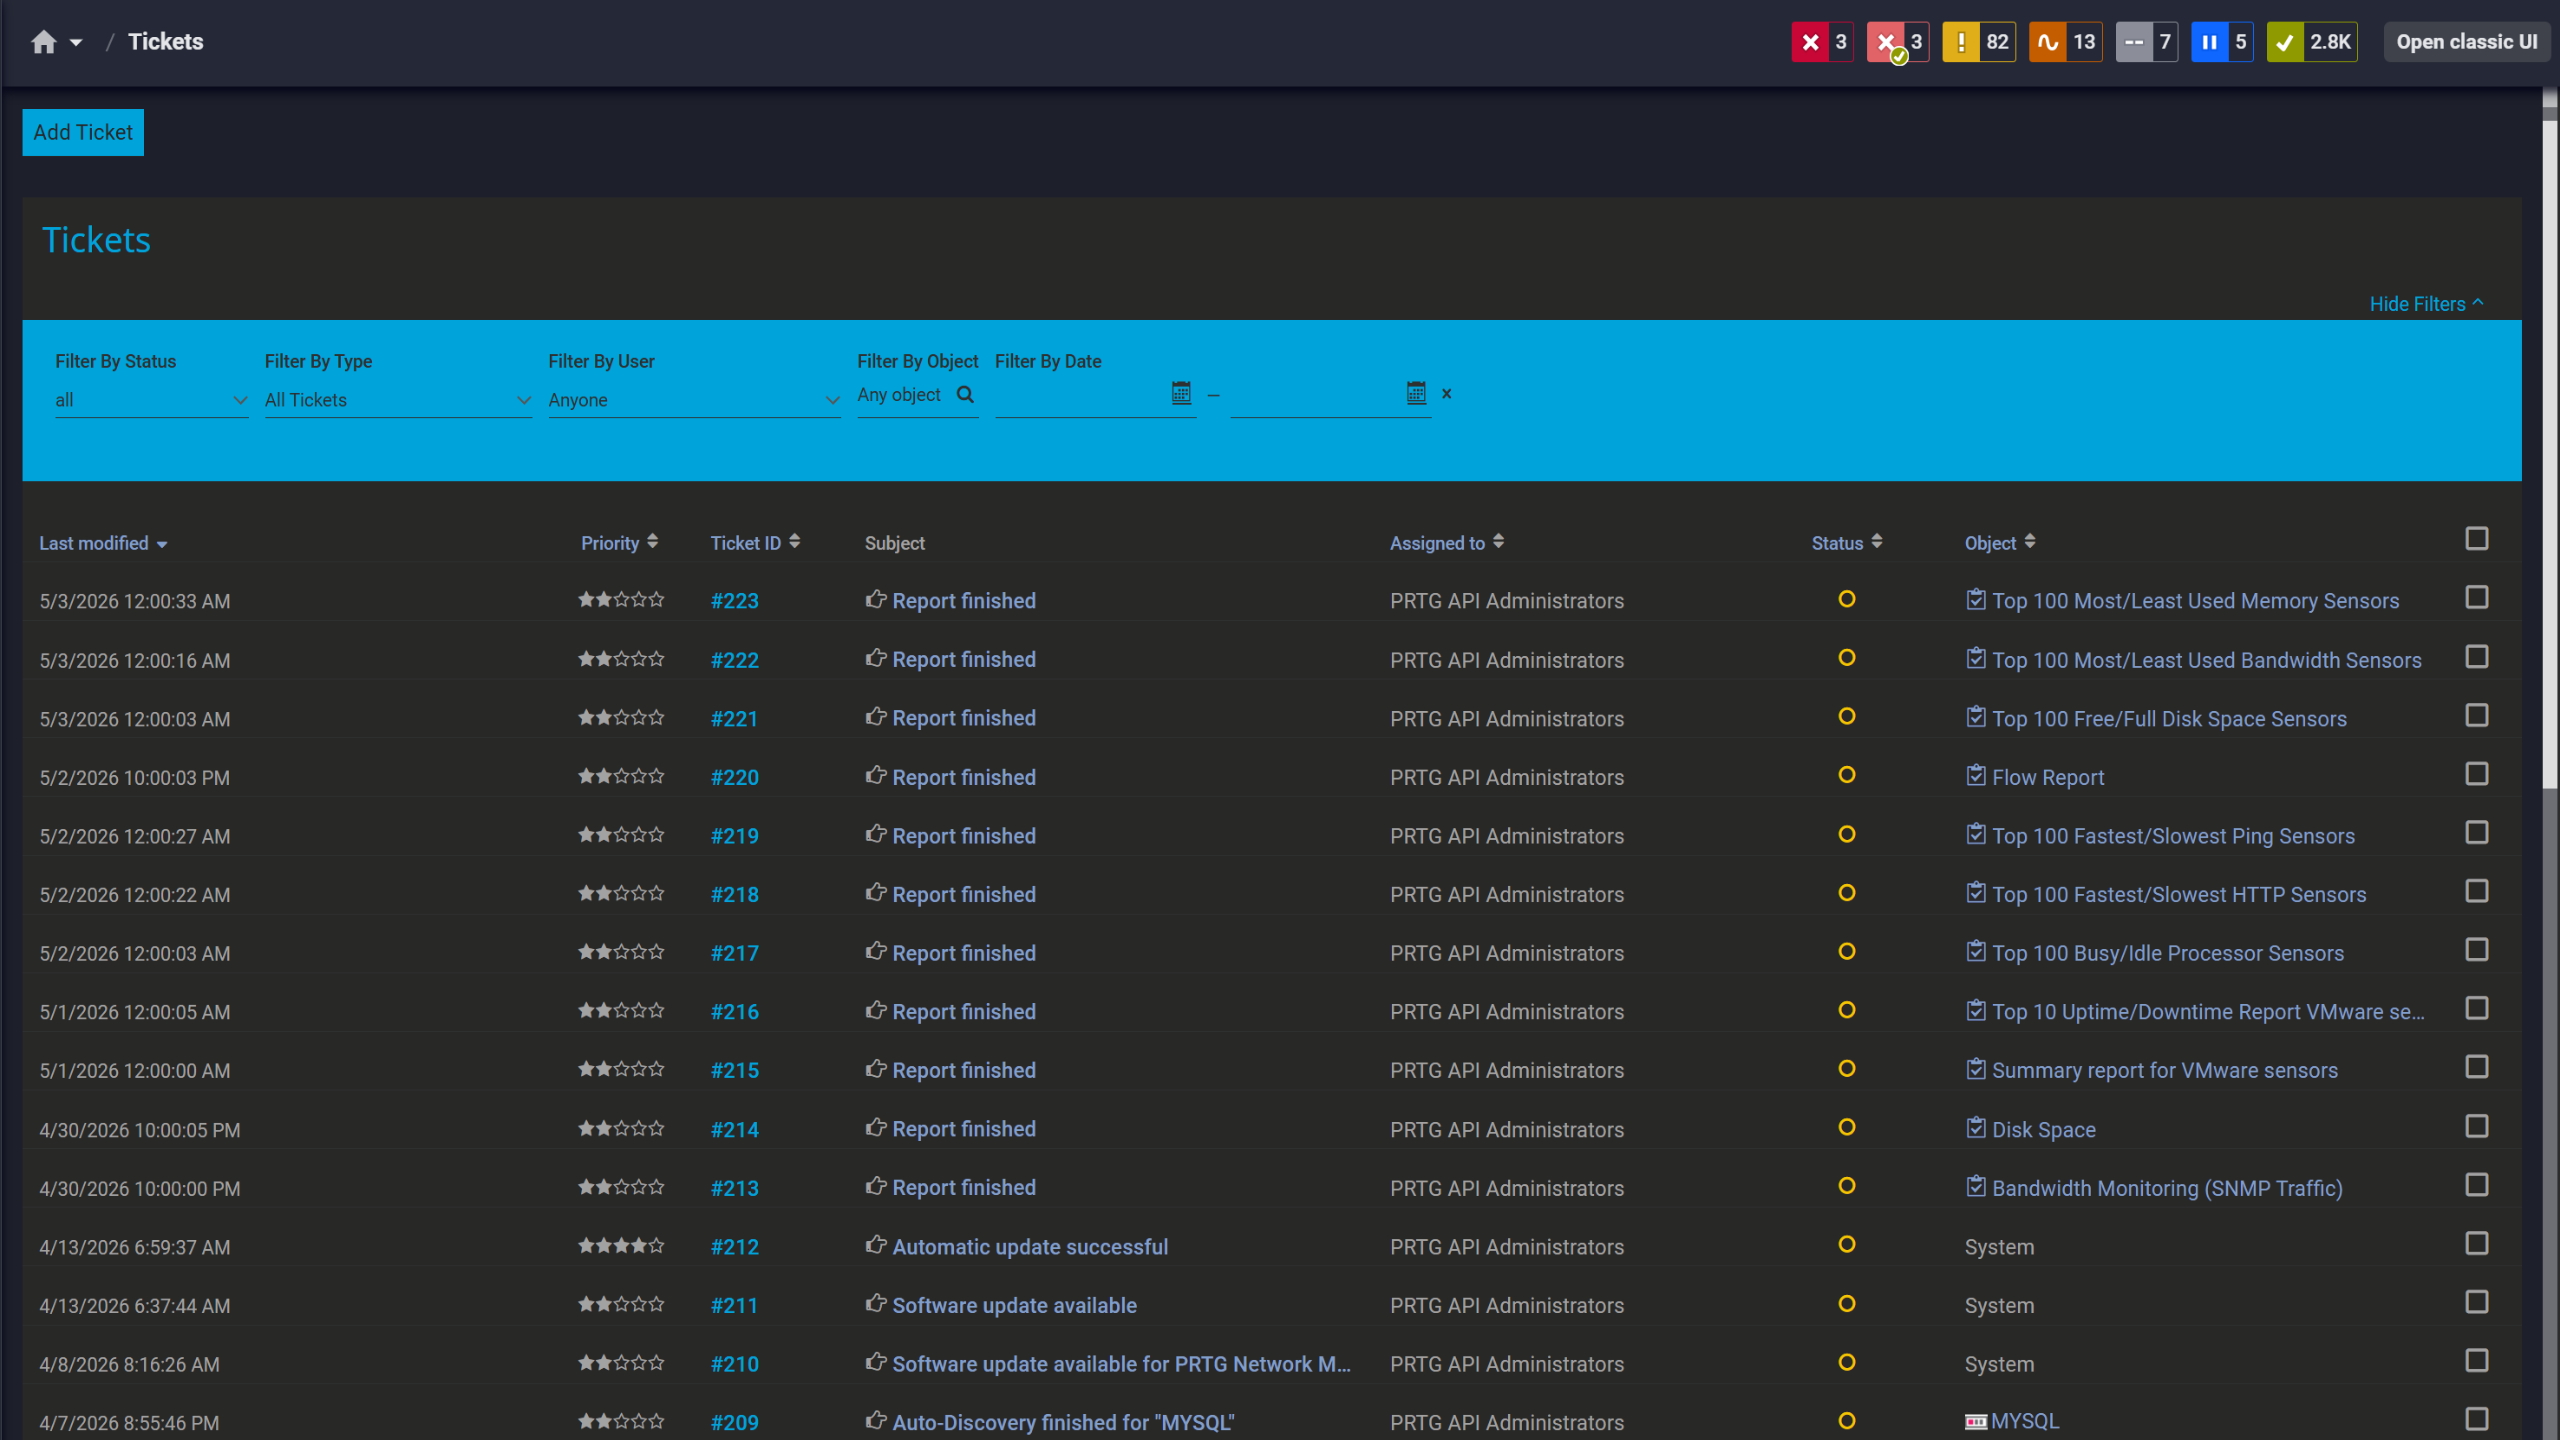
Tickets keep your team aligned

Live graphs, real-time performance data
Start monitoring your infrastructure in minutes. No professional services, no complex configuration, no risk.
Engineers need sensor-level detail. Managers need process health at a glance. A single shared dashboard serves neither, and manual reporting produces performance data that's outdated before it's read.
PRTG's map editor lets you build role-specific dashboards from the same live monitoring data. Engineers get full sensor detail and performance metrics. Managers get color-coded service health, visualization that supports informed decisions, risk management, and operational excellence across business goals. No duplication. No manual updates.
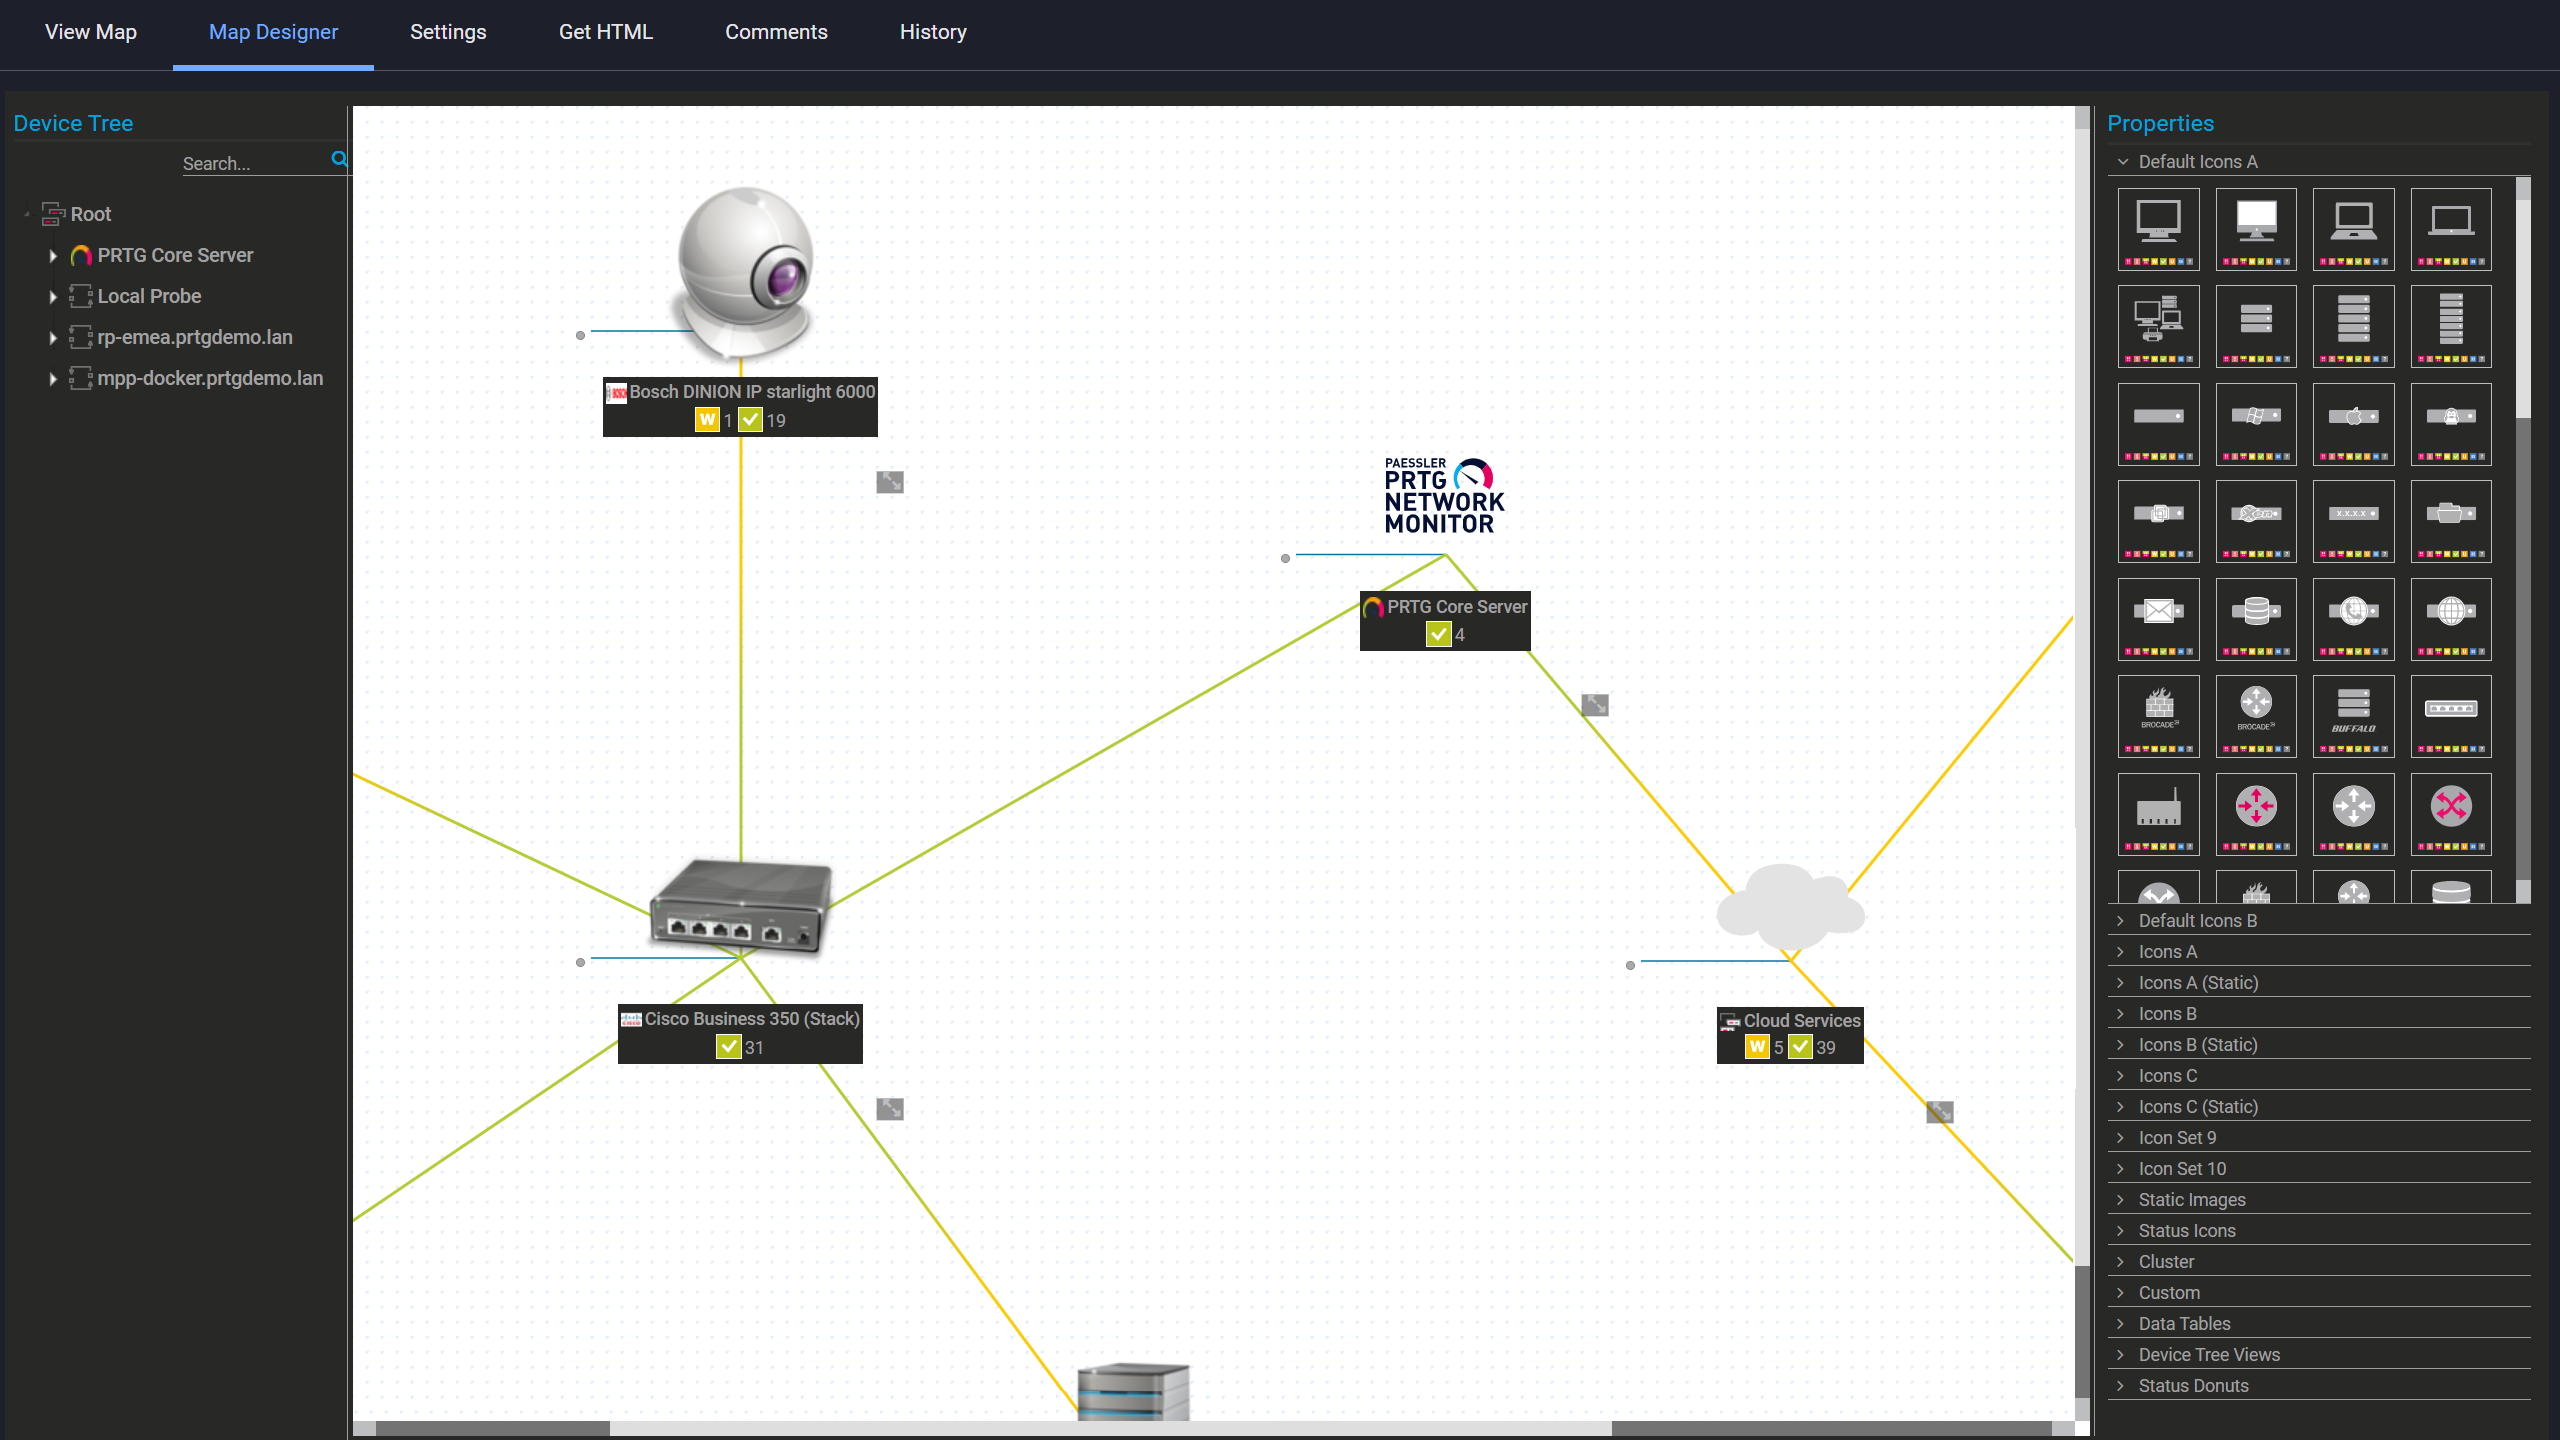
Custom maps with live status
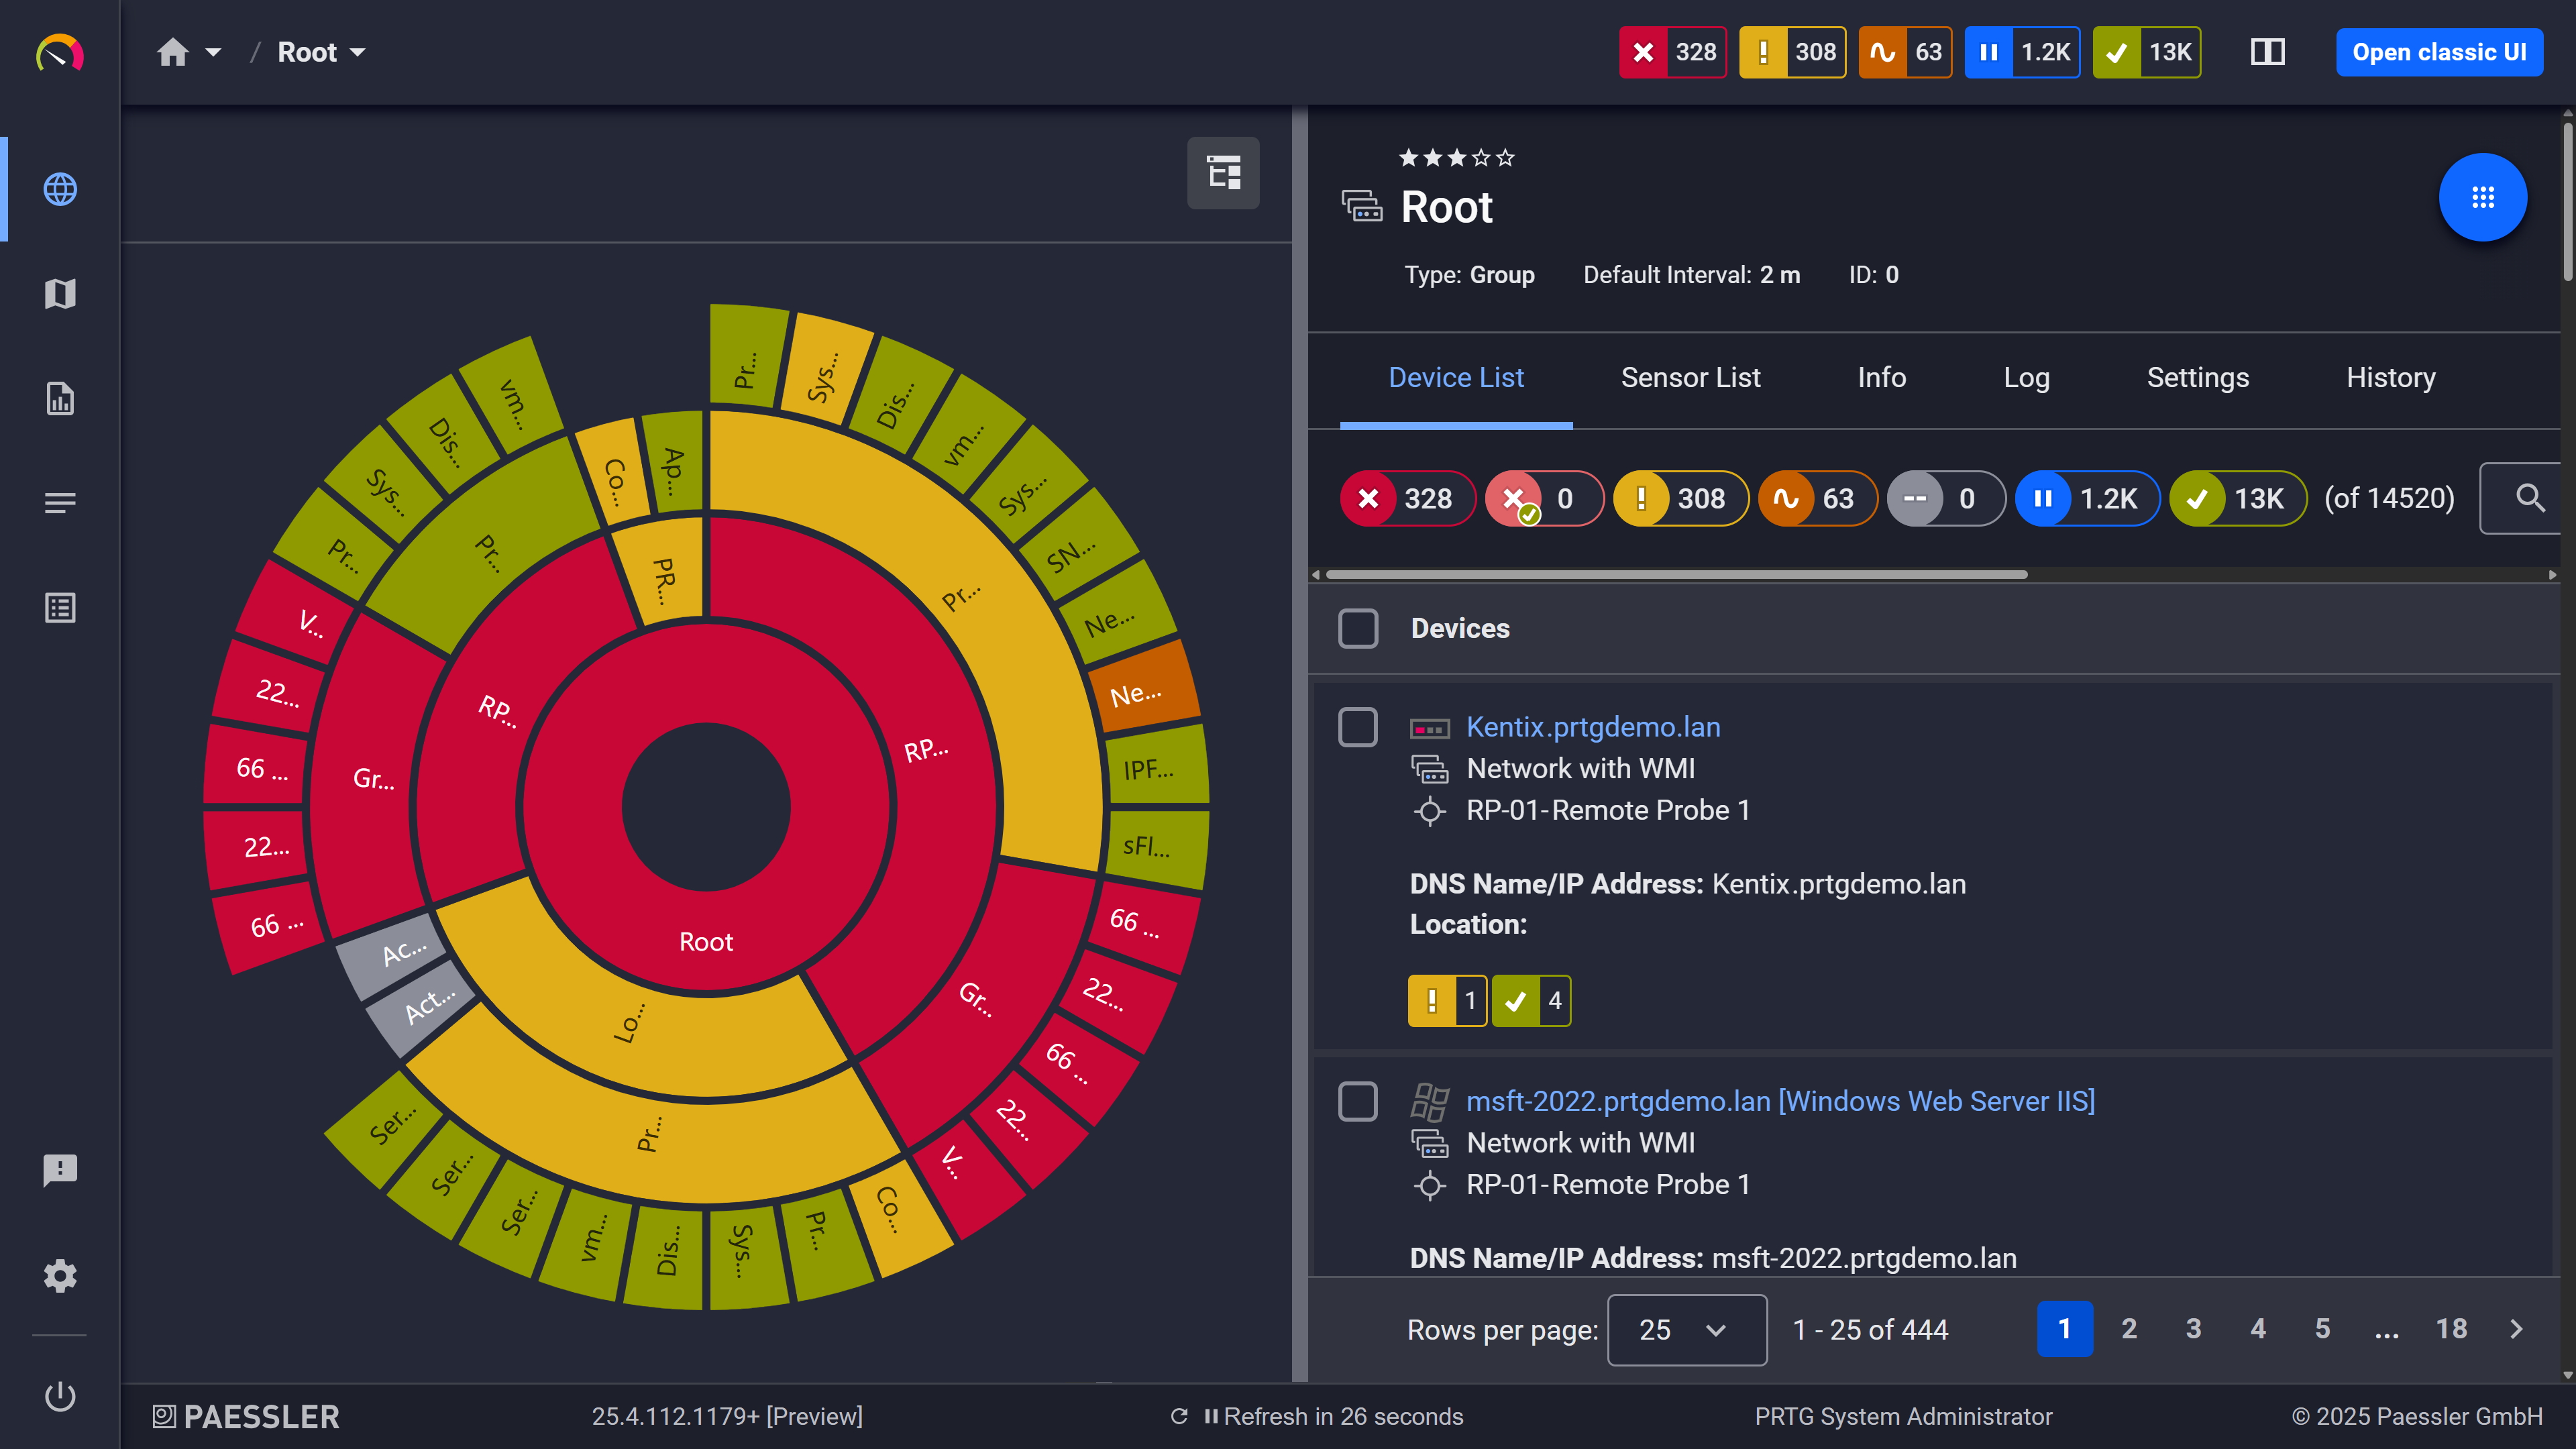
Your entire network, visualized instantly
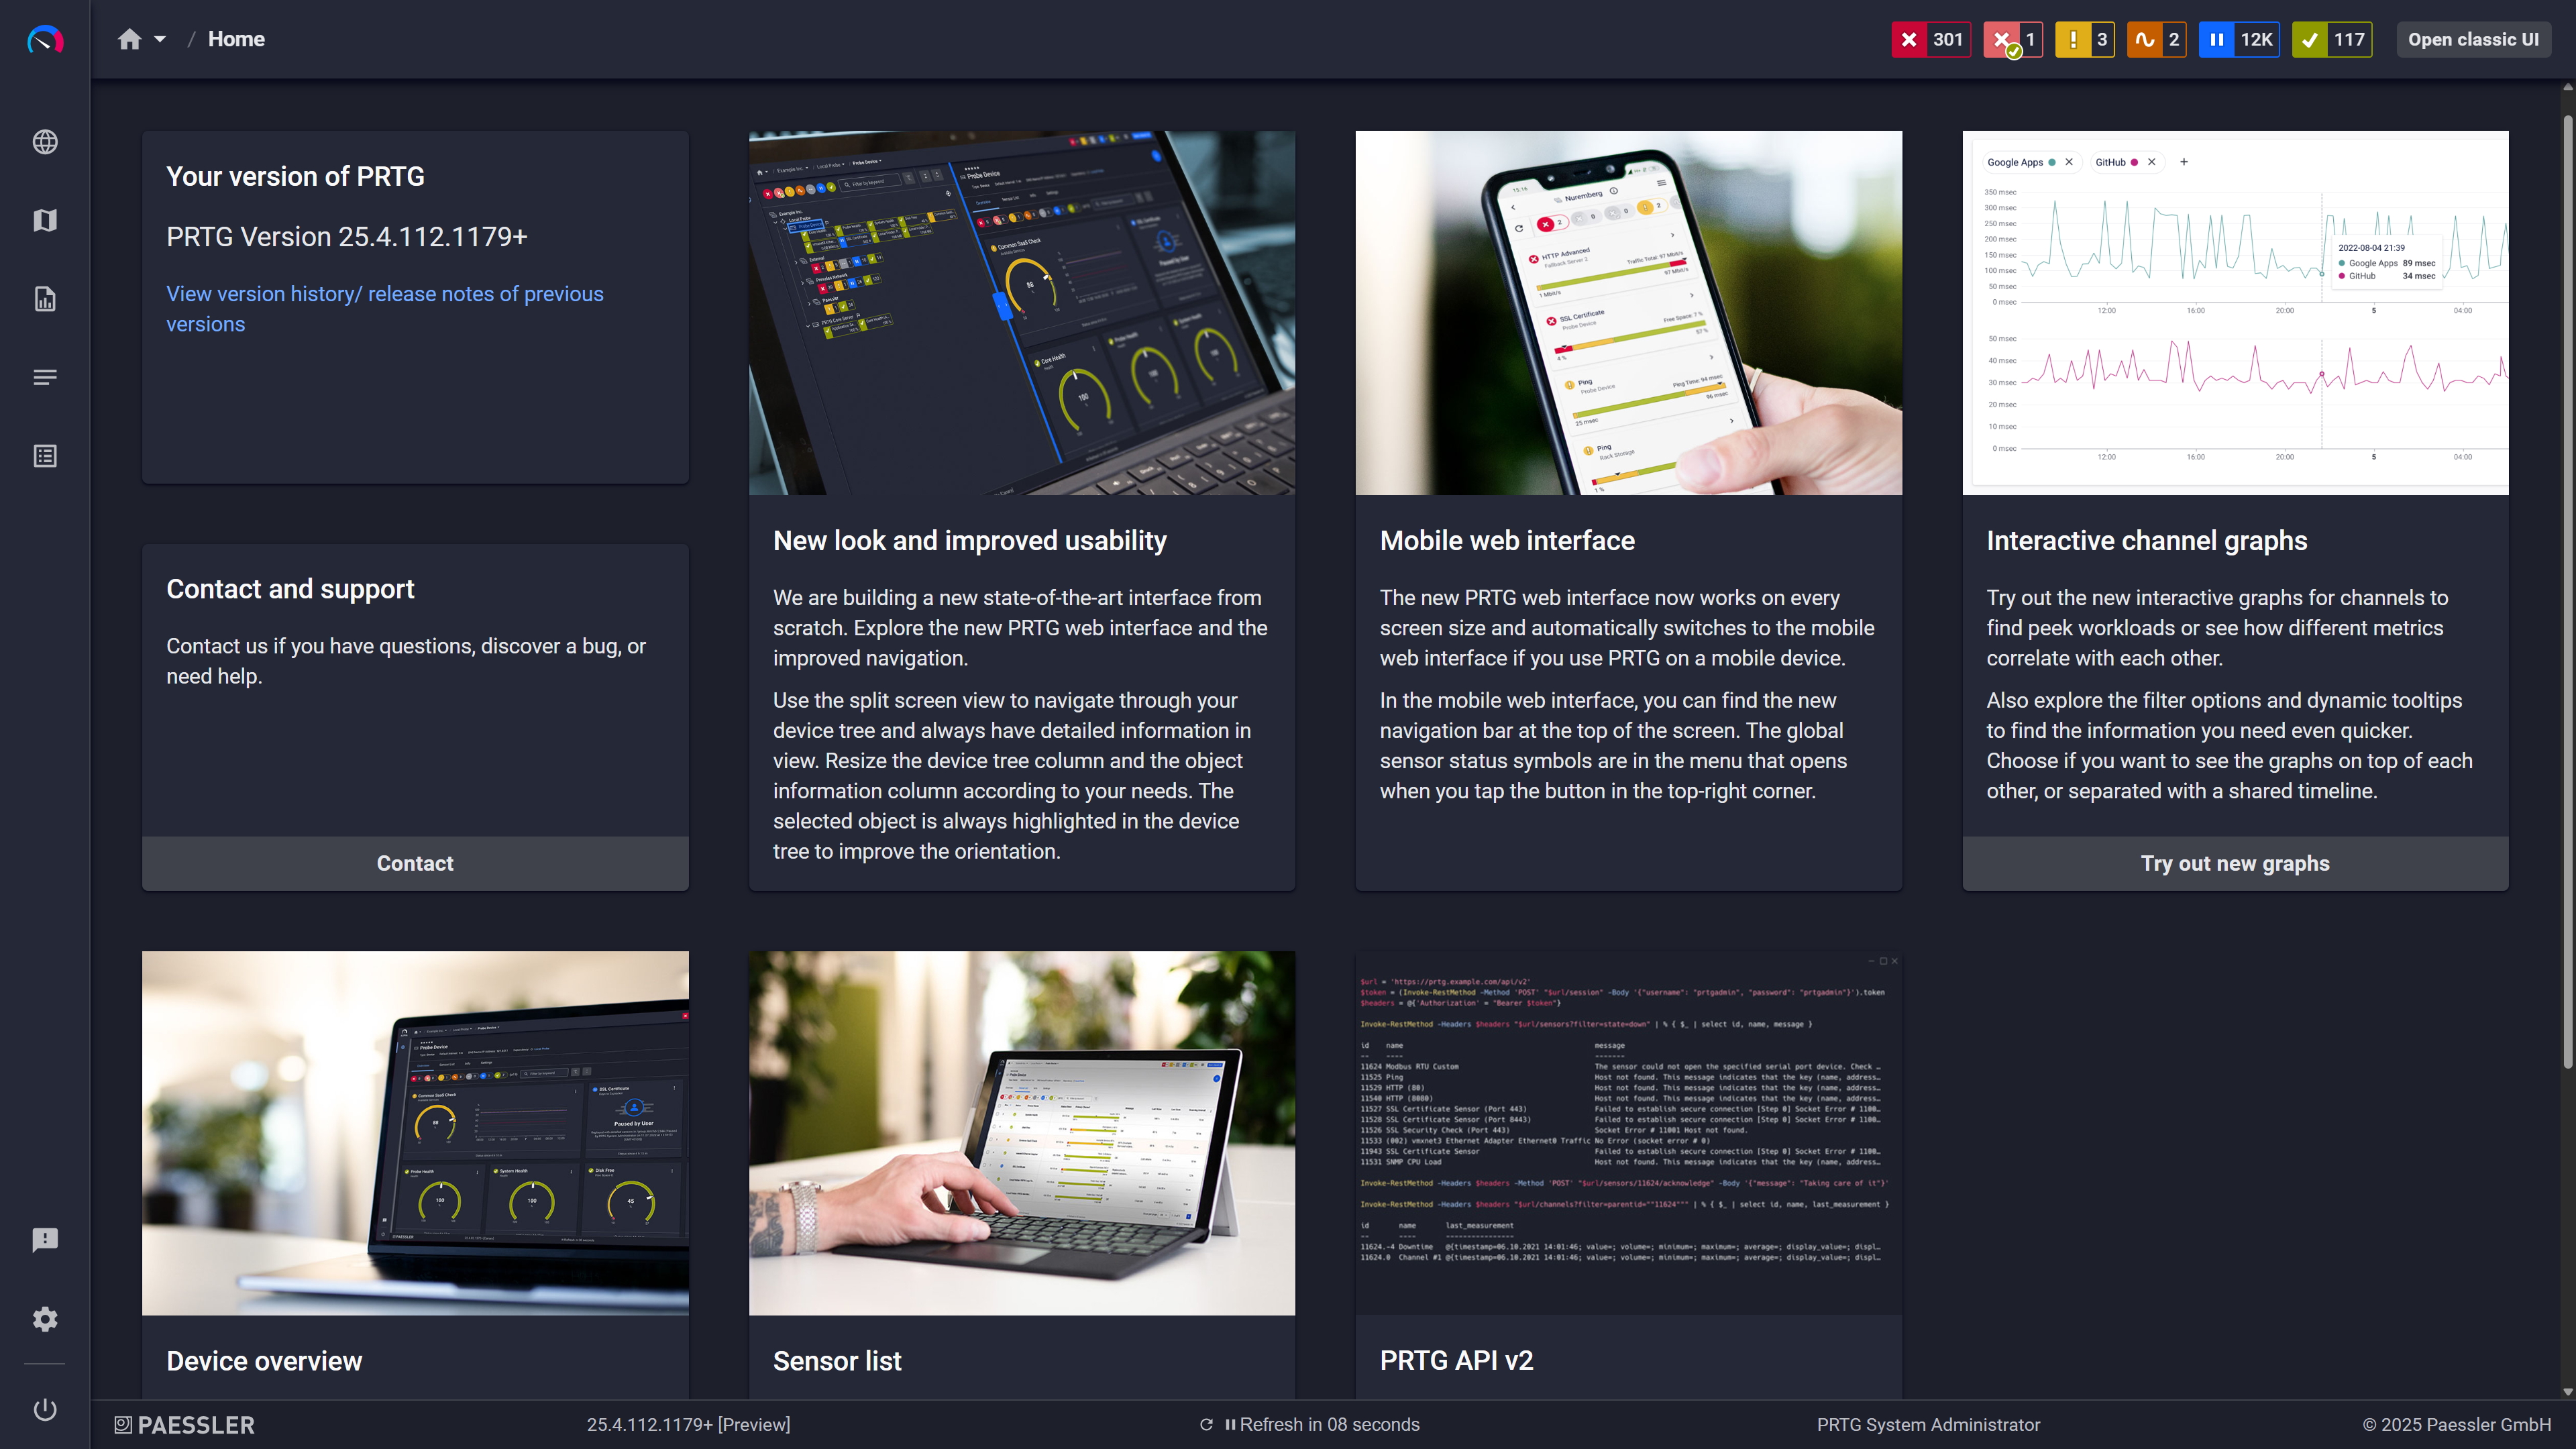
Modern interface, everything within reach
Branch teams often find out about problems the same way end users do: when something stops working. Delayed detection, inefficiencies in troubleshooting, resource utilization stretched thin across sites that aren't properly monitored.
PRTG's remote probes runs local network scanning on-site. Monitoring traffic stays within the local network. The probe connects to the PRTG core server, on-premises or via PRTG Hosted Monitor, for centralized management, data storage, and alerting. Deploying a remote probe per site costs less than running a separate monitoring tool for each location, and everything is managed from the same central PRTG core. That's where the cost savings come from: consolidation, not complexity.
PRTG uses a sensor-based approach to data collection. Individual sensors gather performance data from devices, services, and endpoints, the core functions your business relies on. The Business Process sensor and Sensor Factory sensor aggregate that data into service-level views, with multiple channels per service reflecting the health of each component group.
Task | Without PRTG Without PRTG | With PRTG With PRTG |
|---|---|---|
Service health visibility | Without PRTG Check each component separately to assess overall service health | With PRTG Single service-level sensor shows aggregated status across all monitored dependencies in real time |
Issue detection | Without PRTG Users report the problem before IT knows it exists | With PRTG Threshold-based alerting fires when a service condition degrades, enabling corrective action before full failure |
Status reporting | Without PRTG Manual status updates prepared for management | With PRTG Shareable dashboards update automatically with live monitoring data |
Cause Analysis | Without PRTG Cause investigation requires cross-referencing multiple tools. A slow and inefficient task | With PRTG See which service component group is degraded and navigate directly to the relevant sensors in PRTG |
Remote/branch site monitoring | Without PRTG No monitoring at remote/branch sites without a company-wide rollout | With PRTG Streamline monitoring across distributed sites with a remote probe: fast to deploy, no central IT reconfiguration |
Choose the PRTG Network Monitor subscription that's best for you.
| License Name | License description | Price | License Details | Get started | Pricing Details | |
|---|---|---|---|---|---|---|
| PRTG 500 | $200 | per month paid annually | Buy nowBuy now | Enough to monitor multiple aspects of 50 devices | ||
| PRTG 1000 | $358 | per month paid annually | Buy nowBuy now | Enough to monitor multiple aspects of 100 devices | ||
| PRTG 2500 | $742 | per month paid annually | Buy nowBuy now | Enough to monitor multiple aspects of 250 devices | ||
| PRTG 5000 | $1,300 | per month paid annually | Buy nowBuy now | Enough to monitor multiple aspects of 500 devices | ||
| PRTG 10000 | $1,642 | per month paid annually | Buy nowBuy now | Enough to monitor multiple aspects of 1000 devices |

The Business Process sensor creates a single sensor reflecting the combined process health of multiple components. Select source sensors, group them into channels, and set warning and error thresholds based on what percentage of source sensors are degraded. PRTG maps each sensor's status to a business process condition, up or down. The Global State channel always shows the most severe status across all channels. One sensor. Clear service health. Full component detail underneath.
PRTG evaluates the affected channel against your defined thresholds. If the percentage of sensors in a down condition exceeds your error threshold, the channel’s state changes to down, which propagates to the Global State channel. Your configured notifications fire immediately. Individual source sensors remain accessible, so you can navigate directly to the failing component, investigate, and take corrective action from there.
Yes. The Business Process sensor pulls from existing source sensors regardless of where the underlying component is hosted. An on-premises VPN server, a cloud-hosted endpoint monitored via HTTP, and a local database can all be part of the same service model. This works whether you're running a stable on-premises environment or hybrid infrastructure during a digital transformation period. The sensor works with whatever the source sensors are measuring.
Both aggregate performance data from source sensors into a combined service view. The Business Process sensor uses percentage-based thresholds: define what share of source sensors in a channel must be down to trigger a warning or error. The Sensor Factory sensor uses formulas: write a channel expression using sensor IDs and define the exact condition that changes the sensor's status.
Start with the Business Process sensor for straightforward service aggregation. Use the Sensor Factory sensor when you need conditional logic, for example, "alert only if two specific high-priority components are both down simultaneously."
Not natively. PRTG doesn't have built-in integrations with specific ITSM platforms. When an alert fires, PRTG can trigger an HTTP action, a webhook call to an external URL. Most ITSM tools accept incoming webhooks and can create incidents automatically from them. Setup requires configuring a webhook receiver on the ITSM side and an HTTP notification action in PRTG with the correct endpoint and payload. It works reliably, but requires configuration on both ends.
If sensors are already running for the components you want to group, typical for existing PRTG users, setting up a Business Process sensor takes minutes. PRTG also includes device templates for common infrastructure components, which speeds up the initial data collection setup if you're starting from scratch. Select source sensors, define channels, set thresholds. Done.
The planning takes longer: deciding which components belong to which service, what thresholds make sense, and how alerting should behave. More complex Sensor Factory configurations take longer than a straightforward Business Process sensor setup. Either way, the performance data from day one supports process improvement decisions, in how you define service models and how quickly you respond when they surface an issue. This is a good way to implement continuous improvement.
Network Monitoring Software – Version 26.3.124.1727 (September 16, 2026)
Download for Windows and cloud-based version PRTG Hosted Monitor available
English, German, Spanish, French, Portuguese, Dutch, Russian, Japanese, and Simplified Chinese
Network devices, bandwidth, servers, applications, virtual environments, remote systems, IoT, and more
Choose the PRTG Network Monitor subscription that's best for you



