• Company
    • About Us
    • Case Studies
    • Press Center
    • Careers
    • Blog
    • Contact us
  • Contact us
  • Login
 
  • English
    • Deutsch
    • Español
    • Français
    • Italiano
    • Português
Paessler
                    - The Monitoring Experts
  • Products
    • Paessler PRTG
      Paessler PRTGMonitor your whole IT infrastructure
      • PRTG Network Monitor
      • PRTG Enterprise Monitor
      • PRTG Hosted Monitor
      • PRTG UVexplorer
      • PRTG extensionsExtensions for Paessler PRTGExtend your monitoring to a new level
    • Icon Features
      FeaturesExplore all monitoring features
      • Maps & dashboards
      • Alerts & notifications
      • Multiple user interfaces
      • Distributed monitoring
      • Customizable reporting
  • Solutions
    • Industries
      IndustriesMonitor various industry sectors
      • Industrial
      • Healthcare
      • Data Center
      • Education
      • Finance
      • Government
    • IT Topics
      IT TopicsMonitor all areas of IT
      • Network Monitoring
      • Bandwidth Monitoring
      • SNMP Monitor
      • Network Mapping
      • WiFi Monitoring
      • Server Monitoring
  • Pricing
  • Resources
    • Getting Started
      Getting StartedModules for self-paced learning
    • How-to Guides
      How-to GuidesGet the most out of PRTG
    • Videos & Webinars
      Videos & WebinarsLearn from Paessler experts
    • IT  Knowledge
      IT KnowledgeExpand your IT knowledge
    • PRTG Manual
      PRTG ManualFull documentation
    • Knowledge Base
      Knowledge BaseShare community knowledge
    • PRTG Sensor Hub
      PRTG Sensor HubGet sensors, scripts & templates
    • Trainings
      PRTG TrainingLearn how to work with PRTG
  • Partners
    • Icon Handshake
      Become a PartnerFor resellers and channel partners
    • Icon MSP
      Become an MSPDeliver monitoring as a managed service
    • icon partner
      Partner PortalLog in to your partner account
    • Deal Registration
      Deal RegistrationRegister your sales opportunities
    • icon search
      Find a PartnerFind partners selling Paessler products
    • icon technology
      Technology AlliancesSee Paessler technology partnerships
    • Partner HubTools for Your Success
  • Company
    • About Us
    • Case Studies
    • Press Center
    • Careers
    • Blog
    • Contact us
  • Contact us
  • Login
  • English
    • Deutsch
    • Español
    • Français
    • Italiano
    • Português
  • Get a quote
  • Free trial

Query-Level PostgreSQL Monitoring

Track query performance, replication health, and relational database metrics in real time without complex setup

Free download
PRODUCT OVERVIEW

How do you monitor PostgreSQL query performance and database health without building custom tooling?

PostgreSQL exposes a lot of useful performance data through its system views, but getting that data into a monitoring workflow that runs continuously, alerts on thresholds, and keeps history takes work to build from scratch. Most teams end up with a mix of manual psql queries, cron jobs, and dashboards that cover some of it but not all of it at once.

PRTG uses the PostgreSQL sensor to execute the SQL queries you write against your database on a schedule you define. Query results map to dedicated monitoring channels with individual thresholds, historical graphs, and alert routing through your existing notification setup. Beyond custom queries, PRTG also tracks checkpoint activity, WAL file generation, autovacuum data, and buffer cache hit ratios out of the box. Supported environments: PostgreSQL 7.x and later, Amazon RDS PostgreSQL, Azure Database for PostgreSQL, and self-managed Postgres servers on Linux and Windows.

Download PRTG Trial

What you will find on this page

  • PostgreSQL Visibility
  • How PRTG Monitors PostgreSQL
  • Manual ProstgreSQL vs. PRTG
  • FAQs

PRTG is compatible with all major vendors, products, and systems

compatible with all major vendors, products, and systems

PostgreSQL Visibility From Query Level to Infrastructure

Query Performance Tracking at the Right Level

Slow queries kill application performance. When your Postgres database starts lagging and you don't have query-level visibility, you're troubleshooting blind: hunting through PostgreSQL logs while users are already reporting slow response times, with no fast way to know which query is actually the problem. 

Write custom SQL queries pulling from pg_stat_statements, pg_stat_activity, or pg_stat_database, and PRTG takes it from there. Runs them on whatever schedule you set.

You decide which metrics matter: execution time, number of rows returned, buffer reads, custom performance indicators. When query execution crosses your thresholds you get notified before users start complaining, which is the whole point.

  • Execute custom SQL queries tailored to your Postgres environment
  • Track query execution time, rows affected, and full request execution time including connection overhead in dedicated channels
  • Set individual alert thresholds per query type and performance level
  • Pull from pg_stat_statements to identify slow or resource-intensive queries
  • Visualize query performance trends over time to catch degradation before it becomes a user complaint
PRTG web interface showing live performance graphs for a Probe Health sensor

Live graphs, real-time performance data

PRTG SNMP Disk Free sensor showing free space, free bytes, and total disk capacity gauges

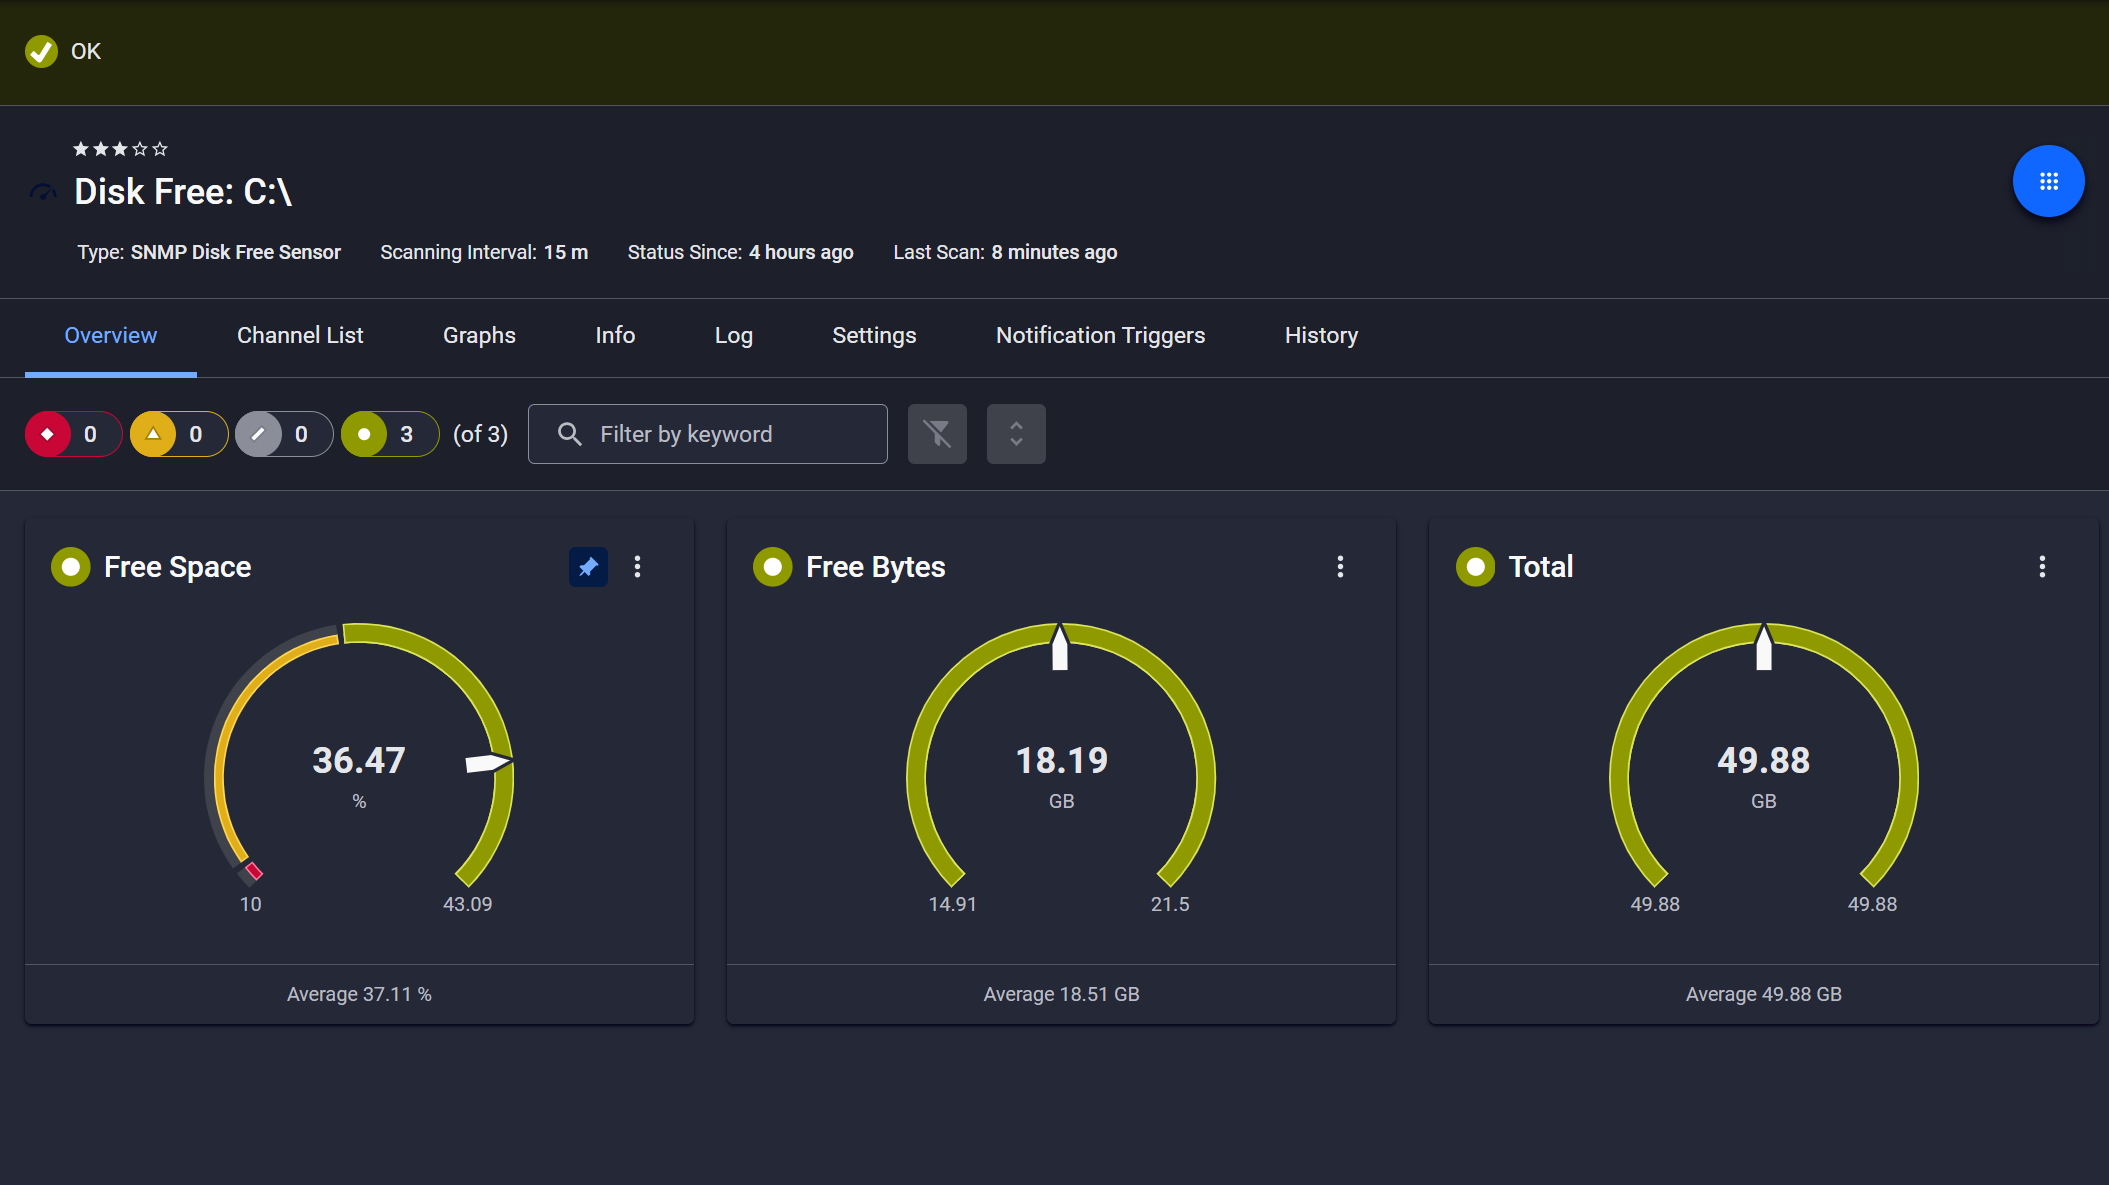
Disk space monitored, alerts ready

PRTG device view showing sensor list for a monitored Microsoft Exchange server

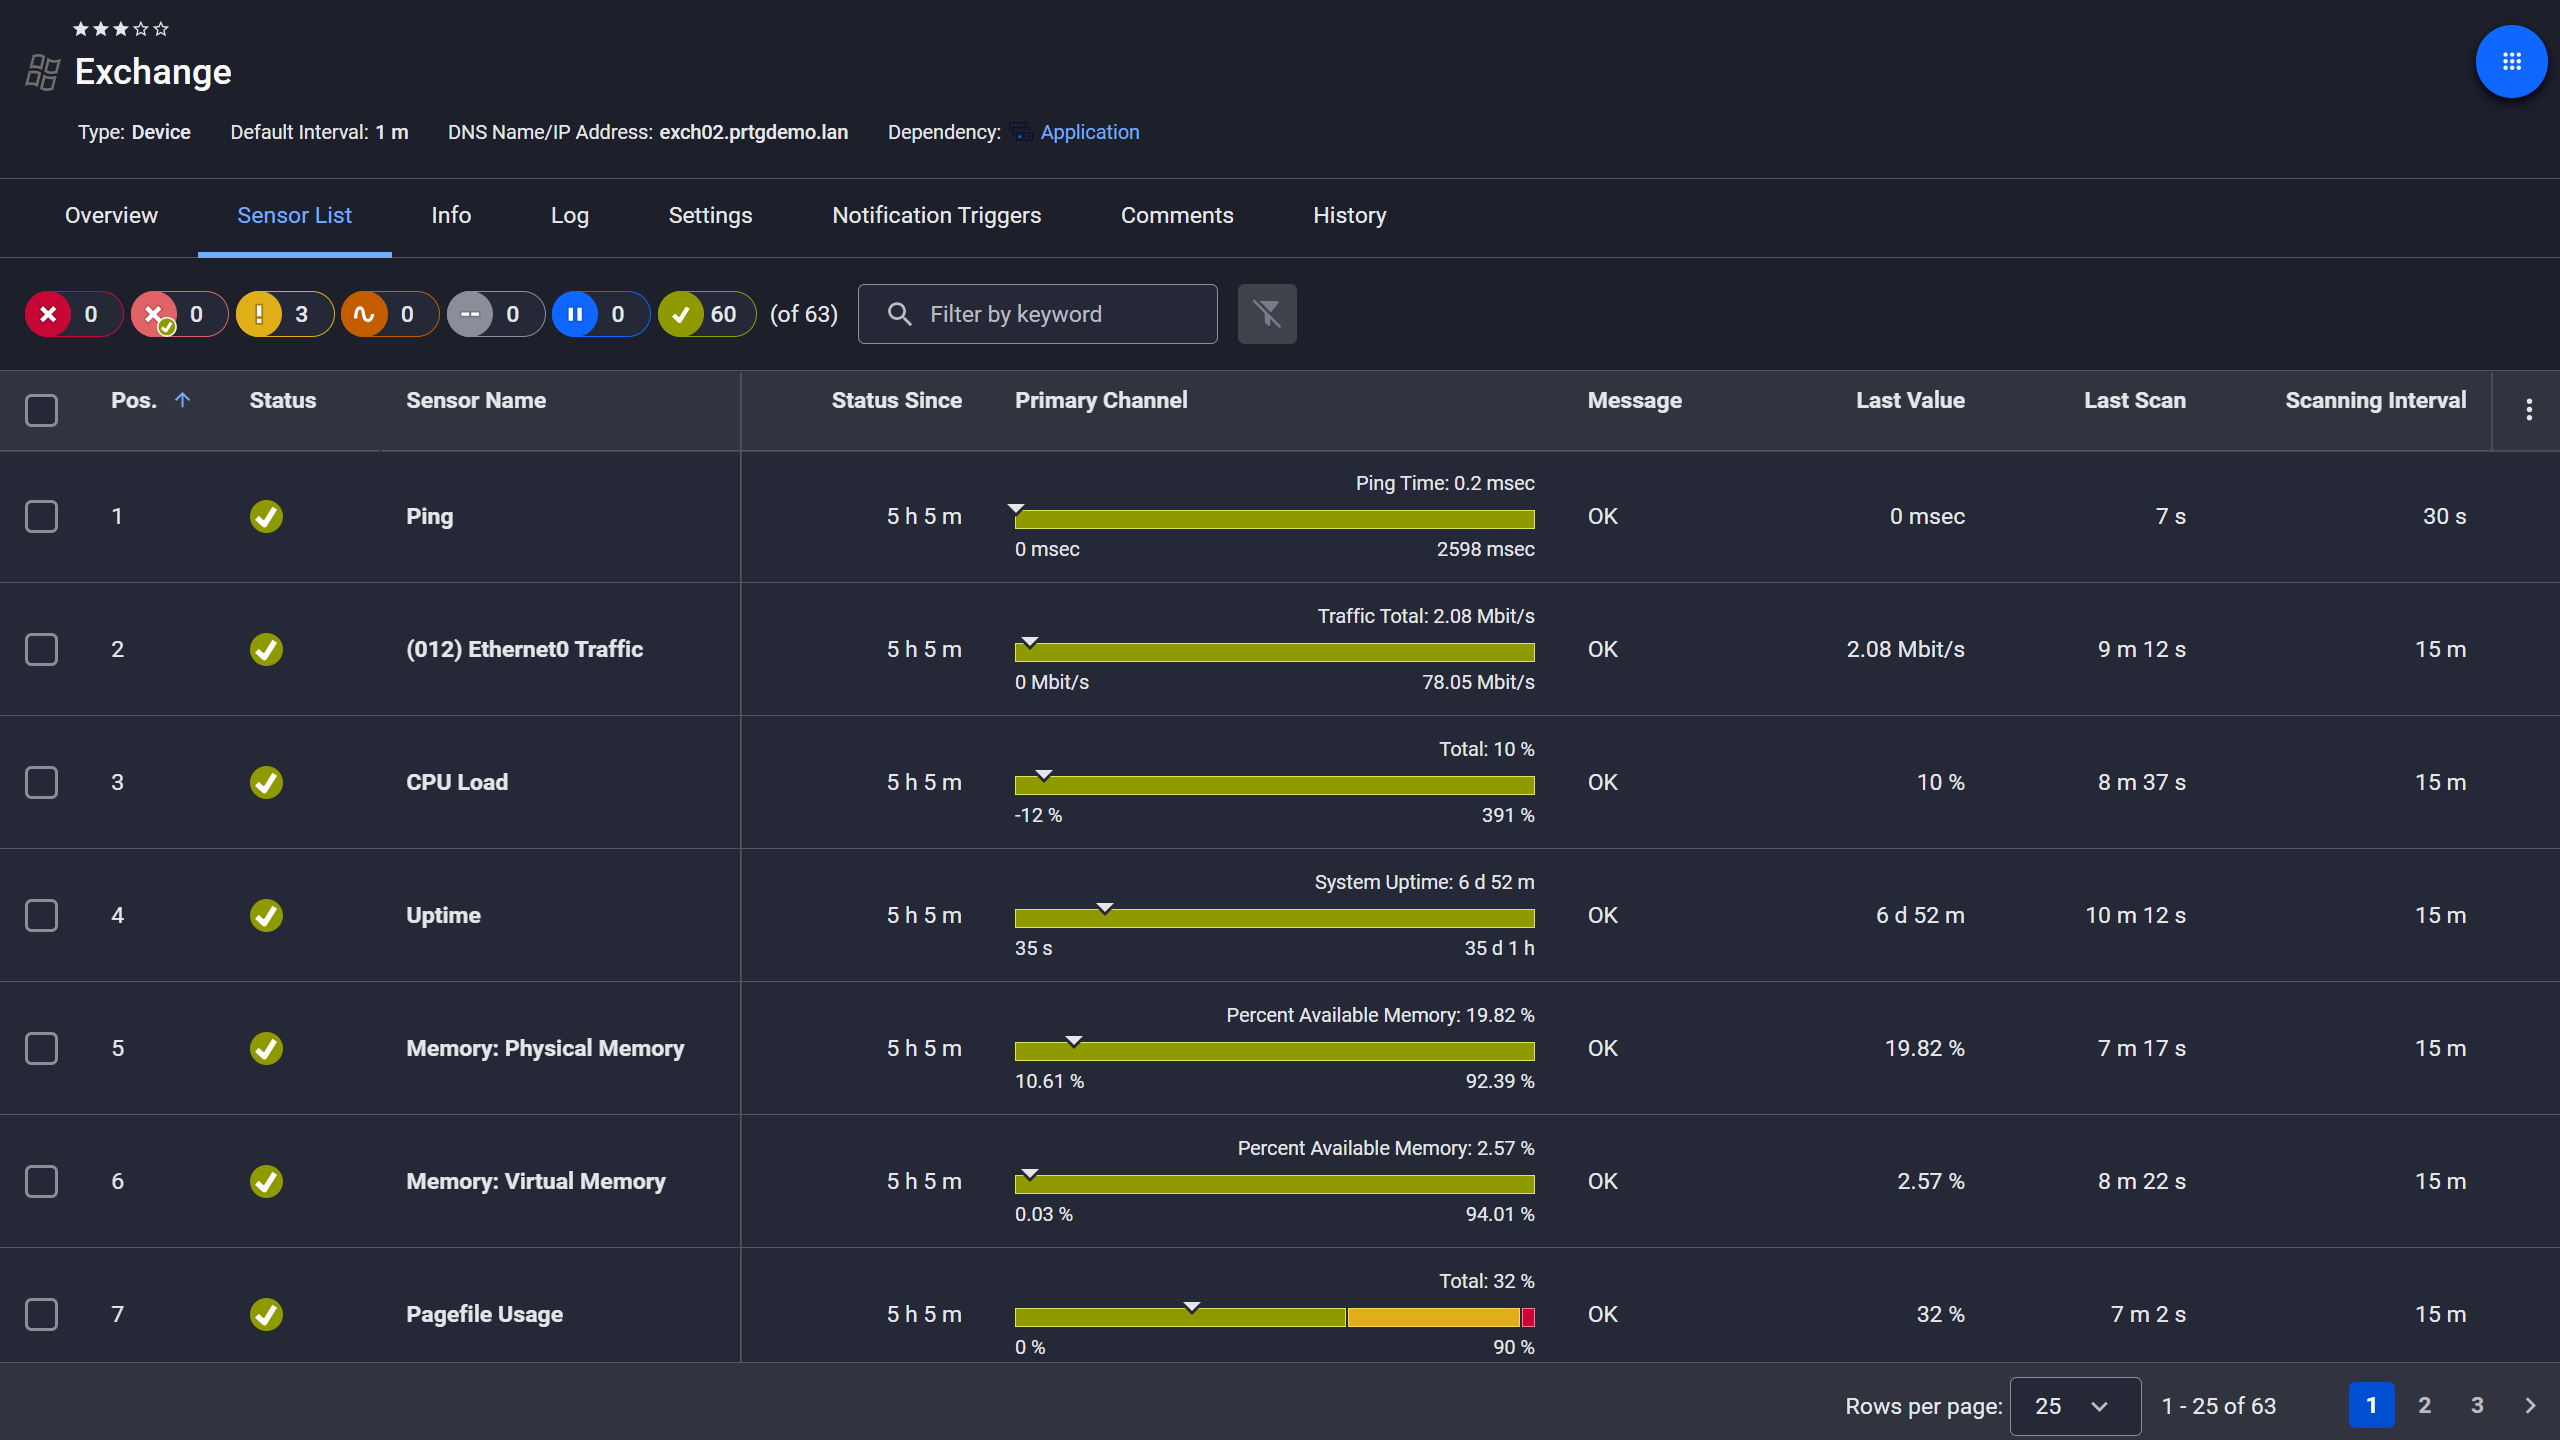
Exchange server, fully under control

Track Replication Health and Standby Status 

A standby server that's quietly falling behind doesn't announce itself. Replication lag builds, WAL shipping stalls, and you find out when failover doesn't work the way you expected. By then it's not a monitoring gap anymore, it's an incident.

When you monitor PostgreSQL with PRTG you can query replication-specific metrics directly: replication lag, standby server status, WAL file counts. Custom SQL queries pull from PostgreSQL system views. You can see exactly how far behind your replicas are running, and also whether your backup systems are actually ready to take over when needed.

  • Query replication lag metrics to ensure standby databases stay synchronized with primary
  • Monitor WAL file generation and shipping status for streaming replication setups
  • Track active connection counts to identify replication bottlenecks
  • Alert on replication delays before they impact recovery point objectives
  • Monitor both physical and logical replication configurations

See Why IT Professionals Trust PRTG

Start monitoring your infrastructure in minutes. No professional services, no complex configuration, no risk.

Free download
PRODUCT OVERVIEW

Monitor Database Resource Utilization 

Generic server monitoring will catch a CPU spike. What it won't tell you is whether that came from a runaway vacuum job, a query doing a full sequential scan, or something in your connection pool. The resource problem is visible. The cause isn't. 

You write SQL queries, including custom functions, against PostgreSQL system catalogs and performance views. PRTG executes them to track resource metrics. Buffer cache hit ratios show memory efficiency. Checkpoint activity and backend processes reveal workload patterns. pg_stat_database gives you transactions committed, blocks read, tuple activity. Database-aware resource monitoring, not just server-level stats, and that distinction matters when you're trying to isolate what's actually driving the issue.

  • Track buffer cache hit ratios to optimize memory allocation and reduce disk I/O
  • Monitor checkpoint frequency and write patterns to prevent I/O storms
  • Query autovacuum activity to confirm table maintenance is running on schedule
  • Measure database size growth for capacity planning
  • Monitor connection pool utilization and spot connection leaks before they compound
PRTG tickets list showing system notifications, report completions, and update alerts

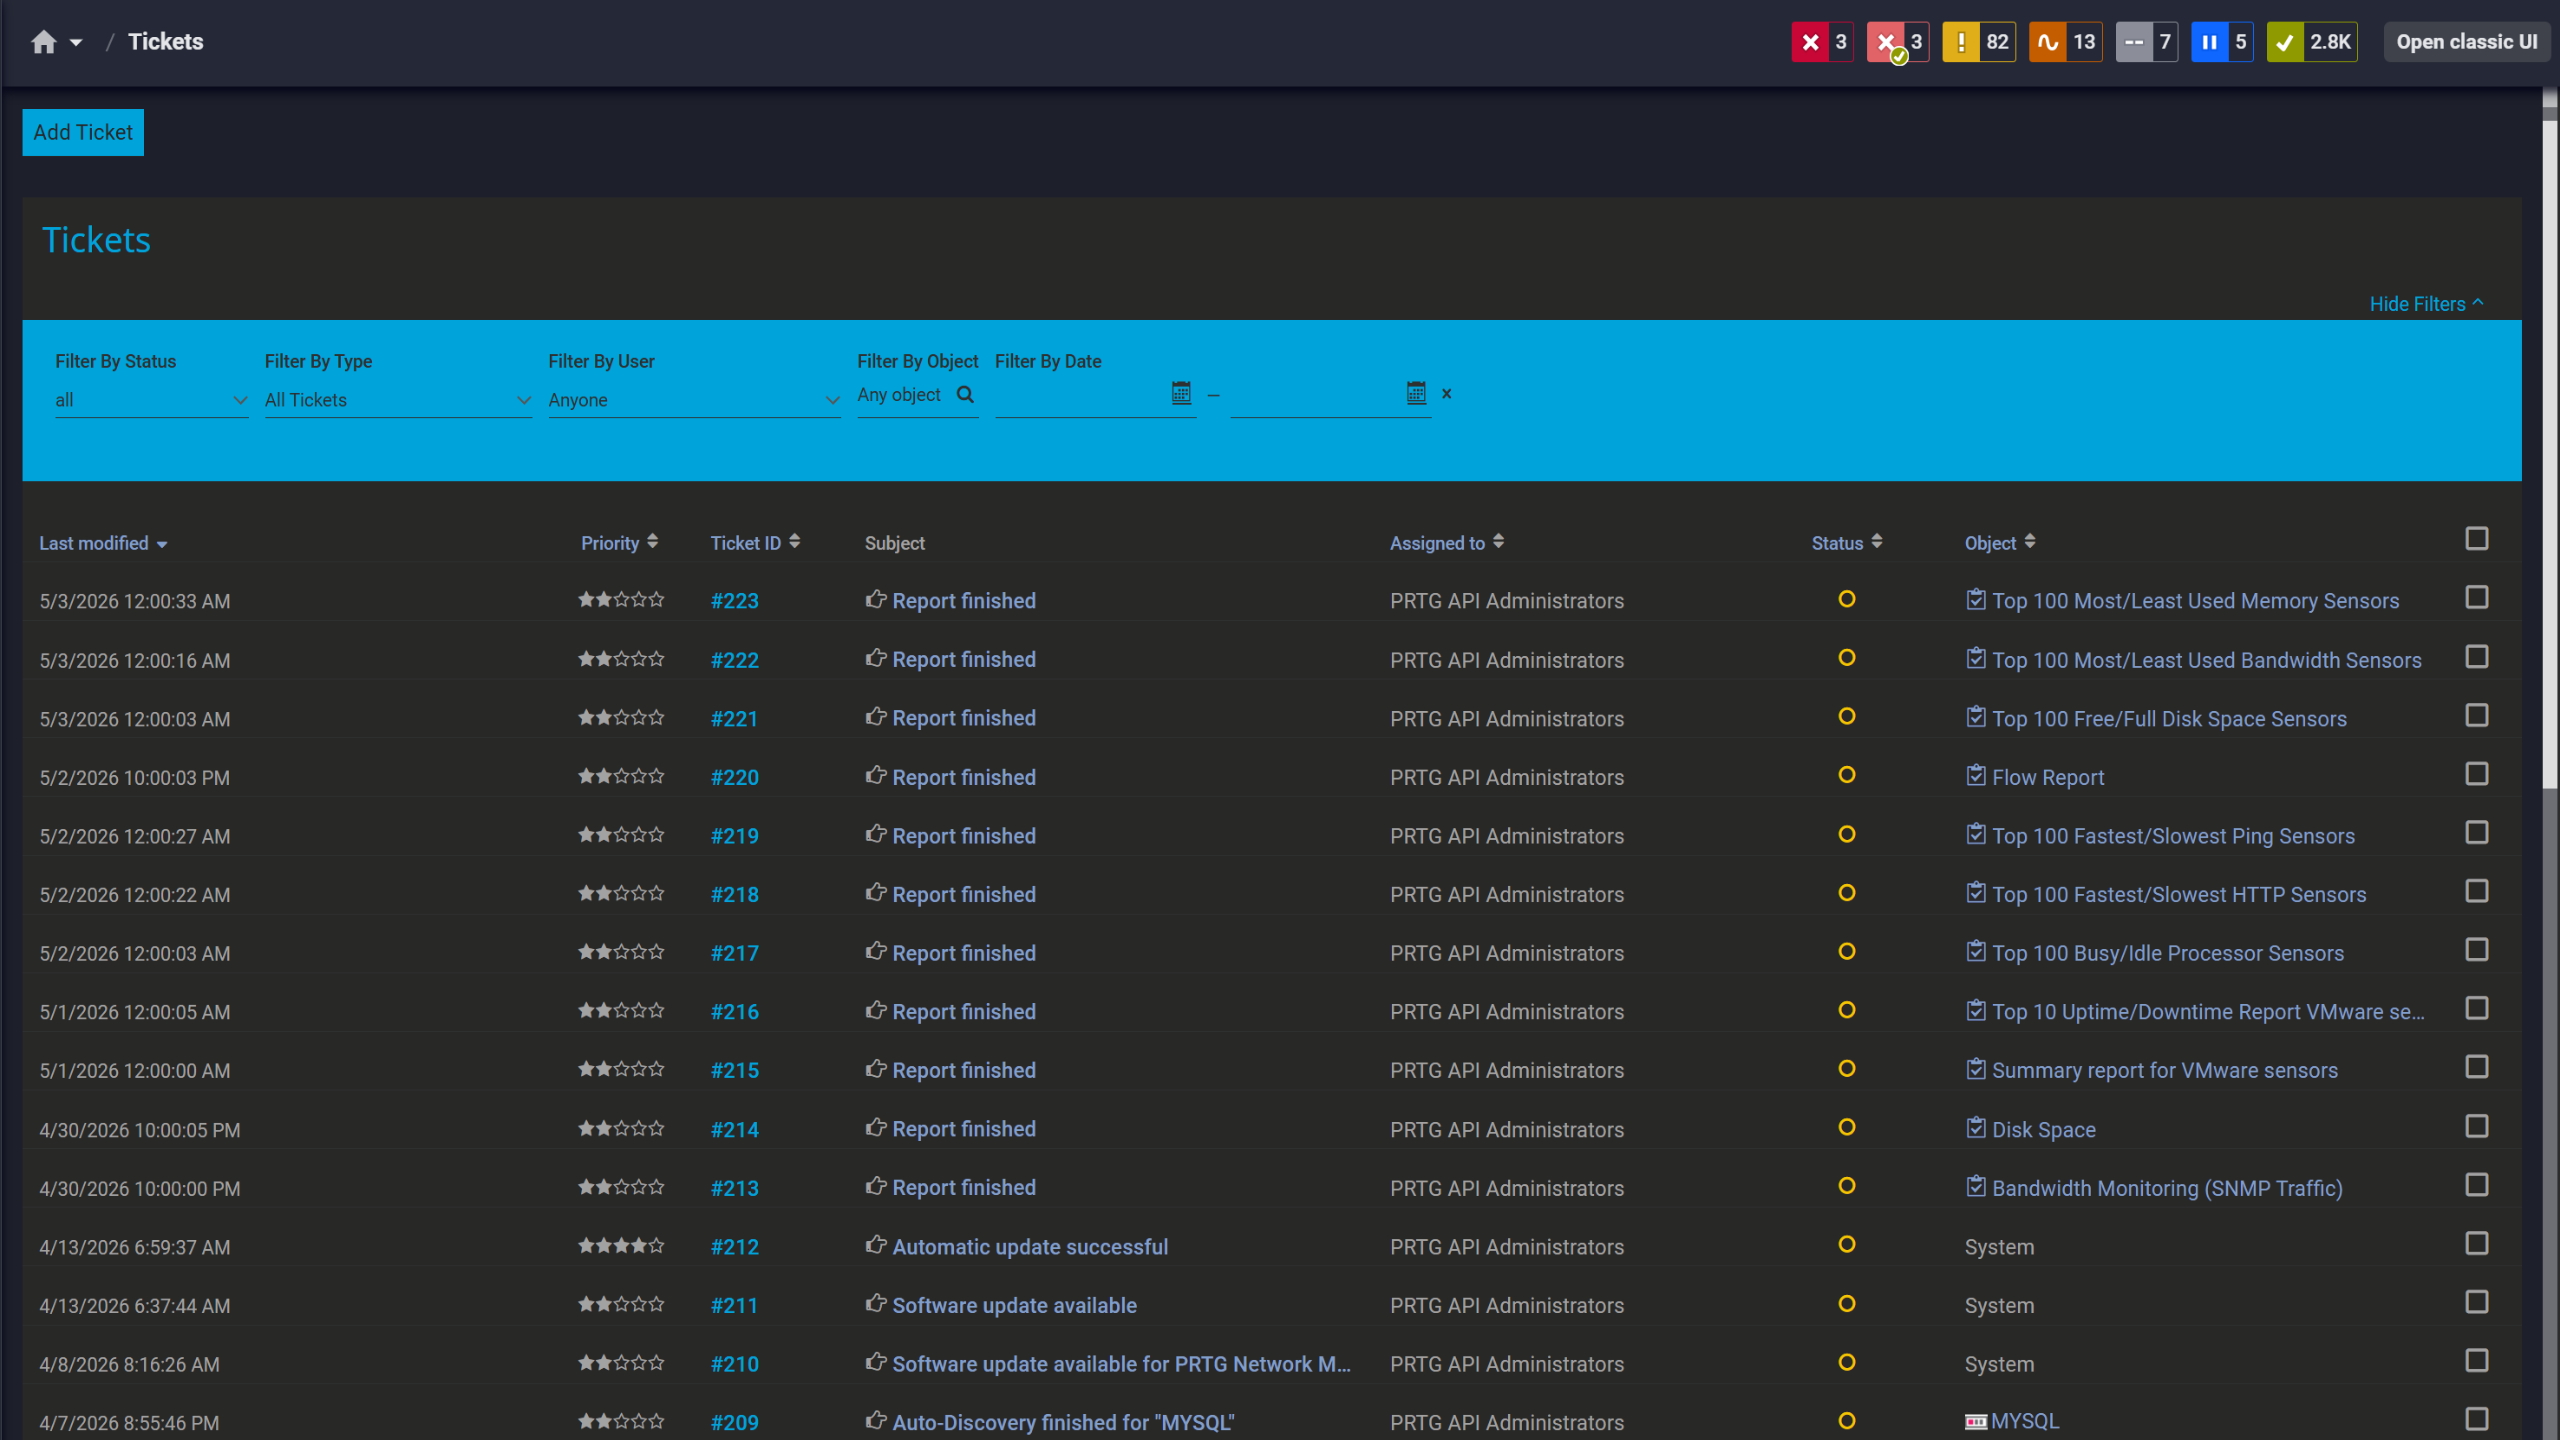
Tickets keep your team aligned

PRTG reports list showing scheduled monitoring reports with run times and sensor counts

Scheduled reports, always on time

PRTG web interface showing Probe Health sensor with health and storage gauge widgets

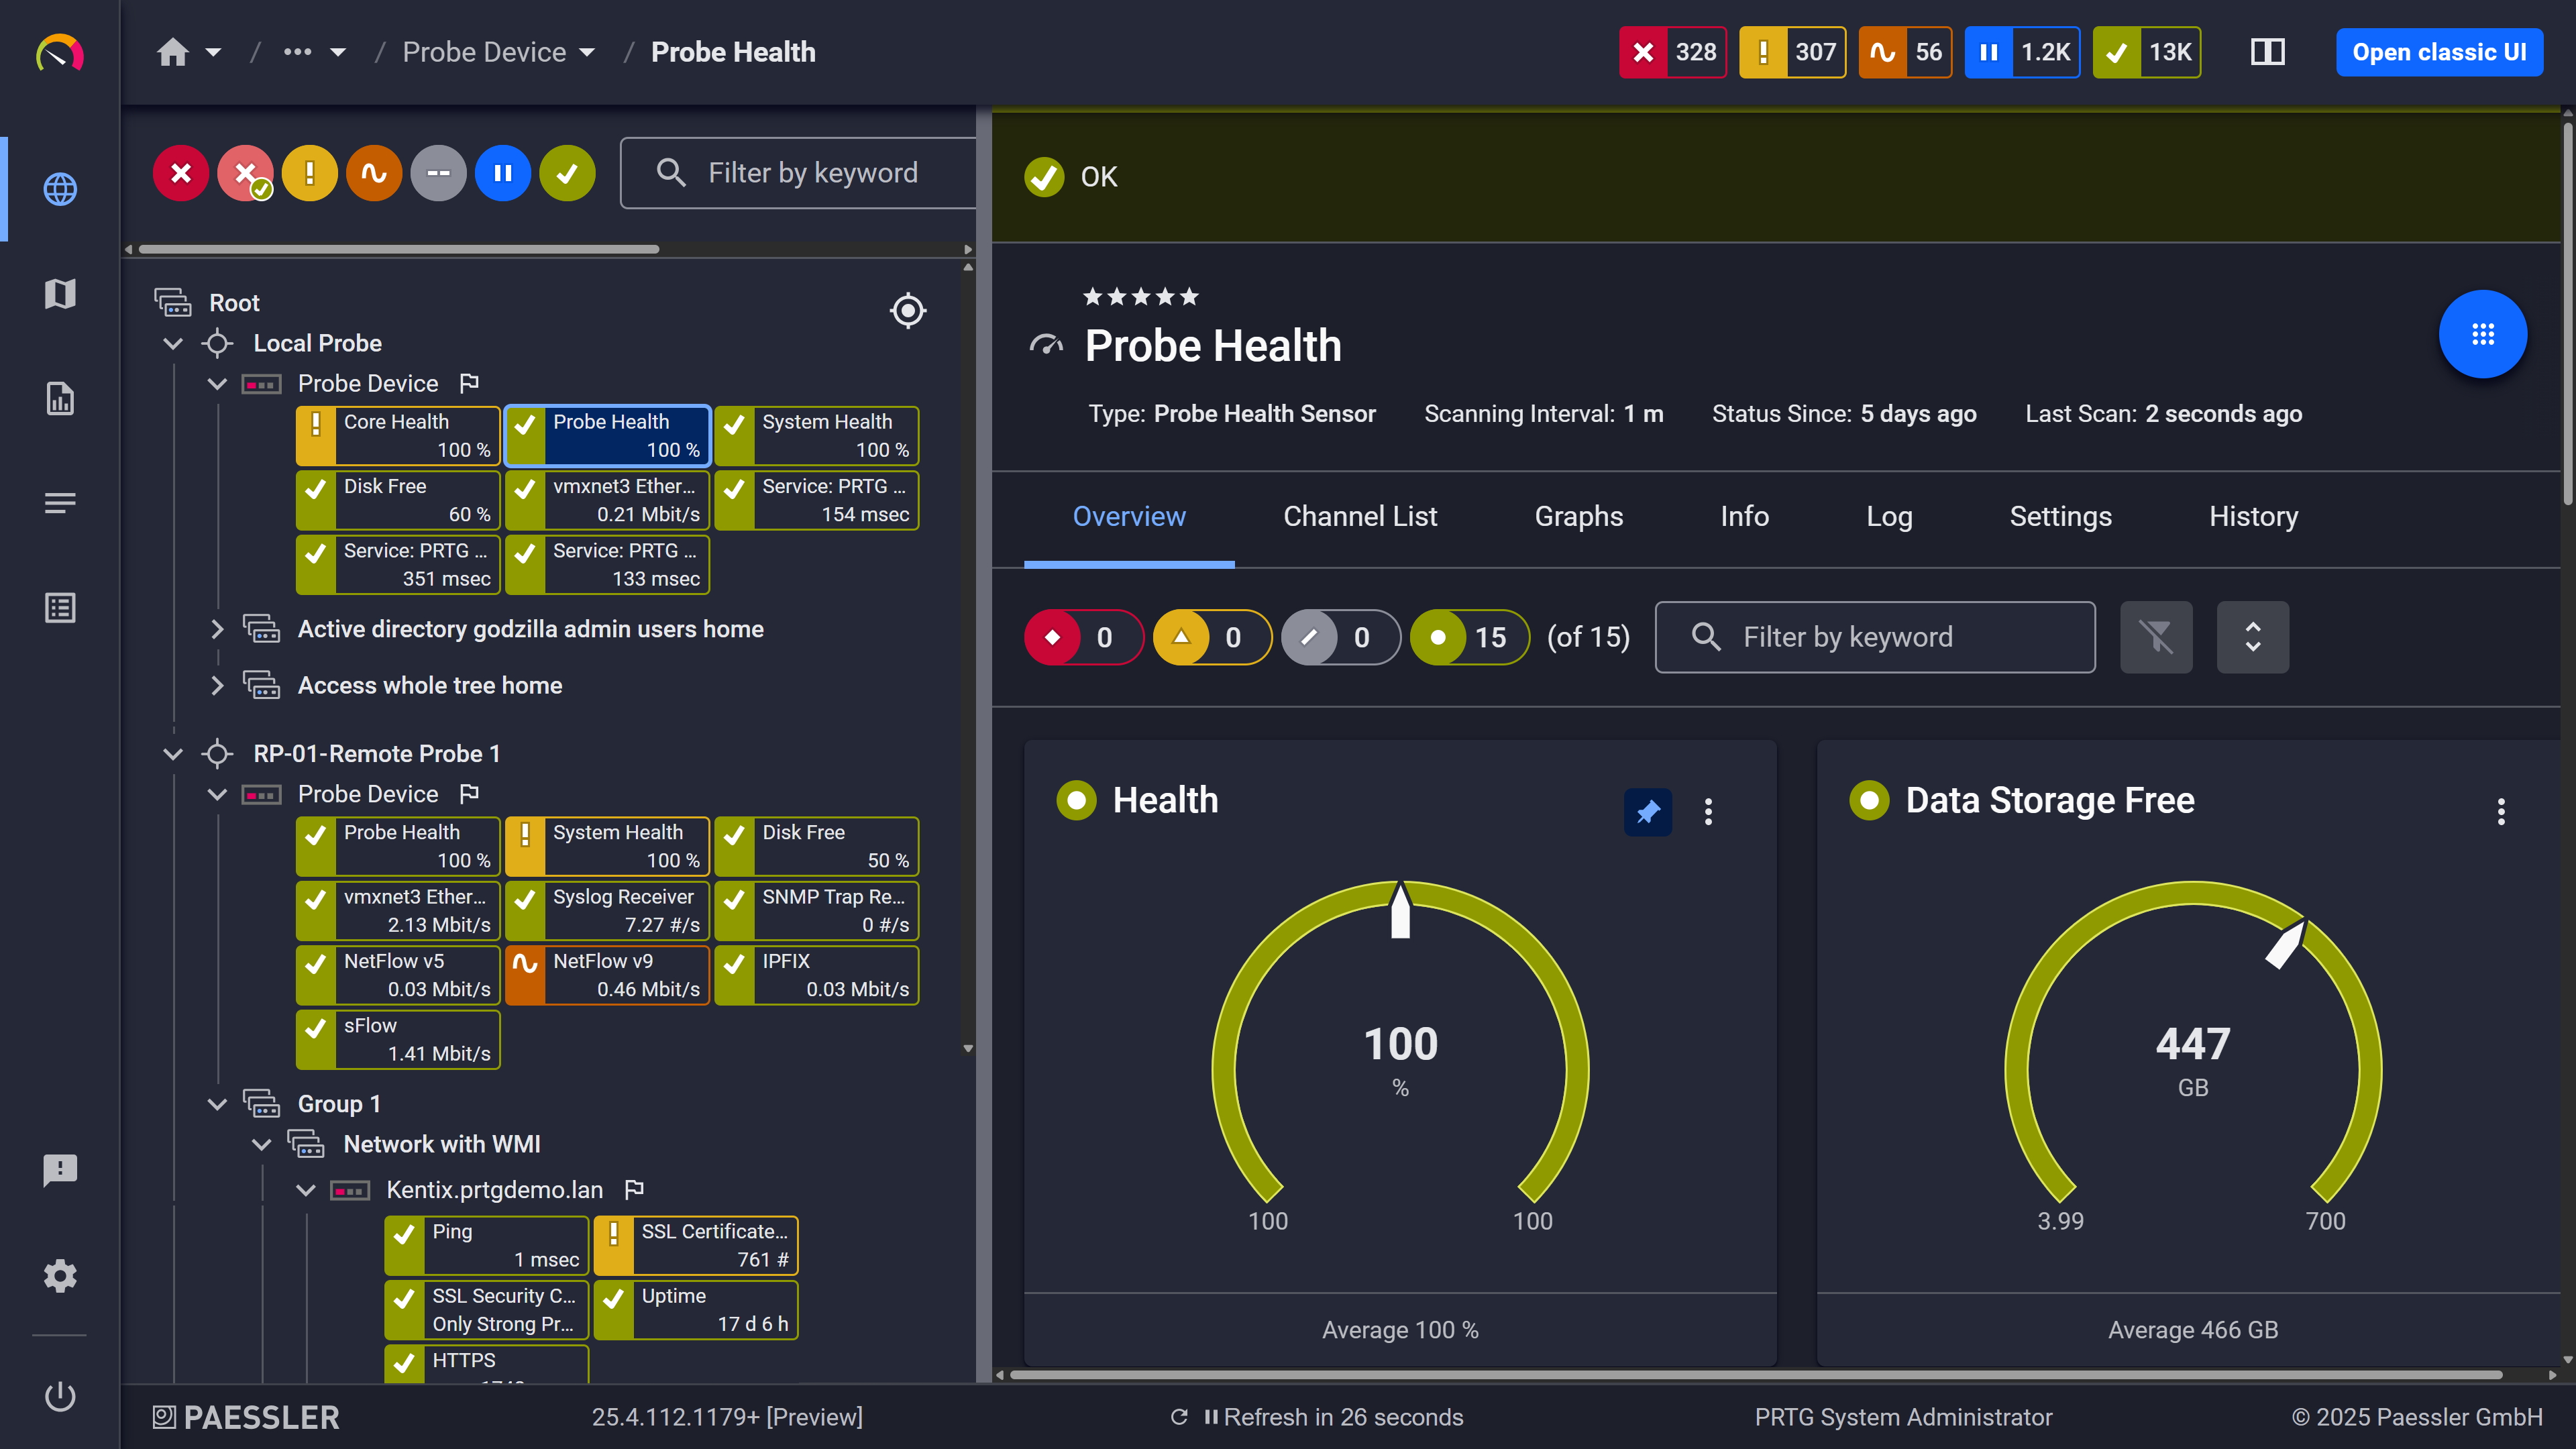
Probe health at a glance

Correlate Database Metrics with Infrastructure Health 

When Postgres slows down, the database is usually not the whole story. Could be disk I/O, could be network, could be something upstream in your infrastructure. If your PostgreSQL monitoring sits in one tool and your server metrics sit in another you're already spending time you don't have just switching contexts.

PRTG puts both in the same place. Query times, server CPU, disk latency, replication delays: pull them into a single dashboard and look at them together. Correlating a slow query spike with a disk saturation event takes seconds instead of the kind of investigation that involves three browser tabs and a spreadsheet. That's often where the actual answer shows up.This is a bullet point

  • Visualize Postgres metrics alongside server, network, and storage performance in unified dashboards
  • Correlate database slow queries with infrastructure events like CPU spikes or disk saturation
  • Monitor the full stack from network latency to query execution in one monitoring solution
  • Track PostgreSQL performance across distributed environments with remote probes
  • Use historical data to identify patterns between infrastructure changes and database performance

How PRTG Monitors PostgreSQL Databases  

PRTG uses the PostgreSQL sensor to execute custom SQL queries and track the results. You write the queries that matter to your environment: performance metrics, replication status, table statistics. PRTG runs them on your defined schedule and turns query results into monitored channels with alerts and historical tracking.

Custom SQL Queries

The PostgreSQL sensor takes the SQL queries you define, including any calls to PostgreSQL functions and stored procedures, and runs them against your database on the schedule you set.

You configure up to 10 monitoring channels, each pulling values from specific columns you define. A single query can track multiple metrics that way. Store your SQL scripts in the \Custom Sensors\sql\postgresql subfolder of the PRTG program directory then PRTG executes them against your Postgres server, measuring both query execution time and the returned values.

This covers anything PostgreSQL exposes through SQL: standard pg_stat views, custom application tables, whatever you need to track.

PostgreSQL System Views

Postgres exposes performance data through system views.

The views you'll use most: pg_stat_activity for live connections and what queries are actually running, pg_stat_database for transaction counts and block-level stats, and pg_stat_statements if you want to dig into query-level performance data. That last one requires the extension to be loaded, worth checking before you write queries against it.

From those views you pull active connection counts, transaction rates, cache hit ratios, execution counts per query. pg_stat_replication covers replication lag and WAL sender status. pg_stat_bgwriter is where checkpoint data lives. And if you have application-specific tables you want to track, those work exactly the same way, you just write the query.

Execution Time Tracking

The PostgreSQL sensor automatically tracks three timing metrics: total execution time, which covers everything from connection open to close; query execution time for the SQL statement itself; and the number of rows the query returned. That third one is easy to overlook but matters when you're diagnosing queries that return large result sets.

Where slowdowns actually originate is not always obvious from the outside. Network latency, connection overhead, and the query itself can all produce the same symptom. The built-in timing split is where you start separating them. Set individual thresholds per component and you're catching degradation at the right level, not just watching the total go red.

Distributed Database Monitoring

PRTG's distributed architecture lets you monitor PostgreSQL databases across multiple sites using remote probes. Each probe executes queries locally to the database server, which cuts network overhead and keeps query response times accurate.

From a single PRTG installation you can cover multiple Postgres instances and track replication across geographically distributed primary-standby setups. Database performance data lands in centralized dashboards. The maps view is worth setting up if you're running more than a handful of locations, mostly because it makes the distributed picture readable at a glance.

Requirements and Setup 

To monitor Postgres with PRTG you need .NET Framework 4.7.2 or later on the probe system and PostgreSQL Version 7.x or later on the target database server. SQL query scripts go in the \Custom Sensors\sql\postgresql subfolder of the PRTG program directory.

Also required: valid PostgreSQL credentials with SELECT permissions on the system views you want to query. The sensor uses standard Postgres network protocols. That means it works with local databases, remote PostgreSQL servers, and cloud-hosted instances like Amazon RDS, without any special configuration per environment.

free downLoad

PostgreSQL Monitoring: Manual vs. PRTG

Feature

Without PRTG

Without PRTG

With PRTG

With PRTG

Data Collection

Without PRTG
not included

Log into each PostgreSQL server individually, run psql commands to query pg_stat views, export results to spreadsheets

With PRTG
included

Automated SQL query execution on schedule, results in real-time dashboards with historical trends

Alerting

Without PRTG
not included

Set up cron jobs or scheduled tasks to run SQL scripts and parse output files for alert conditions

With PRTG
included

Custom alert thresholds on any query result, immediate notifications via email, SMS, Teams, Slack, or push notification

Infrastructure Correlation

Without PRTG
not included

Switch between database query results and separate server monitoring tools to correlate metrics. This is the one that gets expensive in time.

With PRTG
included

Unified database monitoring and infrastructure monitoring in one pane of glass. PostgreSQL performance, server resources, network metrics, and infrastructure health in one platform

Query Performance Tracking

Without PRTG
not included

Manually review pg_stat_statements output and compare execution times over days or weeks

With PRTG
included

Continuous tracking of query execution time with historical graphs and threshold-based alerting

Replication Monitoring

Without PRTG
not included

Query pg_stat_replication manually, calculate time differences

With PRTG
included

Automated replication lag monitoring with alerts when standby servers fall behind defined thresholds

free downLoad

“We set up PRTG to read the event logs of the service. If the service is no longer able to access the database, then this information is recorded in the service’s EventLog and immediately detected by PRTG via WMI. The software then automatically triggers a script that restarts the service. The service reestablishes its connection to the database and the problem is solved.”

David Jungwirth
Austrian Red Cross

“Thanks to significant improvements in performance, the integration of all monitoring (including that of databases and SAP services) into PRTG, numerous automation options, and the consolidation of all locations into the centralized monitoring system, we have been able to greatly relieve our help desk and provide for the most reliable and comprehensive of monitoring services.”

Mirco Blöchliger
Somnitec AG

“We are currently using 4,500 sensors across the whole hospital which monitor physical servers, virtual machines, physical switches, ports, special devices such as ventilators and we also started writing some scripts which check SQL databases. So far PRTG has led to faster problem resolution, which has helped reduce downtime, made the team more efficient and, as a consequence, has freed up time for other projects.”

Uri Inbar, Director of IT
ALYN Hospital

Paessler PRTG Network Monitor licenses & pricing

Choose the PRTG Network Monitor subscription that's best for you.

License NameLicense descriptionPriceLicense DetailsGet startedPricing Details
PRTG 500$200per month paid annuallyBuy nowBuy now

Enough to monitor multiple aspects of 50 devices

PRTG 1000$358per month paid annuallyBuy nowBuy now

Enough to monitor multiple aspects of 100 devices

PRTG 2500$742per month paid annuallyBuy nowBuy now

Enough to monitor multiple aspects of 250 devices

PRTG 5000$1,300per month paid annuallyBuy nowBuy now

Enough to monitor multiple aspects of 500 devices

PRTG 10000$1,642per month paid annuallyBuy nowBuy now

Enough to monitor multiple aspects of 1000 devices

Over 100,000 Customers Worldwide Love Paessler  

customer success stories

 PostgreSQL Monitoring: Frequently Asked Questions


What PostgreSQL metrics can PRTG monitor?

Anything you can query via SQL, which in practice is most of what Postgres exposes. The common ones: active connections and running queries from pg_stat_activity, transaction and block stats from pg_stat_database, query-level performance data from pg_stat_statements. Replication lag, autovacuum activity, checkpoint stats, cache hit ratios, table sizes. The sensor runs your SQL query and you map result columns to up to 10 monitoring channels. Basically if you can write a SELECT for it, PRTG can track it.

Does PRTG support monitoring Amazon RDS PostgreSQL or Azure Database for PostgreSQL?

Yes, as long as the instance is reachable over the network. Amazon RDS PostgreSQL, Azure Database for PostgreSQL, both work. You need connectivity from the PRTG probe to the database endpoint and credentials with the right permissions on the views you're querying.

One thing worth being clear about: cloud-specific management features like RDS Performance Insights or automated backup status come from the cloud provider's management API, not from PostgreSQL itself. For those metrics, use PRTG's dedicated AWS or Azure sensors. Core PostgreSQL database performance monitoring works the same whether on-premises or cloud-hosted.

How does PRTG handle PostgreSQL query performance monitoring?

Three timing metrics come built in: total execution time from connection open to close, query execution time for just the SQL itself, and rows affected. That split is useful because a slow total with a fast query execution time usually points to connection overhead, not the query.

For deeper analysis you'll want pg_stat_statements. Write a SQL query against it to pull average execution times, call counts, rows returned, buffer reads. Configure thresholds on what matters for your workload and PRTG handles the alerting from there.

Can PRTG monitor PostgreSQL replication and high-availability setups?

Yes. pg_stat_replication is where most of this lives: replication lag, standby server status, WAL sender processes, replication slot activity. Write a query against it and configure PRTG to run it on schedule. You'll see how far behind your standby servers are, can monitor WAL file generation rates, and get alerts when delays exceed your RPO thresholds.

PRTG's distributed probe architecture lets you watch both primary and standby instances at the same time, even across different geographic locations. That part tends to matter more than people expect.

What are the requirements for setting up PostgreSQL monitoring in PRTG?

.NET Framework 4.7.2 or later on the probe system. PostgreSQL Version 7.x or later on the database server.

SQL scripts go in the \Custom Sensors\sql\postgresql subfolder of the PRTG program directory.

You also need Postgres credentials with SELECT permissions on the views you're querying: typically pg_stat_activity, pg_stat_database, pg_stat_statements. And network connectivity between probe and database server. That's it.

Does monitoring affect PostgreSQL database performance?

The PostgreSQL sensor has a high performance impact compared to simpler PRTG sensors. We recommend no more than 200 PostgreSQL sensors per probe.

Query complexity is what actually determines the overhead. A simple SELECT against pg_stat_activity barely registers. A query that aggregates across large tables will consume real database resources, and that's worth factoring into your interval settings. You control how often PRTG executes queries, so for production systems start conservatively: 5-10 minute intervals, then tighten once you've seen the actual impact.

Paessler PRTG

Paessler PRTG

Network Monitoring Software – Version 26.1.116.1532 (February 9th, 2026)

Hosting icon

Hosting

Download for Windows and cloud-based version PRTG Hosted Monitor available

Languages icon

Languages

English, German, Spanish, French, Portuguese, Dutch, Russian, Japanese, and Simplified Chinese

test

Monitor everything

Network devices, bandwidth, servers, applications, virtual environments, remote systems, IoT, and more

test

Pricing

Choose the PRTG Network Monitor subscription that's best for you

Discover more monitoring insights and stories

Content illustration

Powerful stories from the monitoring world

  • All about IT, Monitoring, and PRTG
  • Complete SQL Performance Monitoring Guide with PRTG SQL ...
  • PRTG 26.1.118 is now available in the stable release channel
Support illustration

Resources to master your monitoring challenges

  • PRTG Manual: PostgreSQL Sensor - Paessler
  • How do a monitor PostgreSQL database performance
  • Monitor PostgreSQL process on Linux?
Solution illustration

Solutions for all your monitoring needs

  • PostgreSQL Monitoring
  • Monitoring Databases
  • Database Monitoring
PRTG Logo

Start Monitoring with PRTG and see how it can make your network more reliable and your job easier.

Free download
PRODUCT OVERVIEW

Products

  • Paessler PRTG
    Paessler PRTGMonitor your whole IT infrastructure
    • PRTG Network Monitor
    • PRTG Enterprise Monitor
    • PRTG Hosted Monitor
    • PRTG UVexplorer
    • PRTG extensions
      Extensions for Paessler PRTGExtend your monitoring to a new level
  • Icon Features
    FeaturesExplore all monitoring features

Monitoring with PRTG

  • Network monitoring
  • Bandwidth monitoring
  • SNMP monitoring
  • Network mapping
  • Wi-Fi monitoring
  • Server monitoring
  • Network traffic analyzer
  • NetFlow monitoring
  • Syslog server

Useful Links

  • PRTG Manual
  • Knowledge Base
  • Customer Success Stories
  • About Paessler
  • Subscribe to newsletter
  • PRTG Support
  • PRTG Consulting
  • PRTG Feedback & Roadmap

Contact

Paessler GmbH
Thurn-und-Taxis-Str. 14, 
90411 Nuremberg 
Germany

[email protected]

+49 911 93775-0

  • Contact us
©2026 Paessler GmbHTerms & ConditionsPrivacy PolicyImprintReport VulnerabilityDownload & InstallSitemap
CCTV CCTV CCTV