
- English
- Deutsch
- Español
- Français
- Italiano
- Português
Effective log monitoring means collecting, filtering, and acting on messages from servers, network devices, firewalls, and applications in near real time. The challenge is that every system logs differently: syslog from Linux and network gear, Windows Event Logs from Microsoft infrastructure, SNMP traps from switches and UPS systems, text-based files from custom applications. Without a centralized approach, critical errors get missed.
Paessler PRTG brings all of this together in one platform. Preconfigured sensors watch for critical errors, filter out noise, and alert you the instant something relevant appears. Whether you need to cover a handful of servers or distributed infrastructure across multiple sites, you get centralized visibility and fast alerts without per-GB pricing or complex pipeline configuration.
Supported technologies: Syslog (UDP/TCP/TLS), Windows Event Logs (Application, System, Security, DNS, Directory Service), SNMP Traps, file-based logs, Linux servers, Windows servers, network devices (Cisco, Juniper, Palo Alto, Fortinet), firewalls, routers, switches, VMware, Hyper-V

Critical errors buried in thousands of log entries mean slow detection and an even slower response time. By the time IT operations teams notice a problem, users are already affected. You can't afford to miss the warnings that matter, and manually checking log files across dozens of servers doesn't scale.
Log monitoring from PRTG alerts you in near‑real‑time when a critical event occurs, before users even notice the impact. Syslog Receiver sensors, Windows Event Log sensors, and SNMP Trap Receiver sensors continuously watch for error patterns, failures, and security events. Your team gets the seconds and minutes needed to prevent downtime.
Logs are scattered. Servers, network devices, firewalls, applications, cloud services. Each system has its own log format, its own interface, its own quirks. Debugging a single issue means logging into multiple consoles, correlating timestamps manually, hunting for clues across disconnected data sources.
Centralized log collection from PRTG puts all your infrastructure in one unified dashboard. Windows Event Logs, syslog from network devices and Linux servers, SNMP traps from switches and firewalls, file-based application logs. All in one single pane of glass.
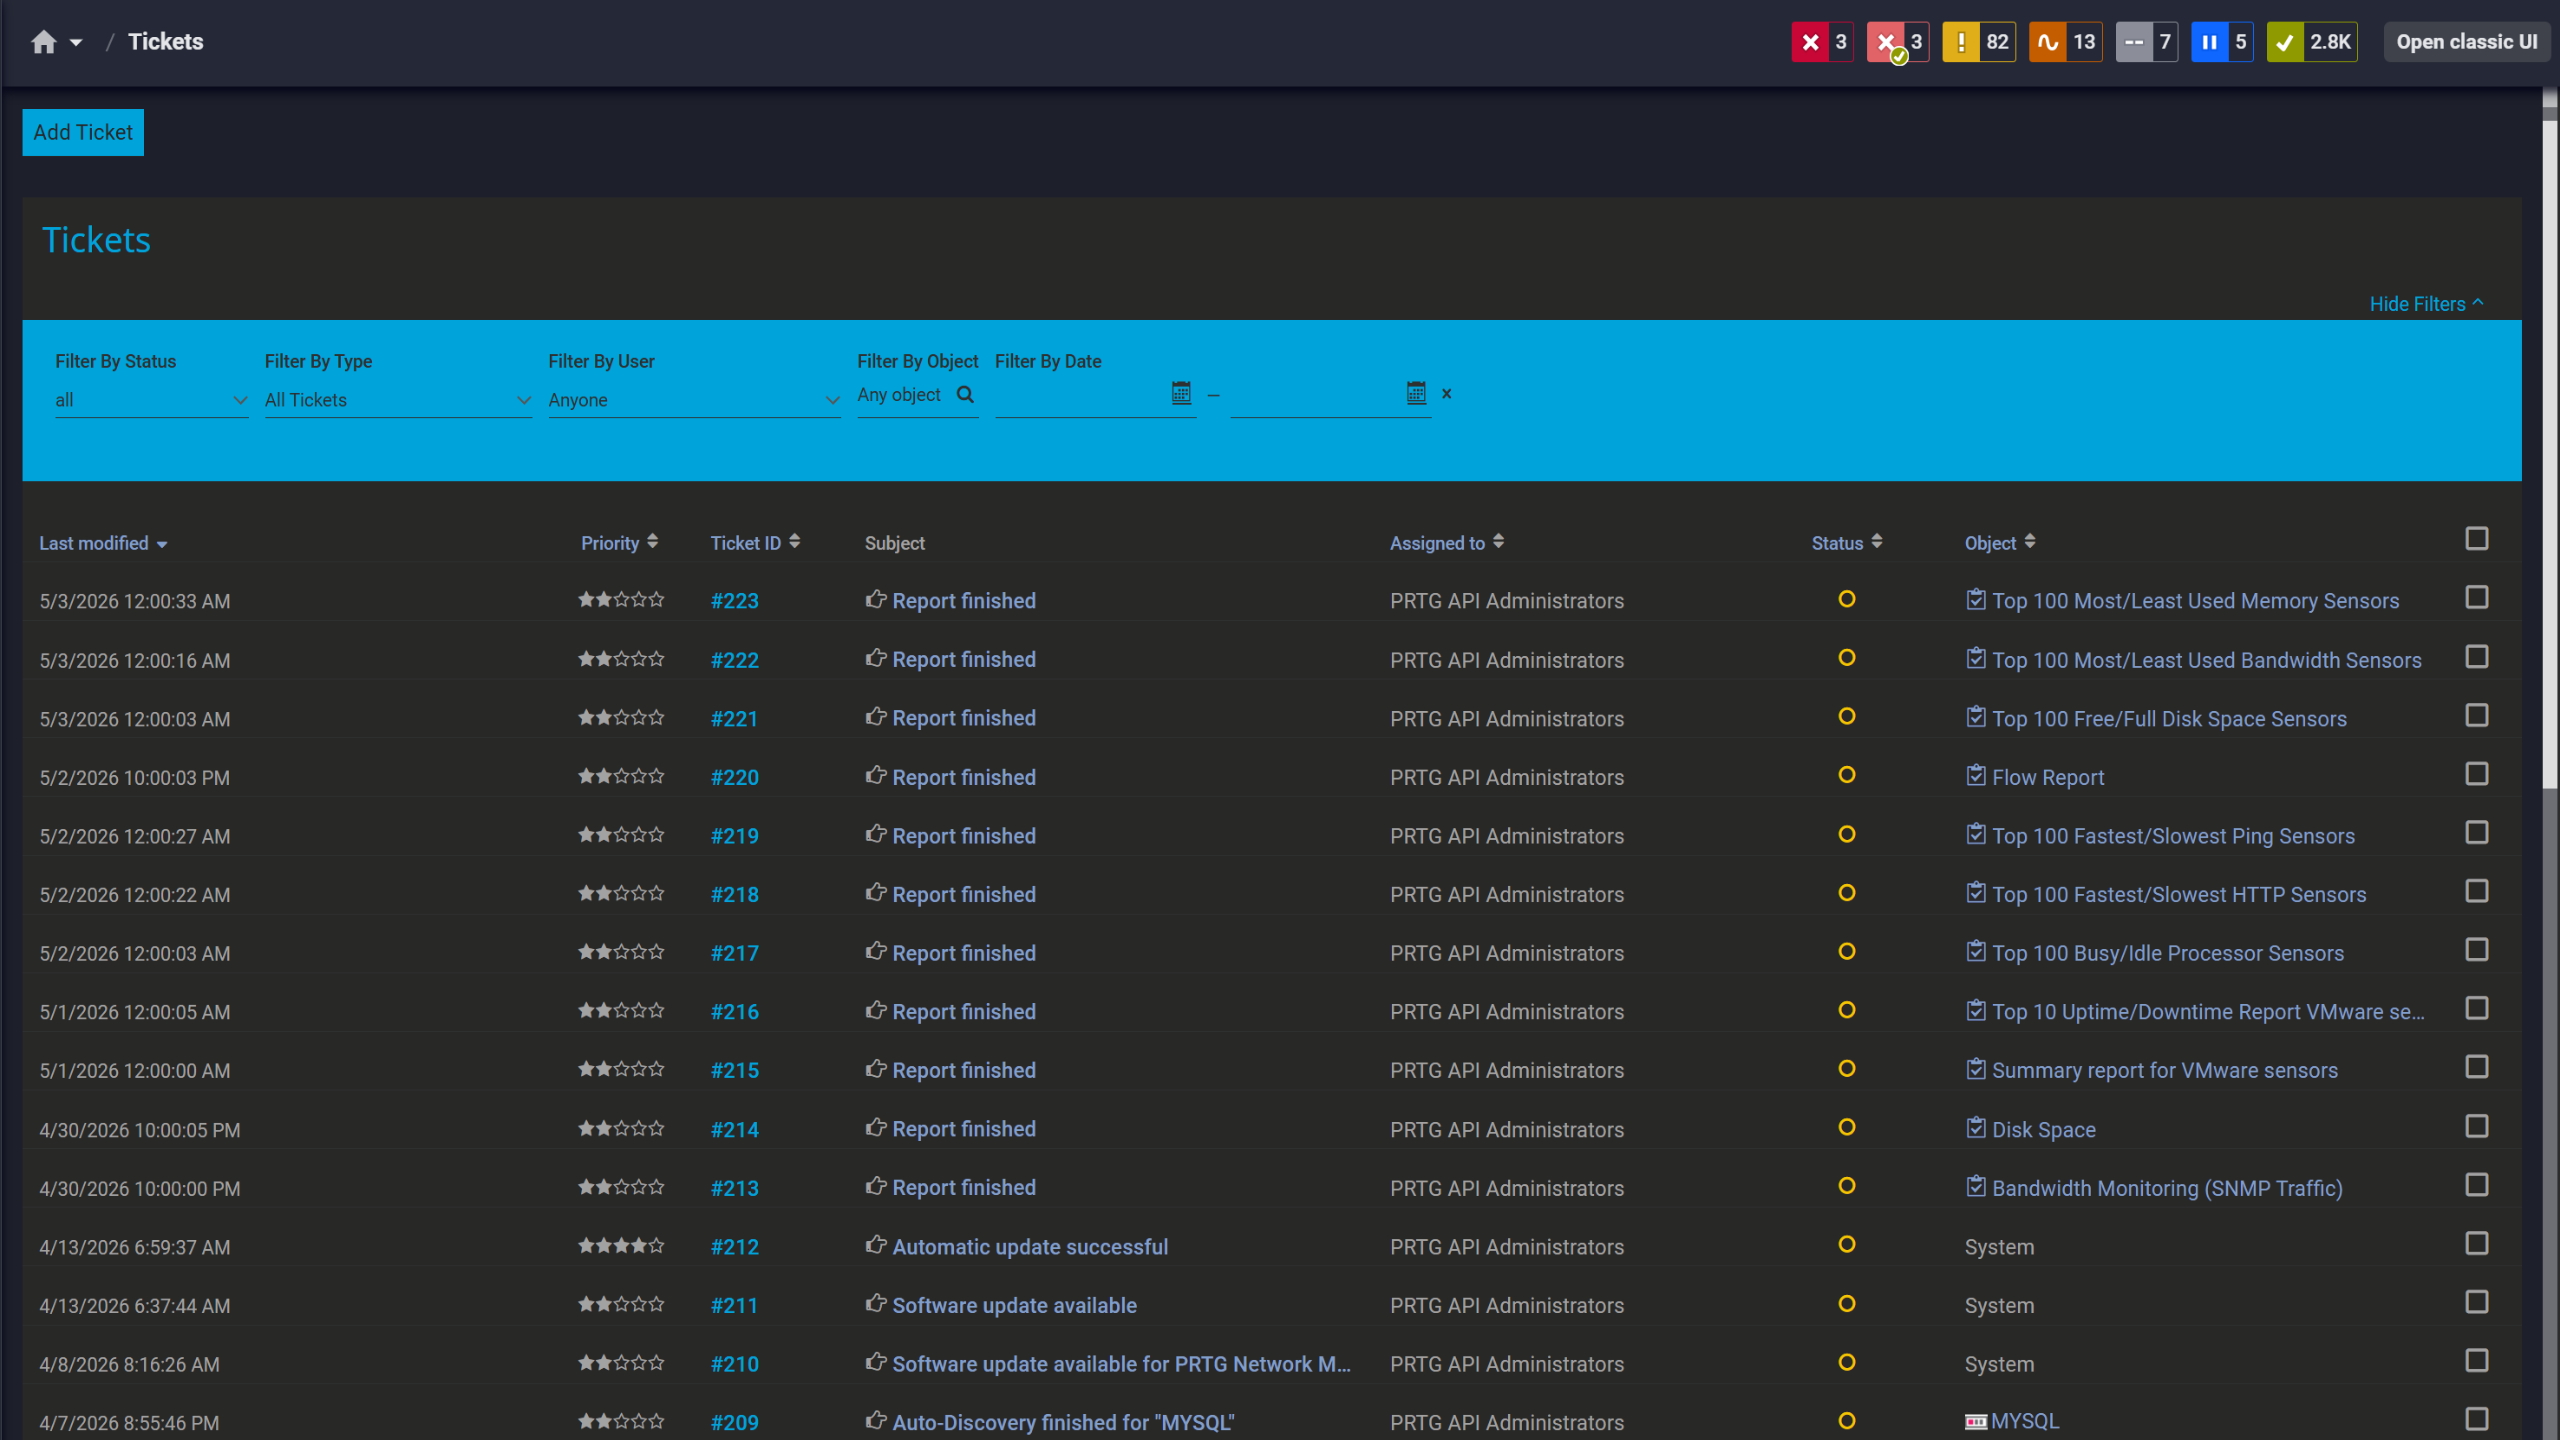
Tickets keep your team aligned
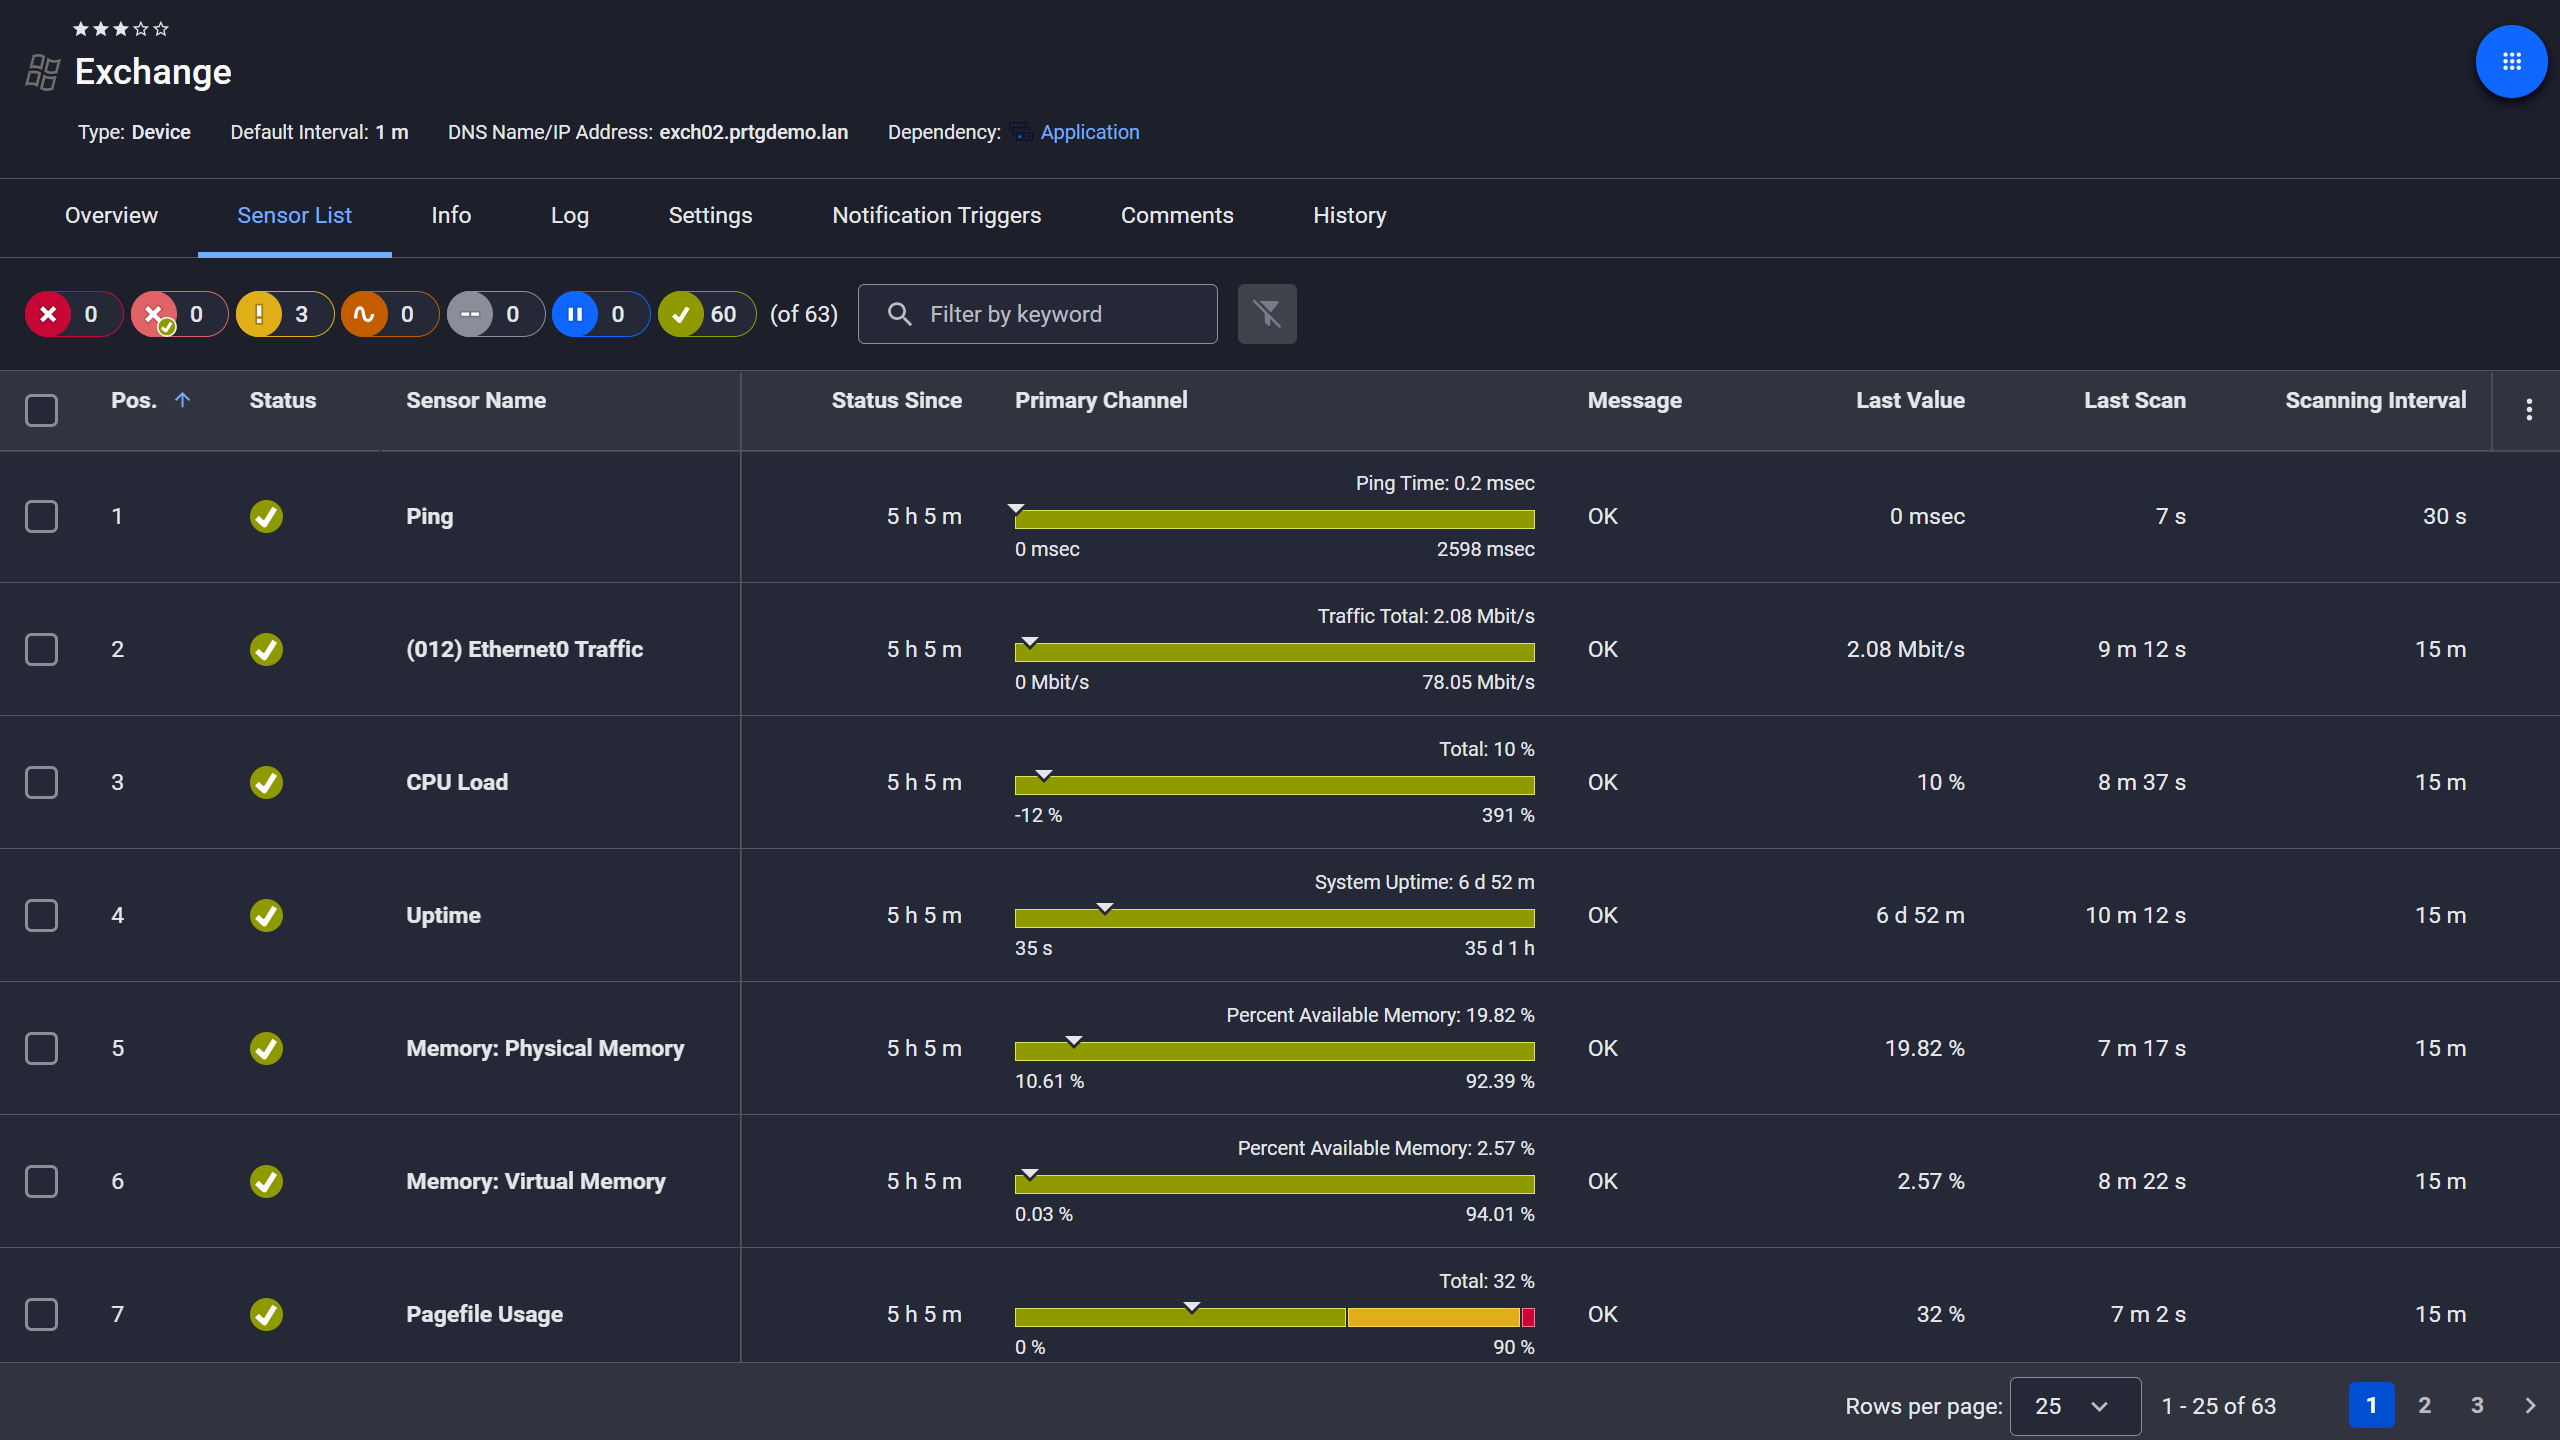
Exchange server, fully under control

Live graphs, real-time performance data
Dedicated log monitoring tools come with steep learning curves. Complex parsing pipelines, expensive per-GB ingestion fees, specialist skills requirements. Your team needs to troubleshoot issues and monitor infrastructure, not become log analytics experts.
A low-code approach from PRTG makes log monitoring simple. Pre-configured sensors for Windows Event Logs, syslog, and SNMP traps work out of the box. Point, click, done. You'll be monitoring production systems in minutes.
Start monitoring your infrastructure in minutes. No professional services, no complex configuration, no risk.
When logs live in a separate tool from your infrastructure monitoring, correlation becomes guesswork. Was that application error caused by a network issue? Server resource spike? Database timeout? Switching between monitoring dashboards and log platforms slows down troubleshooting and creates blind spots.
Unified log and infrastructure monitoring from PRTG shows everything in context. Log alerts appear on the same dashboard as CPU usage, network traffic, disk space, and application performance. Correlate Windows Event Log errors with server metrics, syslog warnings with network bandwidth spikes, SNMP traps with device health.

Full device list, instant overview
Scheduled reports, always on time
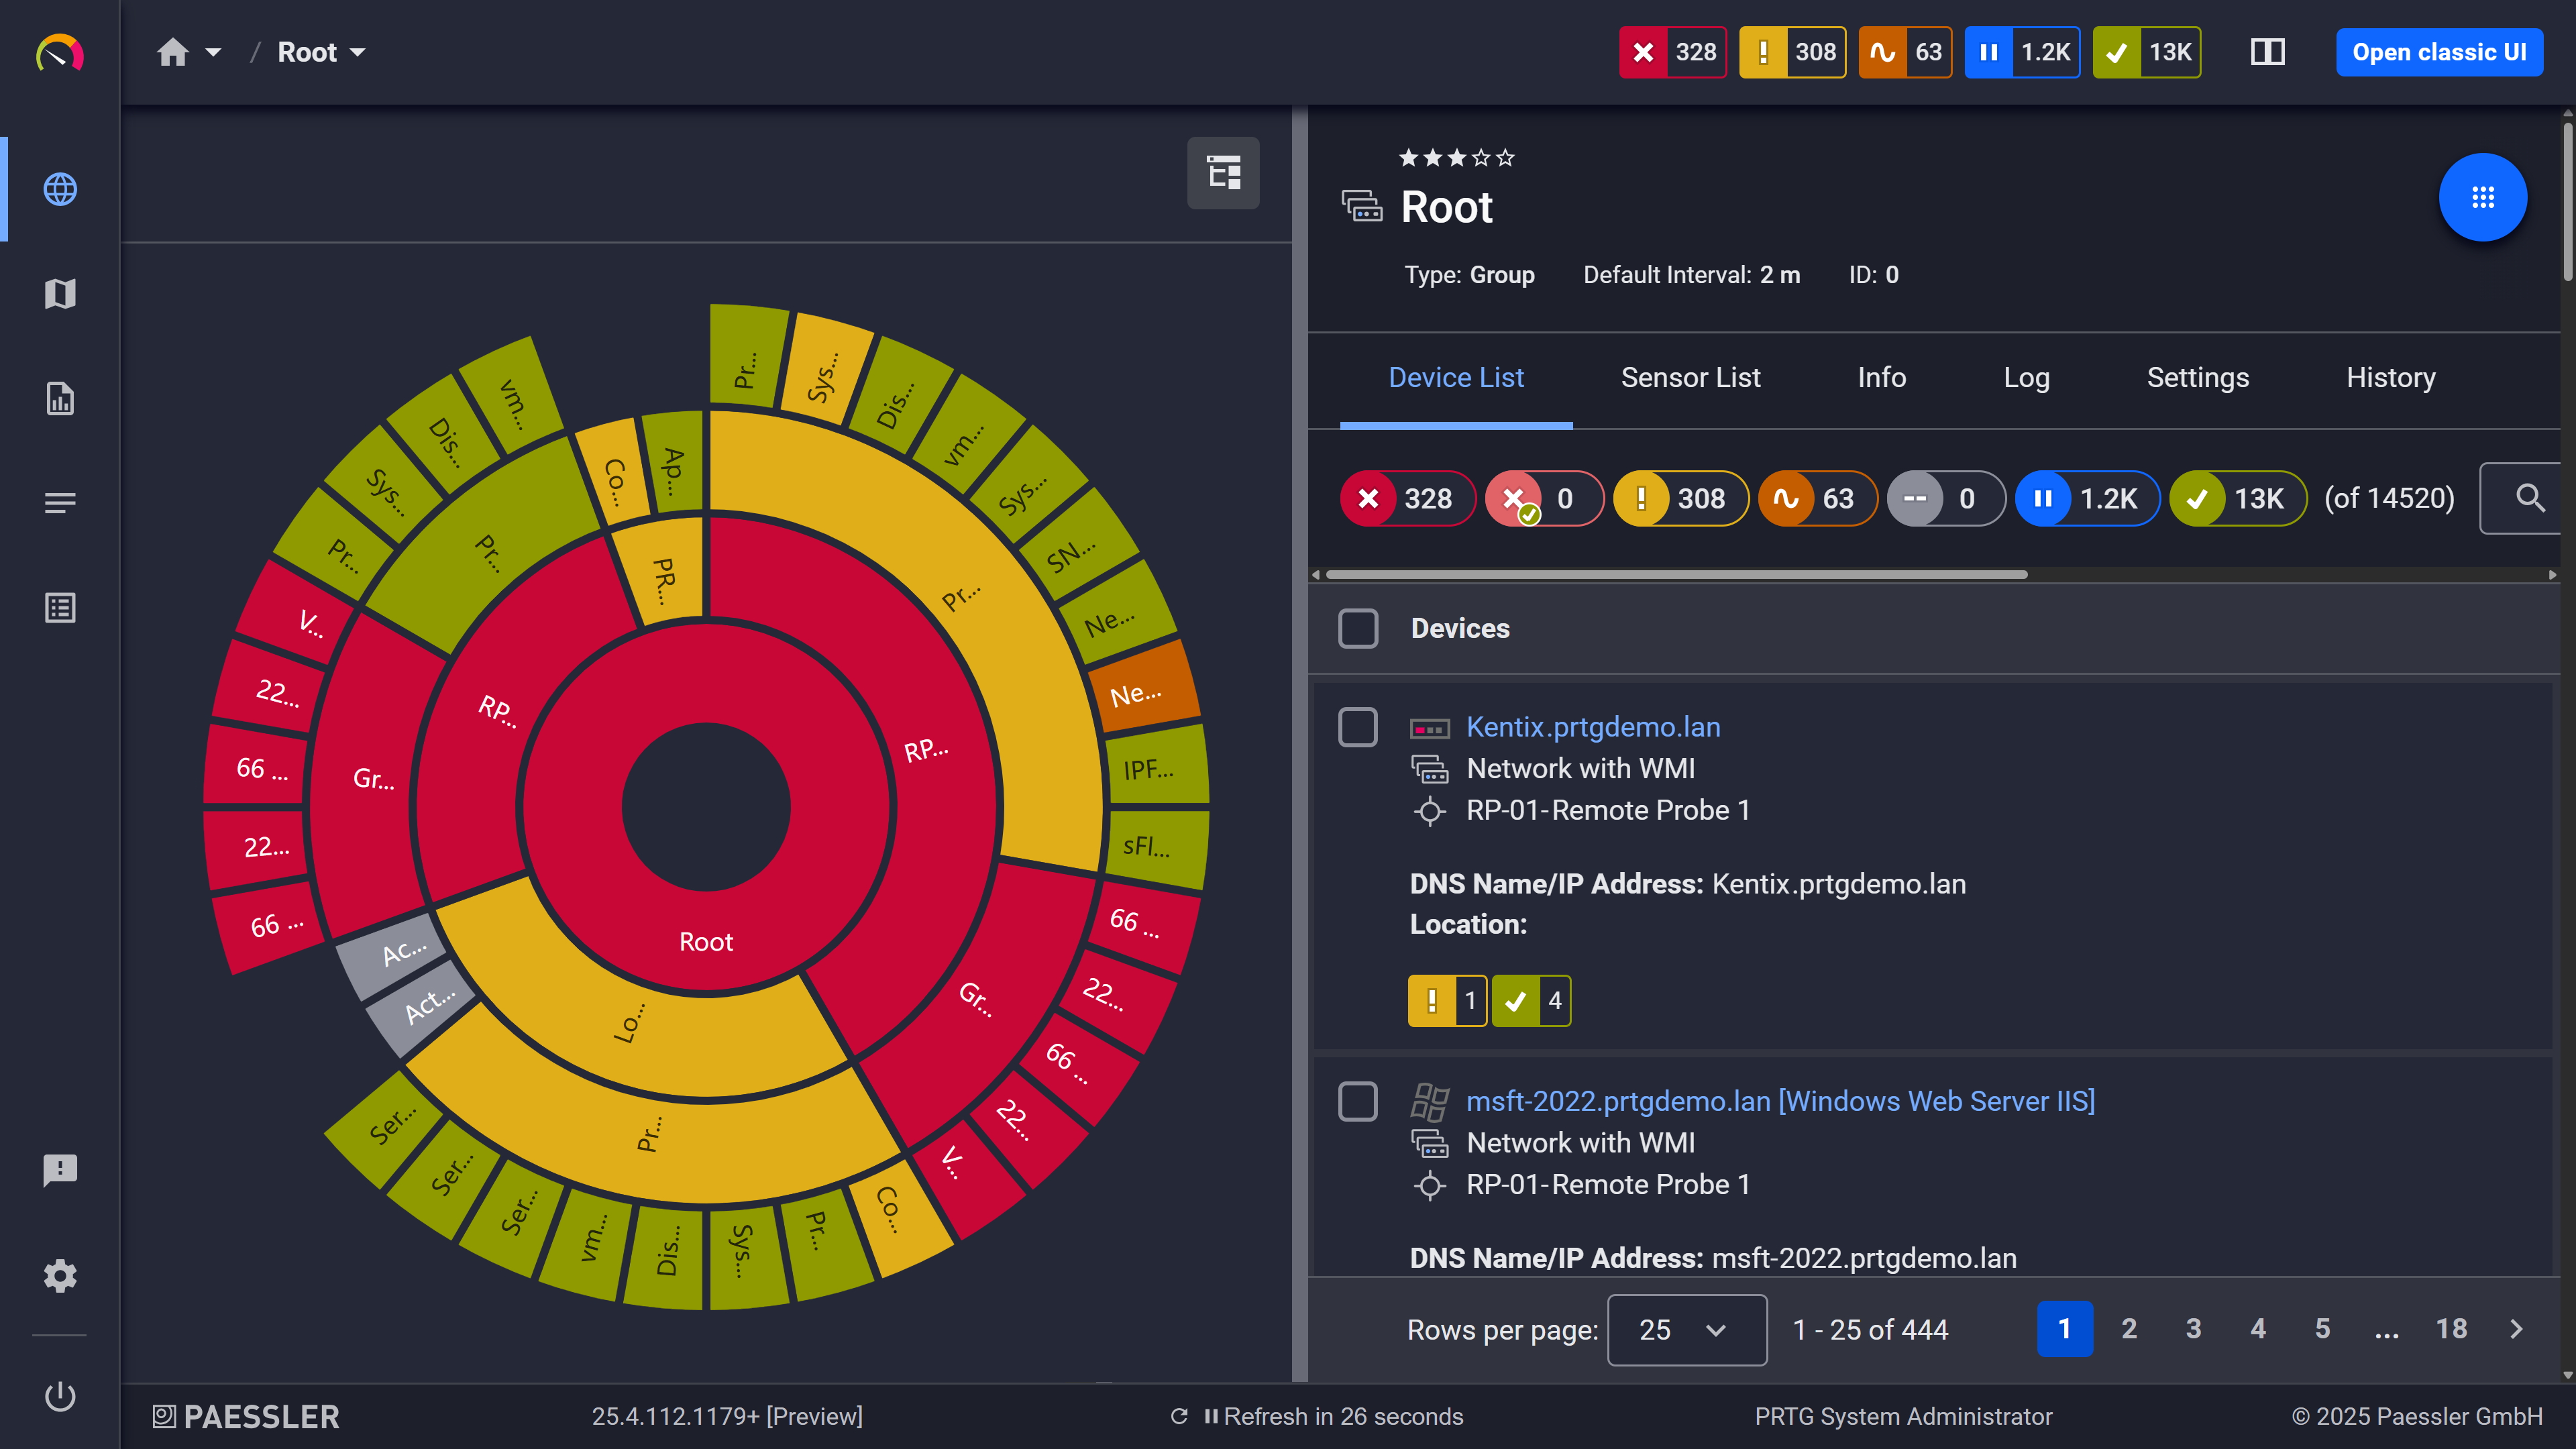
Your entire network, visualized instantly
Per-GB ingestion pricing makes log monitoring unpredictable and expensive. As your infrastructure grows or when you need to increase log verbosity during troubleshooting, costs spike. You're forced to choose between comprehensive monitoring and budget constraints, often limiting what you collect or your log retention policies.
Sensor-based subscription means you can collect unlimited syslog, SNMP trap, and Event Log volume per sensor No per-GB fees. Monitor as many syslog sources, Windows Event Logs, SNMP traps, and application logs as you need without worrying about data volume.
Multiple sensor types work together to monitor log data from different protocols and data sources. Syslog Receiver sensors collect network messages from devices and servers. Windows Event Log sensors track errors and warnings as they're written to application, system, and security logs. SNMP Trap Receiver sensors process traps from network infrastructure. File Content sensors monitor text-based log files in real time. Together, you get comprehensive observability across your entire infrastructure.
FEATURE | Without PRTG Without PRTG | With PRTG With PRTG |
|---|---|---|
Syslog collection | Without PRTG Configure syslog forwarding to a file, manually review files or scripts | With PRTG Automated Syslog Receiver sensor with near real-time filtering and instant alerts |
Windows Event Log analysis | Without PRTG Remote desktop to each server, open Event Viewer, search manually | With PRTG Near real-time event log filtering with automatic alerts and centralized dashboard |
Log filtering and parsing | Without PRTG Write custom scripts or regex queries for each log source individually | With PRTG Built-in PCRE regex and text matching filters in pre-configured sensors |
Alert when errors occur | Without PRTG Hope someone notices logs during periodic reviews | With PRTG Instant notifications via email, SMS, push, webhook, or ITSM integration |
Centralized visibility | Without PRTG Log into multiple consoles, correlate data manually across sources | With PRTG Unified dashboard showing all log sensors and infrastructure metrics together |
Choose the PRTG Network Monitor subscription that's best for you.
| License Name | License description | Price | License Details | Get started | Pricing Details | |
|---|---|---|---|---|---|---|
| PRTG 500 | $200 | per month paid annually | Buy nowBuy now | Enough to monitor multiple aspects of 50 devices | ||
| PRTG 1000 | $358 | per month paid annually | Buy nowBuy now | Enough to monitor multiple aspects of 100 devices | ||
| PRTG 2500 | $742 | per month paid annually | Buy nowBuy now | Enough to monitor multiple aspects of 250 devices | ||
| PRTG 5000 | $1,300 | per month paid annually | Buy nowBuy now | Enough to monitor multiple aspects of 500 devices | ||
| PRTG 10000 | $1,642 | per month paid annually | Buy nowBuy now | Enough to monitor multiple aspects of 1000 devices |

PRTG is designed to complement, not replace, dedicated log management and SIEM tools. It excels at near real-time log monitoring, infrastructure correlation, and immediate alerting. Perfect for troubleshooting, incident response, and operational visibility. For deep log analytics, long-term retention, compliance workflows, anomaly detection, or full-text search across massive log volumes, PRTG can forward log data to external platforms (Elasticsearch, Splunk, open source tools) via Data Exporter, REST API, or PRTG Data Hub relay while simultaneously providing near real-time monitoring and alerts.
Yes. Multiple architectures support distributed log collection. Deploy PRTG Remote Probes (Windows, Linux, Docker) at branch offices or edge locations to collect logs locally and report to your central PRTG server. For advanced scenarios requiring multi-destination forwarding (sending logs to PRTG and an external archive simultaneously), PRTG Data Hub acts as a network relay with configurable forwarding rules. Data Hub runs on Linux (Debian/Ubuntu) and requires a separate license.
For most log monitoring, no. Syslog Receiver sensors don't require agents because devices and servers send syslog messages directly to PRTG. Windows Event Log sensors use agentless protocols like WMI, so you don't need to install anything on target servers. File Content sensors require network access to the file path but don't need a dedicated agent. Just make sure the PRTG server or probe has the necessary permissions and network access.
PRTG charges based on the number of sensors you deploy, not the volume of log data collected. One syslog sensor can receive very high message volumes from multiple sources within the limits of your probe system resources. You pay for the monitoring functionality, not the data volume or retention. This means predictable costs when you scale, increase log verbosity during troubleshooting, or add new infrastructure. No surprise bills based on data consumption.
Most teams start monitoring logs within minutes. Auto-discovery identifies many systems automatically, and adding log sensors (Syslog Receiver, Windows Event Log, SNMP Trap Receiver, File Content) requires minimal setup. Auto-discovery finds Windows servers and network devices automatically. Pre-configured sensors (Windows Event Log, Syslog Receiver, SNMP Trap Receiver, File Content) require minimal setup. Define your alert thresholds, and you'll be monitoring production systems immediately.
Network Monitoring Software – Version 26.3.124.1727 (September 16, 2026)
Download for Windows and cloud-based version PRTG Hosted Monitor available
English, German, Spanish, French, Portuguese, Dutch, Russian, Japanese, and Simplified Chinese
Network devices, bandwidth, servers, applications, virtual environments, remote systems, IoT, and more
Choose the PRTG Network Monitor subscription that's best for you



