Custom alerts and data visualization let you quickly identify and prevent performance issues on Windows, Linux, macOS, and other UNIX-based and proprietary operating systems.
Windows may be the backbone of most enterprise networks, but it's unlikely to be the only operating system you're dealing with… even if your organization doesn't have a bring-your-own-device-to-work policy.
You likely have Linux and Unix-based web, database, and application servers. Plus hybrid cloud environments, and routers, switches, and firewalls running on proprietary operating systems like Cisco iOS.
As a sysadmin, you're usually faced with one of two options: pick which operating systems to monitor (if you like living on the edge), or deploy specialized monitoring tools for every OS on your network and complicate your life further.
But there's also a third way. With Paessler PRTG, you can monitor every network component, regardless of which OS it runs on, from one place. It's simpler. It tracks all your key operating system health stats round the clock. And, best of all, it's as flexible and versatile as you need it to be.

Get up and running in minutes, with minimal intervention. Install PRTG with a few clicks and define an IP address range.
The Auto-Discovery functionality adds every device in that IP range to your monitoring environment, based on built-in device templates, and assigns the appropriate sensors. Job done.
Pick your parameters and let PRTG do the work. Select your preferred performance thresholds, and you'll get alerted when a network component is at risk of breaching them.
This way, you can fix the issues pronto before you're flooded with error messages (and colleagues' complaints).
Stop switching between monitoring environments and get a clearer picture of your network's performance and health.
Whichever operating systems you want to keep an eye on, PRTG brings everything together in one clear, intuitive interface you can tailor to your organization's exact requirements.
No need to install specialized software agents or clients (though you can use it as an agent-based monitor if you want to).
Our agentless monitoring software uses protocols like SNMP, SSH, WMI, and Windows performance counters for collecting metrics even from remote systems, so it doesn't hoover up precious system resources.
Diagnose network issues by continuously tracking various proprietary operating systems. Show CPU load, network traffic, memory usage, physical disk space, bandwidth, and other key system metrics in real time. Visualize monitoring data in clear graphs and dashboards to identify problems more easily. Gain the overview you need to troubleshoot underperformance, security loopholes, and other hardware, software, and network issues.

Device tree view of the complete monitoring setup
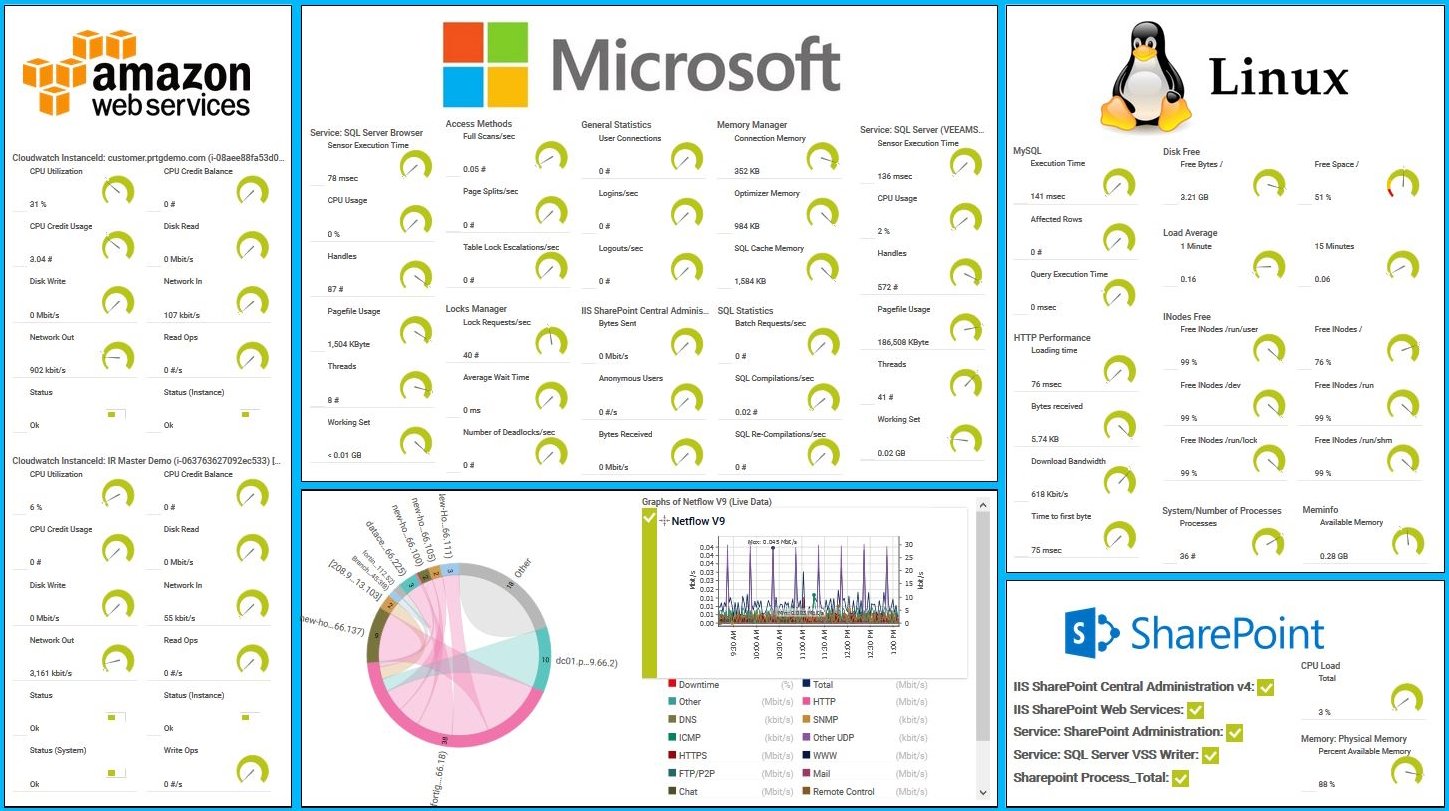
Unified monitoring of AWS, Linux, and Windows services via PRTG custom map

Custom PRTG dashboard for keeping an eye on the entire IT infrastructure

Live traffic data graph in PRTG
“All-around winning
network monitor”
“The real beauty of PRTG is the endless possibilities it offers”
“PRTG Network Monitor
is very hard to beat”
PRTG tracks network components using more than 250 preconfigured sensor types. This means they work right out of the box, connecting seamlessly to your devices, and pulling data into your monitoring environment straight away.
Monitor CPU usage, traffic, memory, hard drives, and much more on your Windows servers.
PRTG even analyzes Windows services and applications such as Microsoft IIS, SharePoint, Active Directory, and Microsoft SQL, Windows Event Log files, and the Windows Security Center.
PRTG keeps an eye on popular distributions such as Ubuntu, Debian, CentOS, RedHat, and SUSE, and can also read data from other Linux distributions.
Monitor various health and performance parameters of your Linux network 24/7.
PRTG also monitors macOS. Although it forms the basis for only the smallest of networks, macOS is often installed on workstations and sometimes even on servers.
Here too, PRTG uses the SNMP protocol. Certain macOS systems (such as Yosemite - version 10.10) can also be monitored via SSH.
Many network devices have their own operating systems. There are SonicWall firewalls, IBM servers, and Hyper-V virtualization solutions, to name just a few.
The big advantage of PRTG is that it comes with sensors for specific manufacturers, as well as sensors that you can customize using the PRTG API.
PRTG comes with more than 250 native sensor types for monitoring your entire on-premises, cloud, and hybrid cloud environment out of the box. Check out some examples below!
The Windows Process sensor monitors a Windows process via Windows Management Instrumentation (WMI) or Windows performance counters. It can show the following:
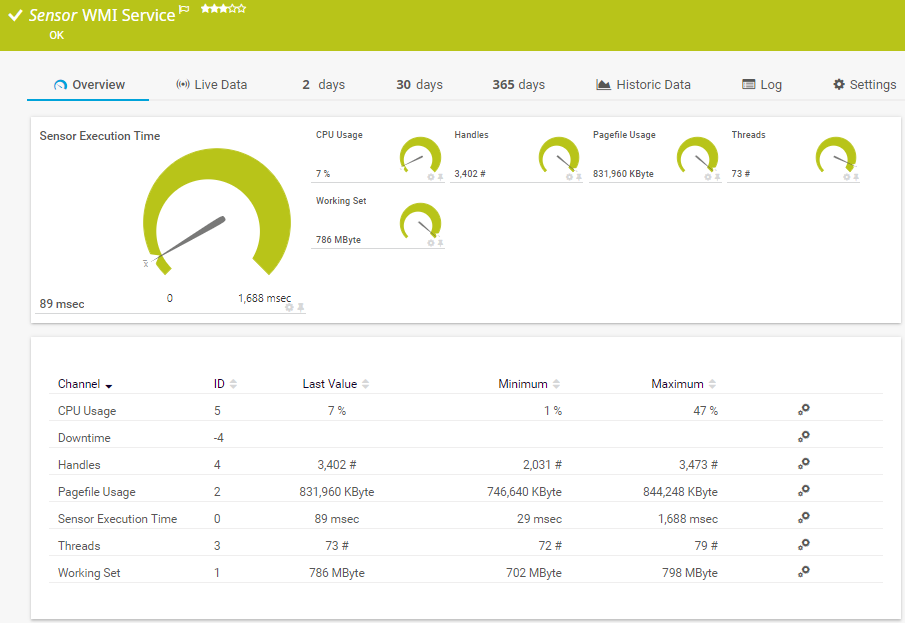
The WMI Service sensor monitors a Windows service. It can show the following:
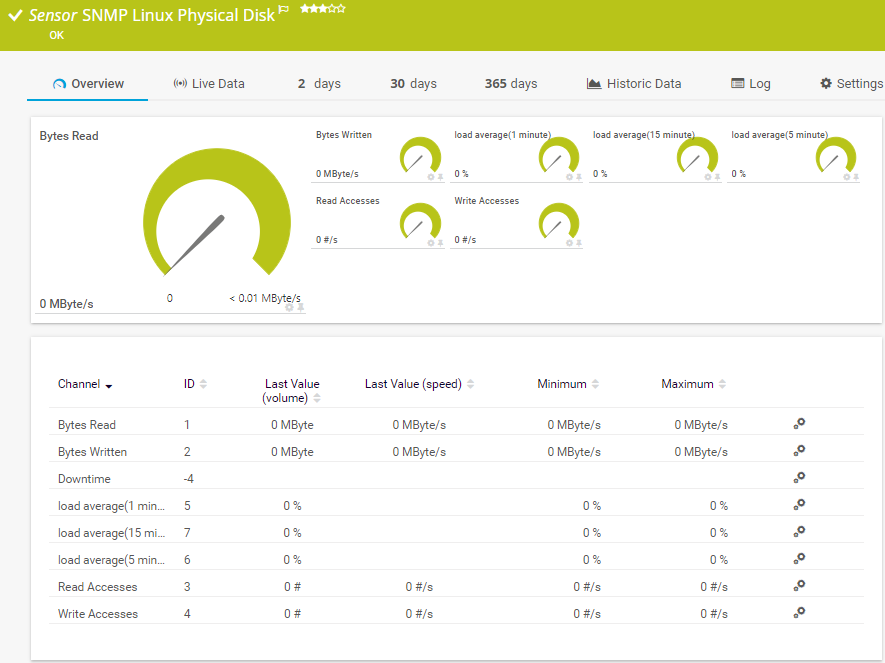
The SNMP Linux Physical Disk sensor monitors the input/output (I/O) on disks of a Linux/Unix system. It can show the following:
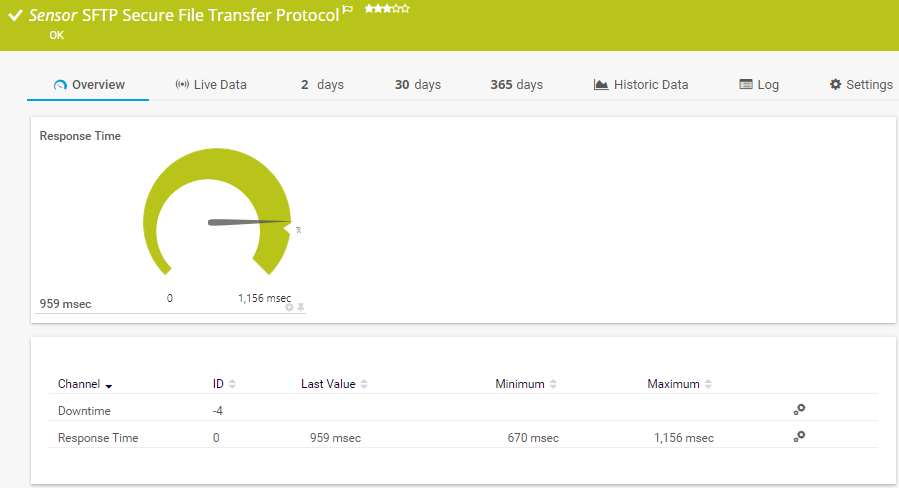
The SFTP Secure File Transfer Protocol sensor monitors File Transfer Protocol (FTP) servers of a Linux/Unix system via the Secure Shell (SSH) File Transfer Protocol (FTP over SSH). It can show the following:
See the PRTG Manual for a list of all available sensor types.

Custom alerts and data visualization let you quickly identify and prevent performance issues on Windows, Linux, macOS, and other UNIX-based and proprietary operating systems.
PRTG is set up in a matter of minutes and can be used on a wide variety of mobile devices.

Partnering with innovative IT vendors, Paessler unleashes synergies to create
new and additional benefits for joined customers.
Combining PRTG’s broad monitoring feature set with IP Fabric’s automated network assurance creates a new level of network visibility and reliability.
Paessler and Plixer provide a complete solution adding flow and metadata analysis to a powerful network monitoring tool.
With ScriptRunner Paessler integrates a powerful event automation platform into PRTG Network Monitor.
Real-time notifications mean faster troubleshooting so that you can act before more serious issues occur.
Network Monitoring Software – Version 26.1.116.1532 (February 9th, 2026)
Download for Windows and cloud-based version PRTG Hosted Monitor available
English, German, Spanish, French, Portuguese, Dutch, Russian, Japanese, and Simplified Chinese
Network devices, bandwidth, servers, applications, virtual environments, remote systems, IoT, and more
Choose the PRTG Network Monitor subscription that's best for you


An operating system (OS) is software that manages the hardware and software resources of a computer or device. It acts as an intermediary between users and the computer hardware. The primary functions of an operating system include:
Examples of operating systems include Windows, macOS, Linux, and Android. Each of these systems is designed to handle the specific needs of different types of devices, from personal computers to smartphones and servers.
Monitoring operating systems is crucial for several reasons, especially in environments where reliability, security, and performance are essential. Here’s why you should monitor operating systems:
Performance optimization
Security
Reliability and availability
Troubleshooting
User experience
PRTG officially supports the following Windows versions:
We've successfully tested our SSH and SNMP sensors on the following operating systems:
Our sensors may also work well on other distributions (though we haven't specifically tested them). SNMP sensors work on most operating systems.
Yes and no. The central PRTG server can only be installed on a Windows server. But, once you've installed the PRTG server, you can use the brand-new multi-platform probe (a remote probe type in PRTG) that also runs on Linux. With this probe, you can monitor and manage your complete IT infrastructure from your Linux system.
In PRTG, “sensors” are the basic monitoring elements. One sensor usually monitors one measured value in your network, for example the traffic of a switch port, the CPU load of a server, or the free space on a disk drive. On average, you need about 5-10 sensors per device or one sensor per switch port.
Paessler conducted trials in over 600 IT departments worldwide to tune its network monitoring software closer to the needs of sysadmins. The result of the survey: over 95% of the participants would recommend PRTG – or already have.

Paessler PRTG is used by companies of all sizes. Sysadmins love PRTG because it makes their job a whole lot easier.
Bandwidth, servers, virtual environments, websites, VoIP services – PRTG keeps an eye on your entire network.
Everyone has different monitoring needs. That’s why we let you try PRTG for free.