Custom alerts and data visualization let you quickly identify and prevent network traffic and bandwidth issues.
In an ideal world, you want your network to run smoothly, efficiently, and securely. One way to make this happen? Monitor the traffic on your routers, switches, and firewalls with one of Paessler PRTG’s flow-based monitoring technologies, leveraging the IPFIX protocol.
If you are in no mood for complicated configuration work, PRTG has got you covered.
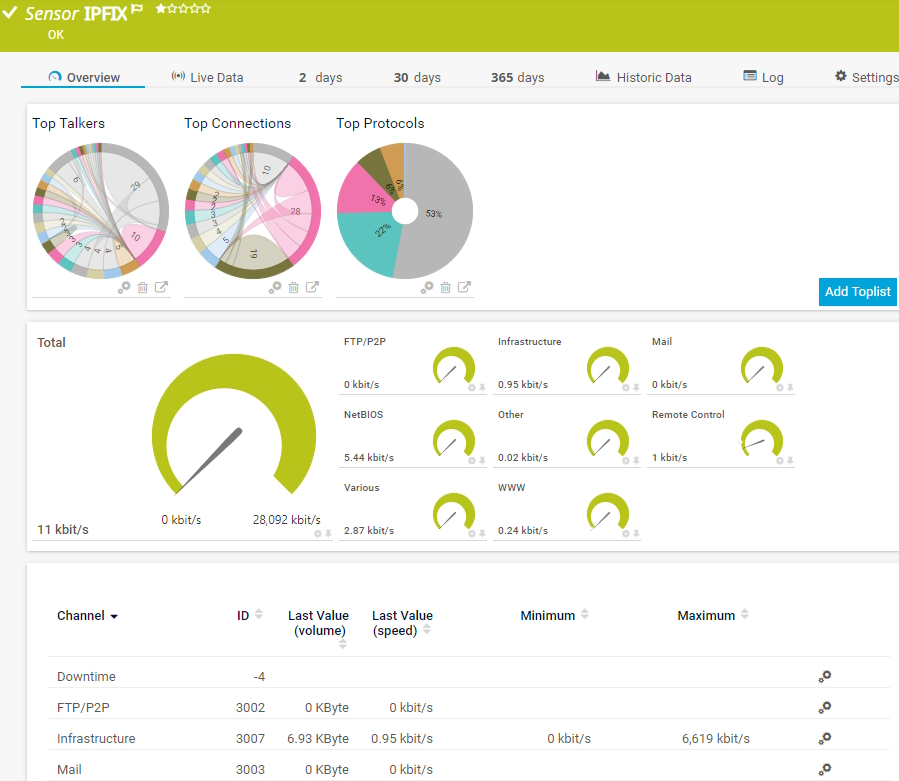
Our preconfigured IPFIX sensor, which you can add to your monitoring setup in just a few clicks, captures IPFIX flow information from the device you want to monitor and shows you the top talkers, connections, and protocols in your network, next to other metrics.
Use our IPFIX monitoring tool to track traffic patterns, bandwidth usage, and more to ensure optimal network efficiency.
PRTG helps you to quickly pinpoint and address issues like an overloaded network – for example, due to backups or excessively high bandwidth consumption – even before they escalate.
Optimize your network's performance by leveraging PRTG’s powerful IPFIX reporting capabilities. PRTG provides you with a wealth of historical data for in-depth IPFIX traffic analysis.
This way, you can make informed decisions on bandwidth resource allocation or other actions that make your network faster and more reliable.
Secure your network against threats by keeping tabs on suspicious network traffic using IPFIX.
With PRTG, you can stay on top of network anomalies like unusually high bandwidth usage or heavily used connections, which might point to unauthorized access or DDoS and other network attacks.
Diagnose network issues with continuous network traffic monitoring on your network devices using IPFIX. Show bandwidth usage of specific network flows and other key metrics in real time. Visualize monitoring data in clear graphs and dashboards to identify problems more easily. Gain the overview you need to troubleshoot network performance.

Device tree view of the complete monitoring setup

Custom PRTG dashboard for keeping an eye on the entire IT infrastructure

Live traffic data graph in PRTG
“All-around winning
network monitor”
“The real beauty of PRTG is the endless possibilities it offers”
“PRTG Network Monitor
is very hard to beat”
PRTG comes with more than 250 native sensor types for monitoring your entire on-premises, cloud, and hybrid cloud environment out of the box. Check out some examples below!
The IPFIX sensor receives traffic data from an Internet Protocol Flow Information Export (IPFIX) compatible device and shows traffic by type. It can show the following and more:
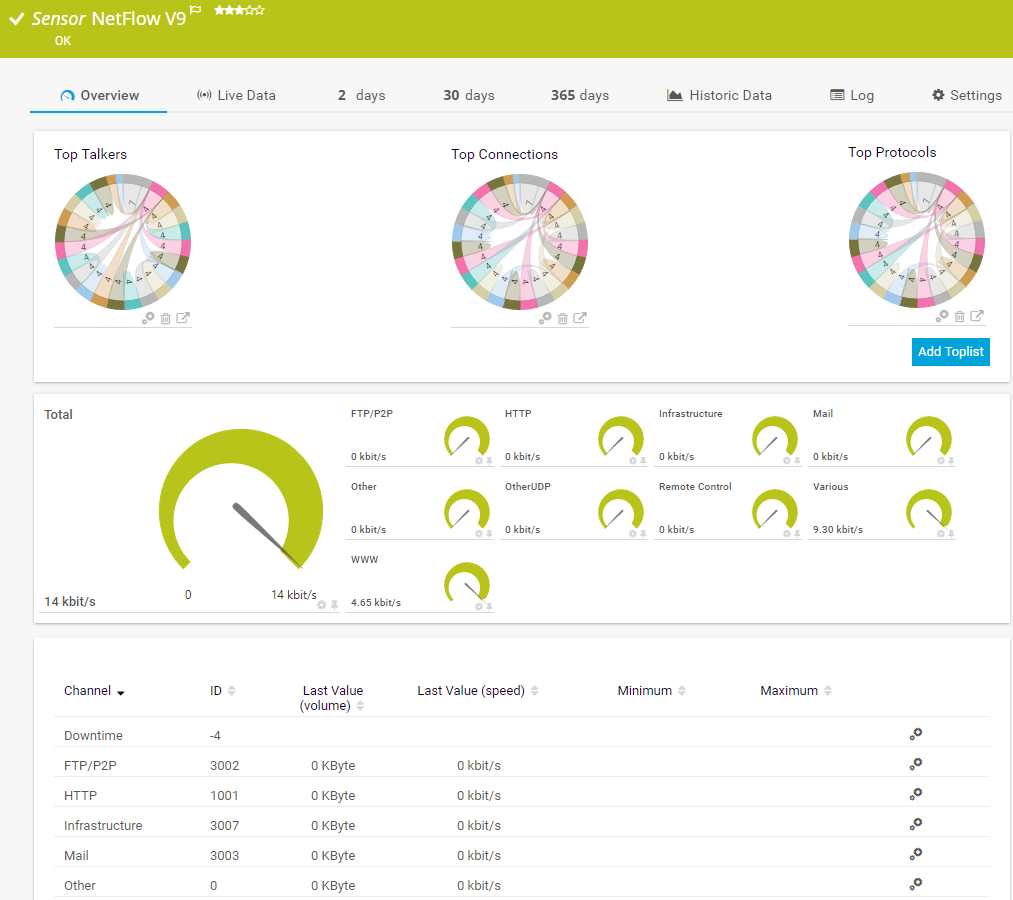
The NetFlow v9 sensor receives traffic data from a NetFlow v9-compatible device and shows the traffic by type. This sensor has several filter options to divide traffic into different channels. It can show the following and more:
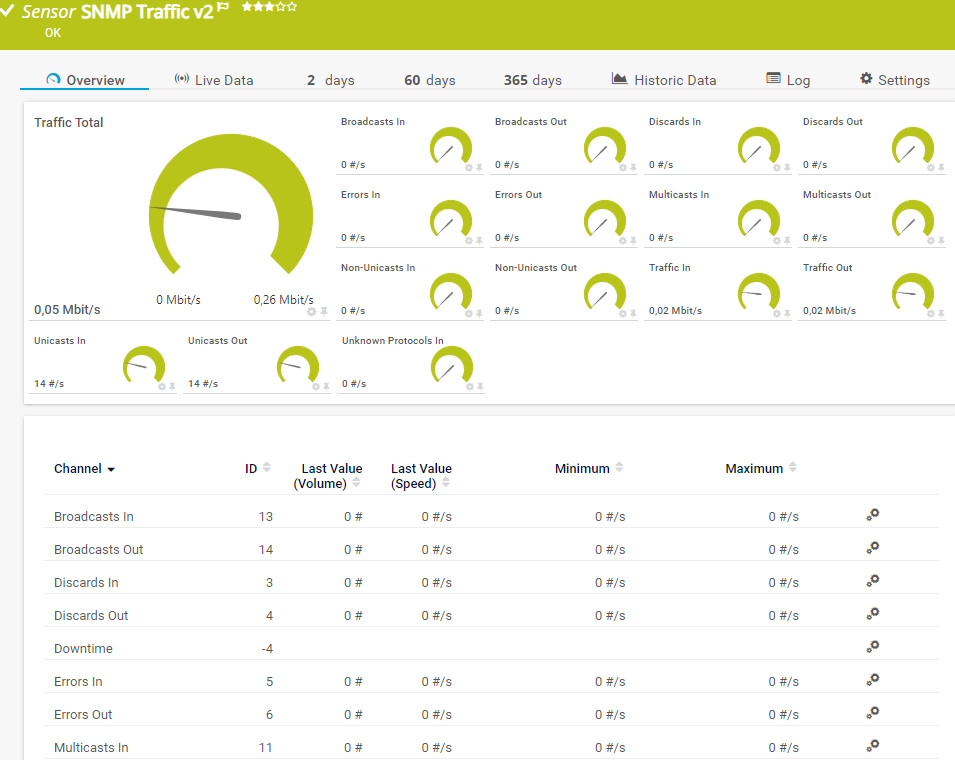
The SNMP Traffic v2 sensor monitors bandwidth and traffic on a device. It can show the following:
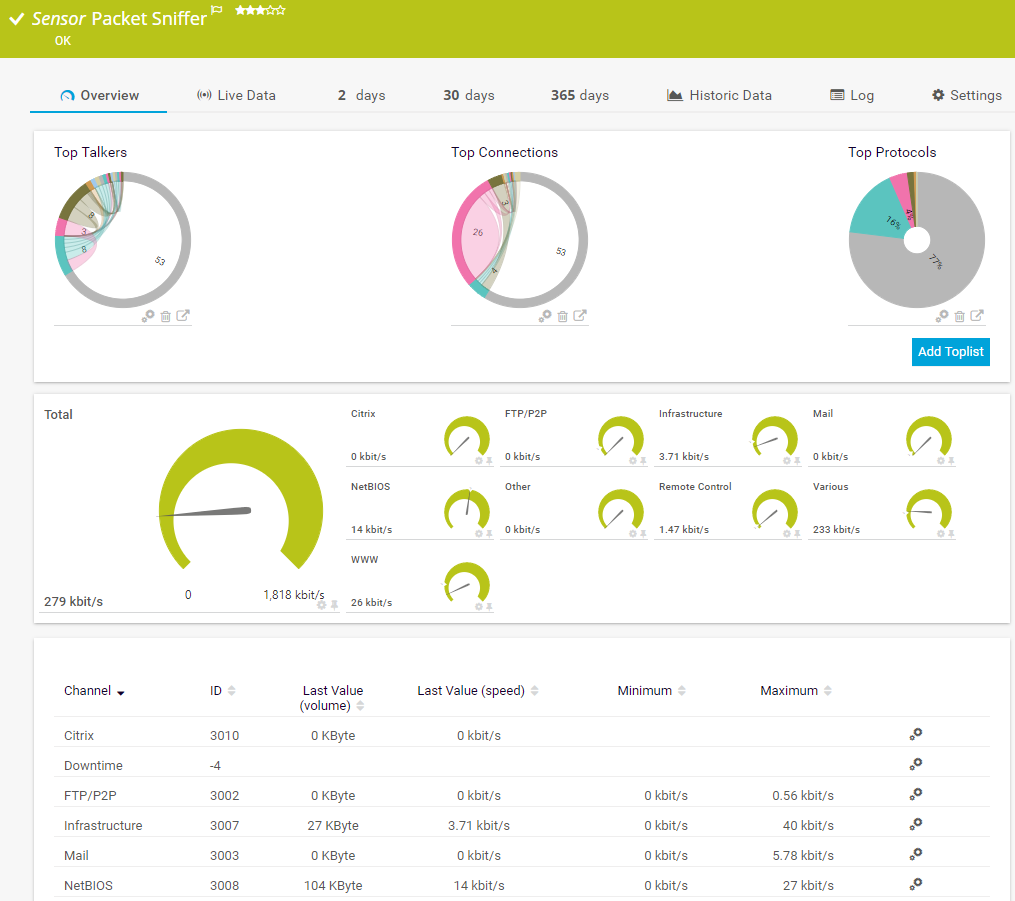
The Packet Sniffer sensor monitors the headers of data packets that pass a local network card using a built-in packet sniffer. You can choose from predefined channels. It can show the following and more:
See the PRTG Manual for a list of all available sensor types.

Custom alerts and data visualization let you quickly identify and prevent network traffic and bandwidth issues.
PRTG is set up in a matter of minutes and can be used on a wide variety of mobile devices.


“Excellent tool for detailed monitoring. Alarms and notifications work greatly. Equipment addition is straight forward and server initial setup is very easy. ...feel safe to purchase it if you intend to monitor a large networking landscape.”
Partnering with innovative IT vendors, Paessler unleashes synergies to create
new and additional benefits for joined customers.
baramundi and PRTG create a secure, reliable and powerful IT infrastructure where you have everything under control - from the traffic in your firewall to the configuration of your clients.
With the combination of PRTG and Insys, the monitoring specialist Paessler and the industrial gateway manufacturer INSYS icom offer a practical possibility to merge IT and OT.
Siemon and Paessler bring together intelligent building technology and advanced monitoring and make your vision of intelligent buildings and data centers become reality.
Real-time notifications mean faster troubleshooting so that you can act before more serious issues occur.
Network Monitoring Software – Version 26.1.116.1532 (February 9th, 2026)
Download for Windows and cloud-based version PRTG Hosted Monitor available
English, German, Spanish, French, Portuguese, Dutch, Russian, Japanese, and Simplified Chinese
Network devices, bandwidth, servers, applications, virtual environments, remote systems, IoT, and more
Choose the PRTG Network Monitor subscription that's best for you

IPFIX, or IP Flow Information Export, is a format standard established by the Internet Engineering Task Force (IETF) for sending flow information. It evolves from Cisco's NetFlow system and outlines how to format and transmit IP flow data sets to a collector or analyzer for such information. IPFIX monitoring provides detailed insights into traffic flow, device performance, and network utilization.
IPFIX operates as a push protocol, continuously forwarding a variety of monitoring data to tools like PRTG. This includes diverse traffic types, encompassing everything from chat and file transfer activities to email and web traffic, also using other protocols like UDP and TCP. With PRTG’s performance monitoring capabilities, you can filter traffic by source and destination IP address, port, and protocol to identify the top talkers and top connections in your network.
IPFIX gathers data from your network devices, such as routers and switches, and forwards this information to an IPFIX collector. In the context of network monitoring, PRTG acts as an IPFIX analyzer, analyzing and visualizing this data to help you oversee your network traffic.
While NetFlow is a Cisco-originated protocol and works best with their devices, IPFIX is essentially an advanced version of NetFlow v9, sometimes referred to as NetFlow v10. Unlike NetFlow, IPFIX is designed to be universal and manufacturer-neutral, making it adaptable for various network devices.
An IPFIX collector is software that captures, processes, and presents IPFIX data. The same goes for IPFIX viewers. An IPFIX analyzer like PRTG goes deeper and looks at IPFIX flow data in more detail, displaying, for example, the bandwidth usage of each respective flow.
IPFIX generally uses port 4739. It's important to keep this port open during setup. Additionally, PRTG can also function as a port monitoring tool, helping you oversee bandwidth, traffic, connections, and the status of specific TCP ports.
As not all devices support IPFIX, check what protocols your hardware supports. PRTG enables you to use other flow technologies like NetFlow (v5 and v9), packet sniffing for packet capture and detailed packet header analysis, or SNMP as alternative technologies for monitoring your network traffic.
In PRTG, “sensors” are the basic monitoring elements. One sensor usually monitors one measured value in your network, for example the traffic of a switch port, the CPU load of a server, or the free space on a disk drive. On average, you need about 5-10 sensors per device or one sensor per switch port.
Paessler conducted trials in over 600 IT departments worldwide to tune its network monitoring software closer to the needs of sysadmins. The result of the survey: over 95% of the participants would recommend PRTG – or already have.

Paessler PRTG is used by companies of all sizes. Sysadmins love PRTG because it makes their job a whole lot easier.
Bandwidth, servers, virtual environments, websites, VoIP services – PRTG keeps an eye on your entire network.
Everyone has different monitoring needs. That’s why we let you try PRTG for free.