Custom alerts and data visualization let you quickly identify downtime of your firewalls and prevent cybersecurity threats.
Diagnose network issues by continuously tracking and analyzing firewall devices and logs. Show firewall traffic, CPU and memory usage, uptime, bandwidth monitoring stats, user authentication info, firewall changes, and other key metrics in real time. Visualize monitoring data in clear graphs and dashboards to identify problems more easily. Gain the overview you need to troubleshoot all kinds of issues with firewall security and network performance.

Device tree view of the complete monitoring setup

Custom PRTG dashboard for keeping an eye on the entire IT infrastructure

Live traffic data graph in PRTG
“All-around winning
network monitor”
“The real beauty of PRTG is the endless possibilities it offers”
“PRTG Network Monitor
is very hard to beat”
PRTG includes native sensors for NetFlow, sFlow, and jFlow to get detailed information about the traffic on your firewalls – sorted by IP address, port, and protocol.
But even if your device does not support flow monitoring, PRTG includes the SNMP Traffic v2 sensor and the Packet Sniffer sensor to get the information you need.
Our two built-in sensors for monitoring FortiGate firewalls include the FortiGate VPN Overview sensor, which helps you track your SNMP Cisco ASA VPN Connections.
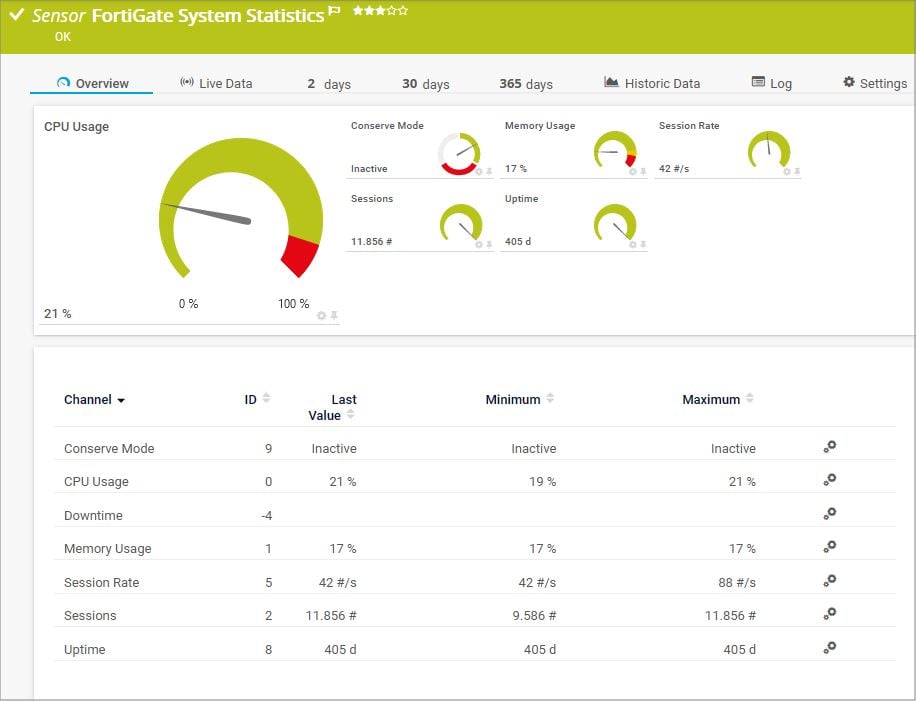
The FortiGate System Statistics sensor can, for example, determine if the device is in "conserve" mode, a self-protection measure that is activated when the system detects memory shortage.
PRTG also comes with two built-in sensors for monitoring SonicWall devices. The SNMP SonicWall System Health sensor helps you keep an eye on the overall health of your firewall.
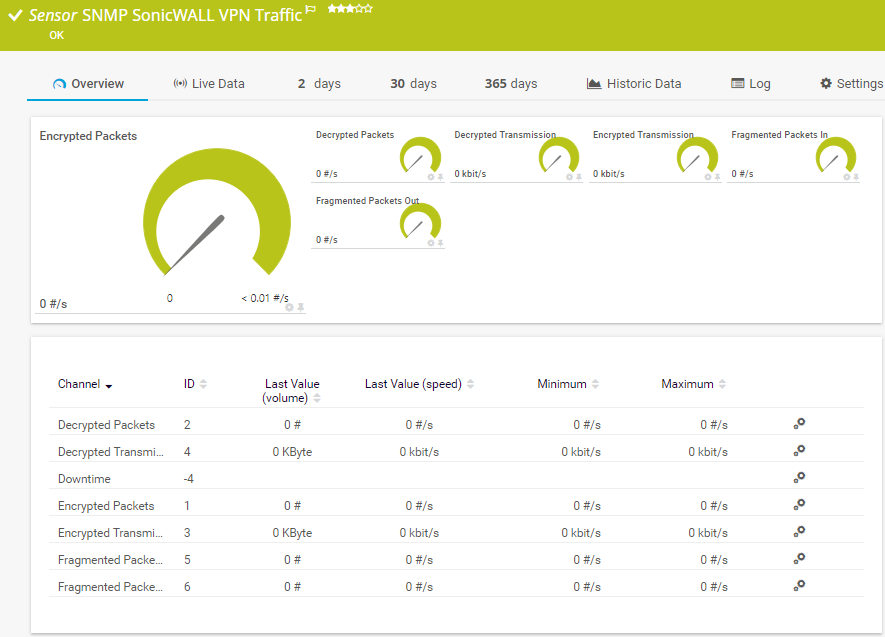
The SNMP SonicWall VPN Traffic sensor gives you an overview of the IPsec VPN traffic on your SonicWall device such as the number of encrypted and decrypted packets per second.
PRTG notifies you immediately if your firewall is down so you can quickly determine the cause of the interruption and how to get the firewall back up.
You can also customize alerts for different escalation scenarios. Define granular notification triggers, and choose to be notified via email, SMS, push notification, Teams message, and more.
PRTG comes with more than 250 native sensor types for monitoring your entire on-premises, cloud, and hybrid cloud environment out of the box. Check out some examples below!
The FortiGate System Statistics sensor monitors the system health of a Fortinet FortiGate firewall. It can show the following:
The SNMP SonicWall VPN Traffic sensor monitors the traffic of an Internet Protocol Security (IPsec) VPN on a SonicWall Network Security Appliance (NSA) . It can show the following:
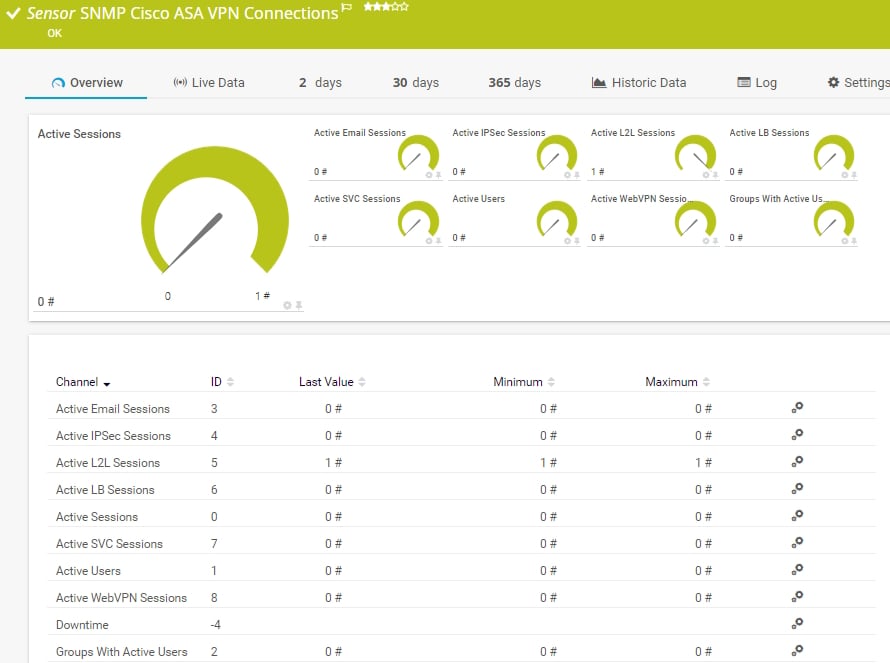
The SNMP Cisco ASA VPN Connections sensor monitors the VPN connections on a Cisco Adaptive Security Appliance. It can show the following:
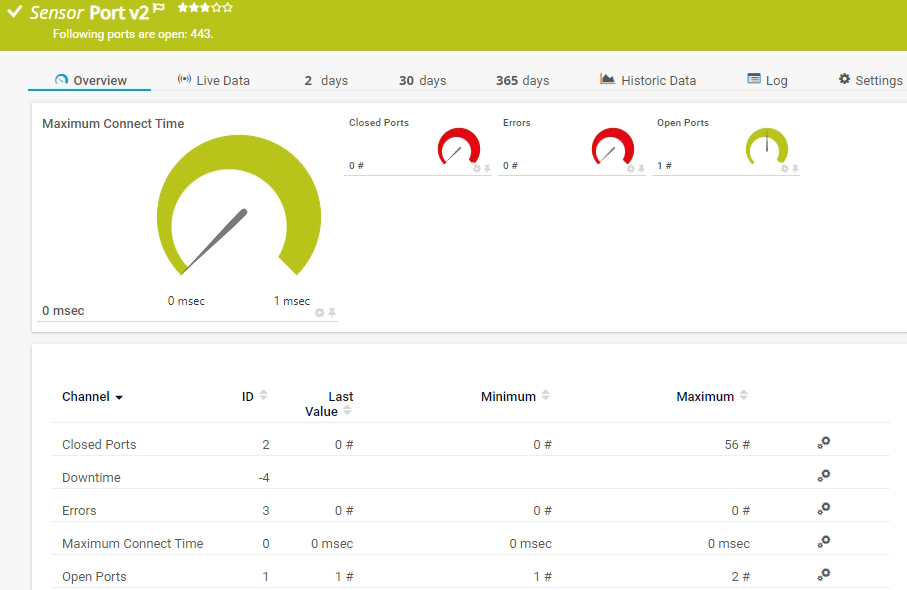
The Port v2 sensor monitors a network service by connecting to one or more of its TCP/IP ports. It can show the following:
See the PRTG Manual for a list of all available sensor types.

Custom alerts and data visualization let you quickly identify downtime of your firewalls and prevent cybersecurity threats.
PRTG is set up in a matter of minutes and can be used on a wide variety of mobile devices.


“Excellent tool for detailed monitoring. Alarms and notifications work greatly. Equipment addition is straight forward and server initial setup is very easy. ...feel safe to purchase it if you intend to monitor a large networking landscape.”
Partnering with innovative IT vendors, Paessler unleashes synergies to create
new and additional benefits for joined customers.
By integrating PRTG with Martello iQ, you can add a fast analytics layer to improve uptime, visualize your IT environment, and integrate all of your IT systems into a single pane of glass.
Integrating monitoring results from PRTG into NetBrain maps makes the foundation for network automation.
Siemon and Paessler bring together intelligent building technology and advanced monitoring and make your vision of intelligent buildings and data centers become reality.
Real-time notifications mean faster troubleshooting so that you can act before more serious issues occur.
Network Monitoring Software – Version 26.1.116.1532 (February 9th, 2026)
Download for Windows and cloud-based version PRTG Hosted Monitor available
English, German, Spanish, French, Portuguese, Dutch, Russian, Japanese, and Simplified Chinese
Network devices, bandwidth, servers, applications, virtual environments, remote systems, IoT, and more
Choose the PRTG Network Monitor subscription that's best for you


A firewall analyzer is a tool that can help you gather information about the health, status, and performance of your network firewalls. With a firewall analysis software, you can not only check if your firewalls are up or down, but also get insights like unusual network activity, users and connections that need a lot of bandwidth, the most used protocols, and more. They are helpful to ensure your firewall policy and security policy are met at all times.
For more than 30 years, firewalls have been one of the main security devices available to sysadmins to secure their networks, devices, users, and sensitive information. They not only protect against DDoS and intrusion attacks by malicious parties, avoiding service interruptions that can paralyze the company, but also help avoid the theft of data and other security threats.
In the wrong hands, information like company figures and future plans can have unforeseeable business consequences. And with legislation like the GDPR in Europe, the leakage of customer records can result in heavy fines and legal repercussions, both for the companies and even the executives in charge.
Therefore, it is all the more important that your firewalls work without interruption and that you keep an eye on your firewalls at all times using a firewall analyzer tool like PRTG to monitor traffic and user behavior to detect, prevent, and mitigate threats and support your company’s compliance management.
There are different reasons why monitoring & analyzing firewalls is important, for example:
There are 5 main features you need to look out for when choosing a firewall analyzer solution. With PRTG, you can have all of them:
PRTG’s flexible subscription licensing makes it easy to scale up or down as needed. You pay only for the number of sensors you need. After your 30-day free trial of the unlimited version of PRTG, you can still use the free version with 100 free sensors. Review our pricing
In PRTG, “sensors” are the basic monitoring elements. One sensor usually monitors one measured value in your network, for example the traffic of a switch port, the CPU load of a server, or the free space on a disk drive. On average, you need about 5-10 sensors per device or one sensor per switch port.
Paessler conducted trials in over 600 IT departments worldwide to tune its network monitoring software closer to the needs of sysadmins. The result of the survey: over 95% of the participants would recommend PRTG – or already have.

Paessler PRTG is used by companies of all sizes. Sysadmins love PRTG because it makes their job a whole lot easier.
Bandwidth, servers, virtual environments, websites, VoIP services – PRTG keeps an eye on your entire network.
Everyone has different monitoring needs. That’s why we let you try PRTG for free.