Custom alerts and data visualization let you quickly identify and prevent health, performance, and network security issues.
In the intricate web of modern networks, having a detailed understanding of your traffic is crucial for both performance and security. Paessler PRTG stands out as a network protocol analyzer by offering comprehensive visibility and control over your network traffic, ensuring your infrastructure operates seamlessly and securely while maintaining your sanity.
PRTG network protocol analyzer goes beyond surface-level monitoring by offering deep packet inspection and flow monitoring capabilities. This advanced protocol analysis lets you peel the layers back on your network traffic in real time, providing insights into bandwidth usage, traffic sources, and potential security threats.
It takes very few clicks to get to the center of your traffic stops. With support for popular flow protocols such as NetFlow, sFlow, jFlow, and IPFIX, PRTG makes it easy to capture and analyze data packets across your network, ensuring no detail goes unnoticed.
Flexibility is key in network management, and PRTG offers unparalleled customization for protocol analysis. Tailor your monitoring setup like a new suit, with specific sensors for the protocols you use most, and adjust alert thresholds to match your network’s traffic patterns.
This customization ensures you're always the first to know about potential issues, allowing swift responses to maintain network integrity and performance.
PRTG simplifies the complex task of network protocol analysis by providing a single, unified endpoint for all your monitoring needs. Eliminate the need for multiple tools with PRTG's all-encompassing approach, reducing compatibility issues and security vulnerabilities.
Moreover, PRTG's secure architecture, including encrypted communications, ensures your network data remains safe and confidential.
With PRTG network protocol analyzer, empower your network with the ability to monitor using a wide range of protocols, ensuring comprehensive coverage and deep insights.
From HTTP to SNMP and FTP, and from WMI to TCP/UDP to SSH, our packet sniffer and protocol analyzer software shines by providing detailed analytics that help you optimize performance, troubleshoot issues, and secure your network against threats.
Diagnose network issues by continuously tracking network traffic in your ethernet-based LAN or wireless network using different protocols. Show traffic data patterns, bandwidth usage, captured data packets, and other key performance metrics in real time. Visualize the monitoring data your network protocol analyzer provides in clear graphs and dashboards to identify problems more easily. Gain the overview you need to troubleshoot and debug issues with network packet capture, irregular traffic behavior, and bandwidth bottlenecks.

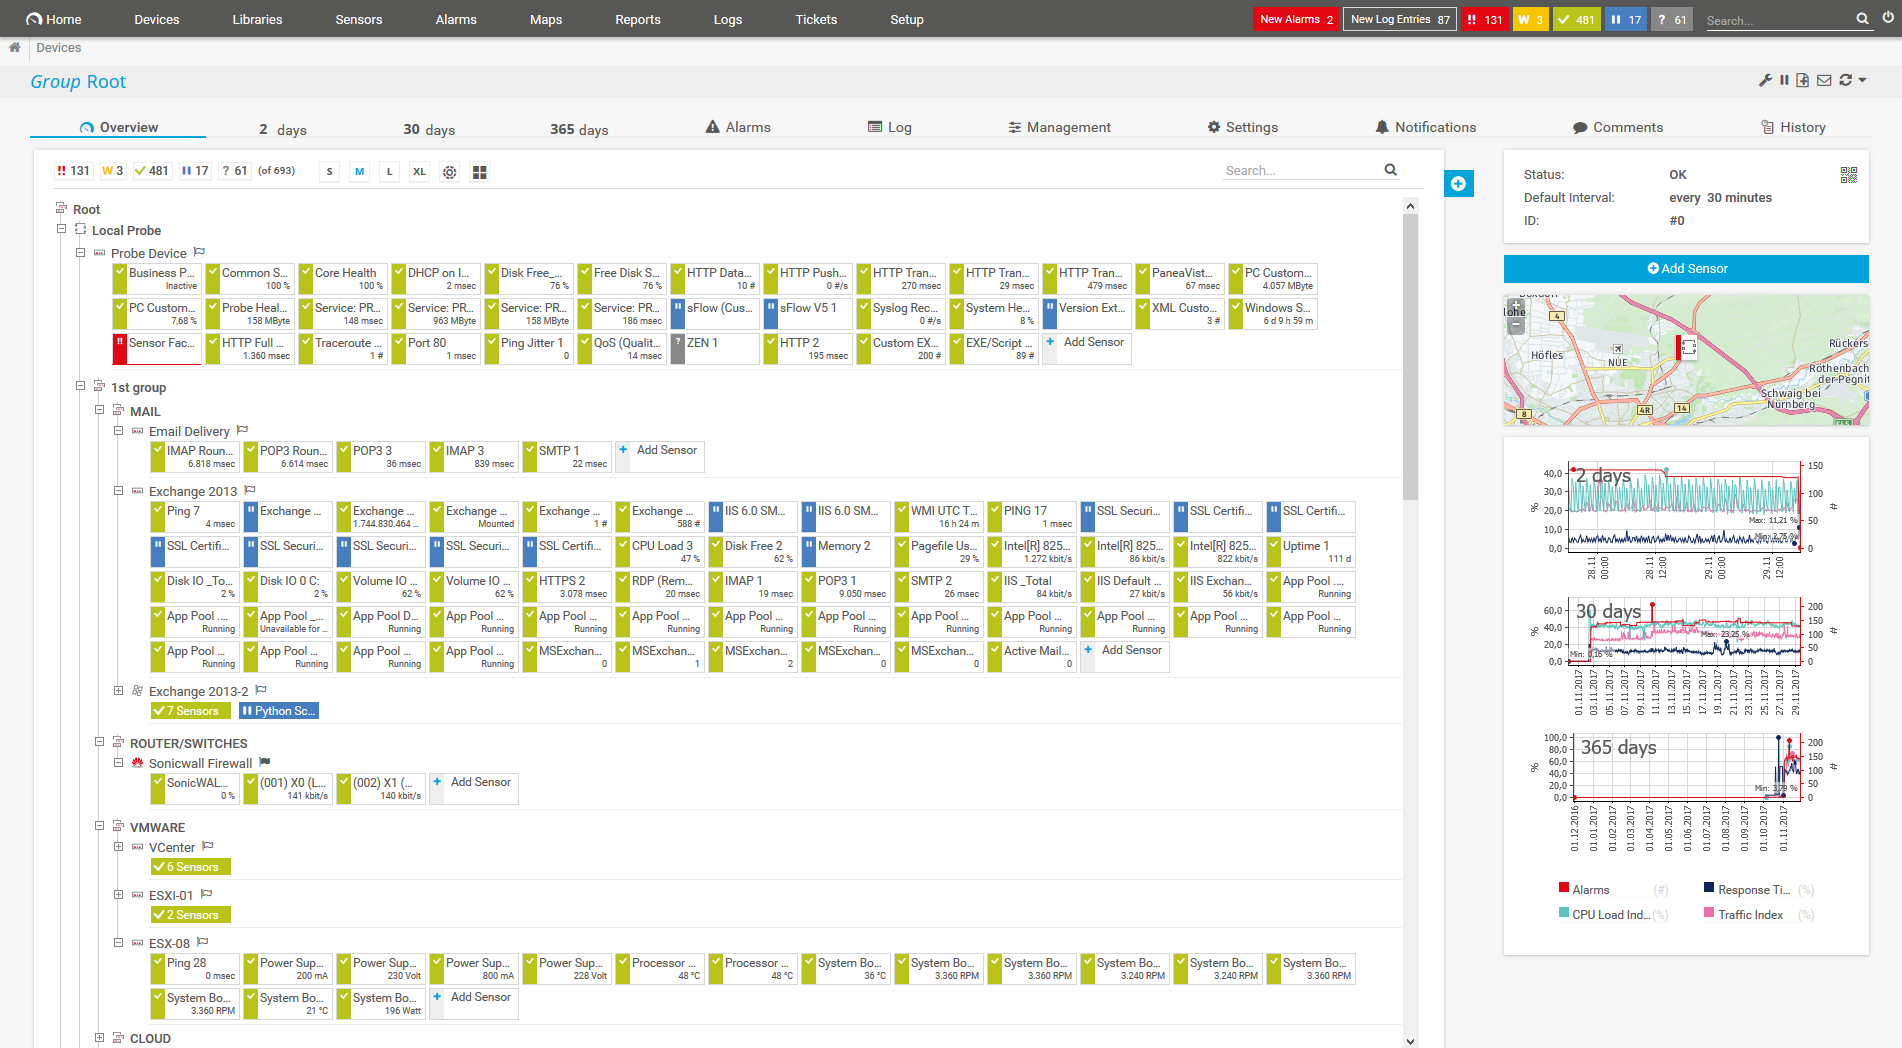
Device tree view of the complete monitoring setup

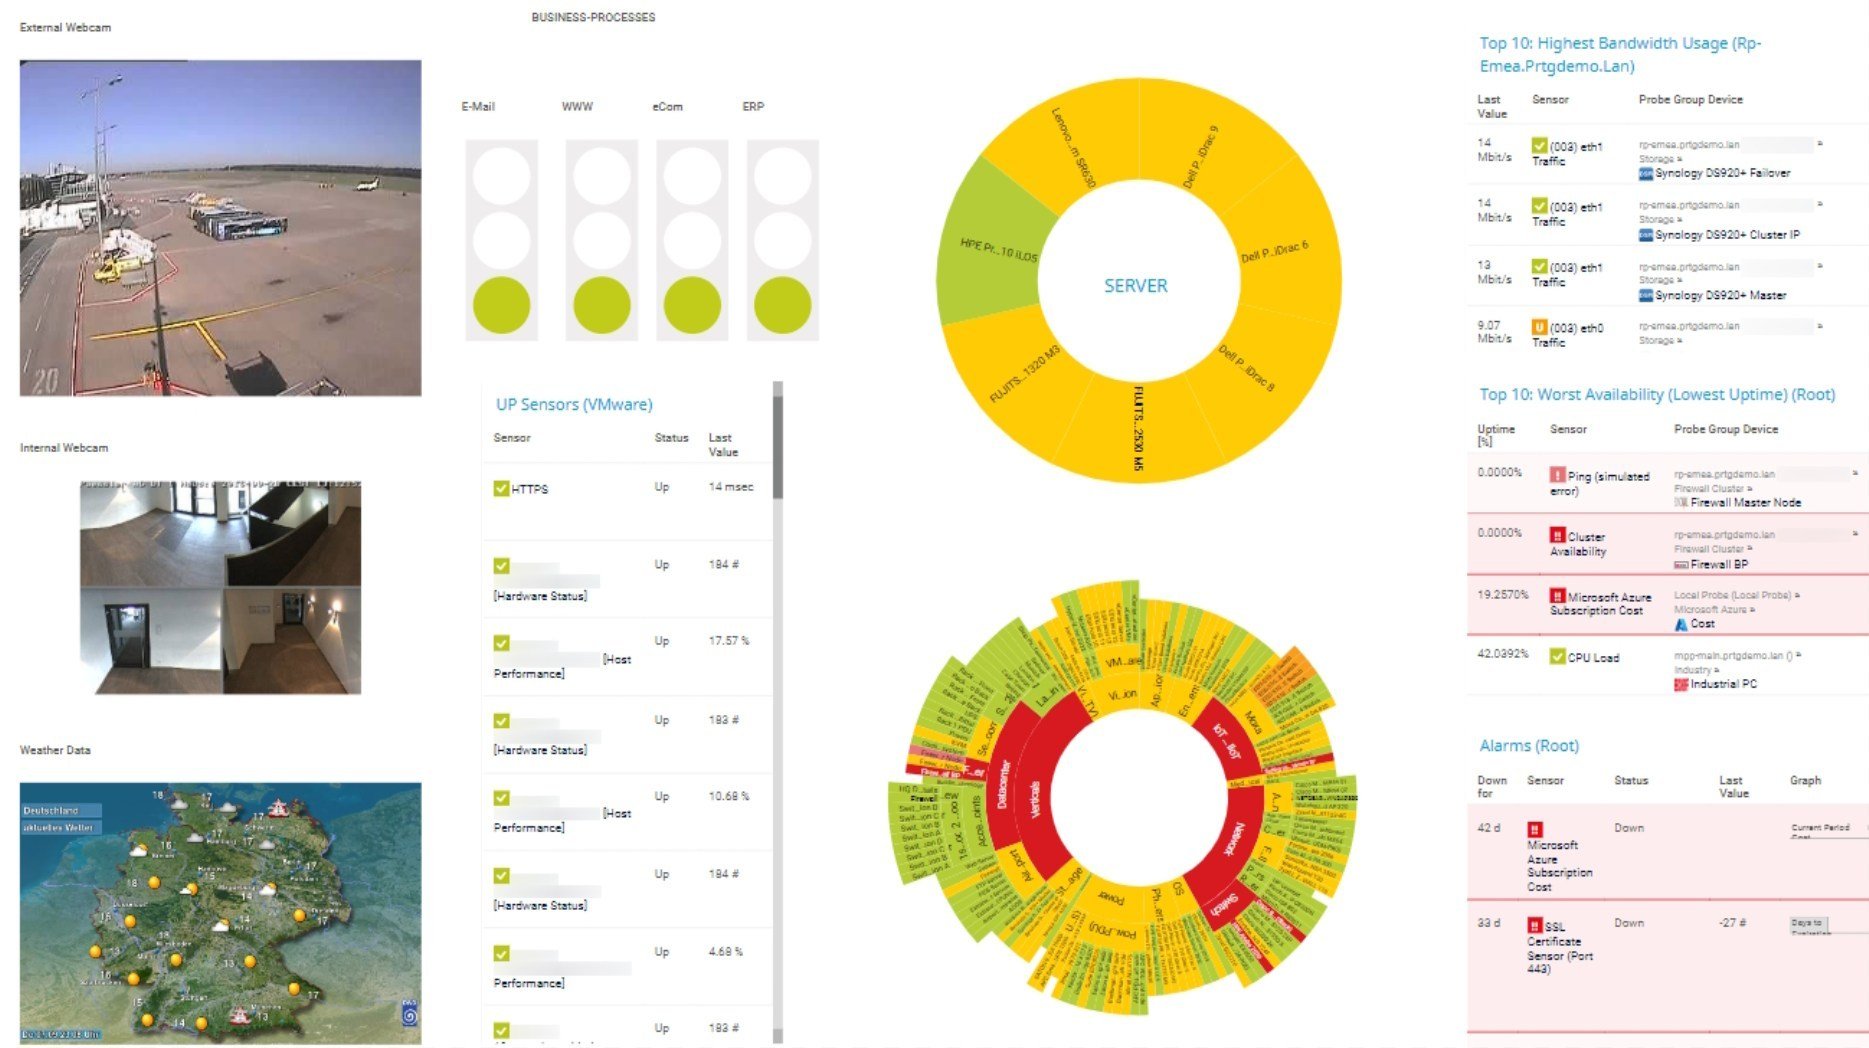
Custom PRTG dashboard for keeping an eye on the entire IT infrastructure

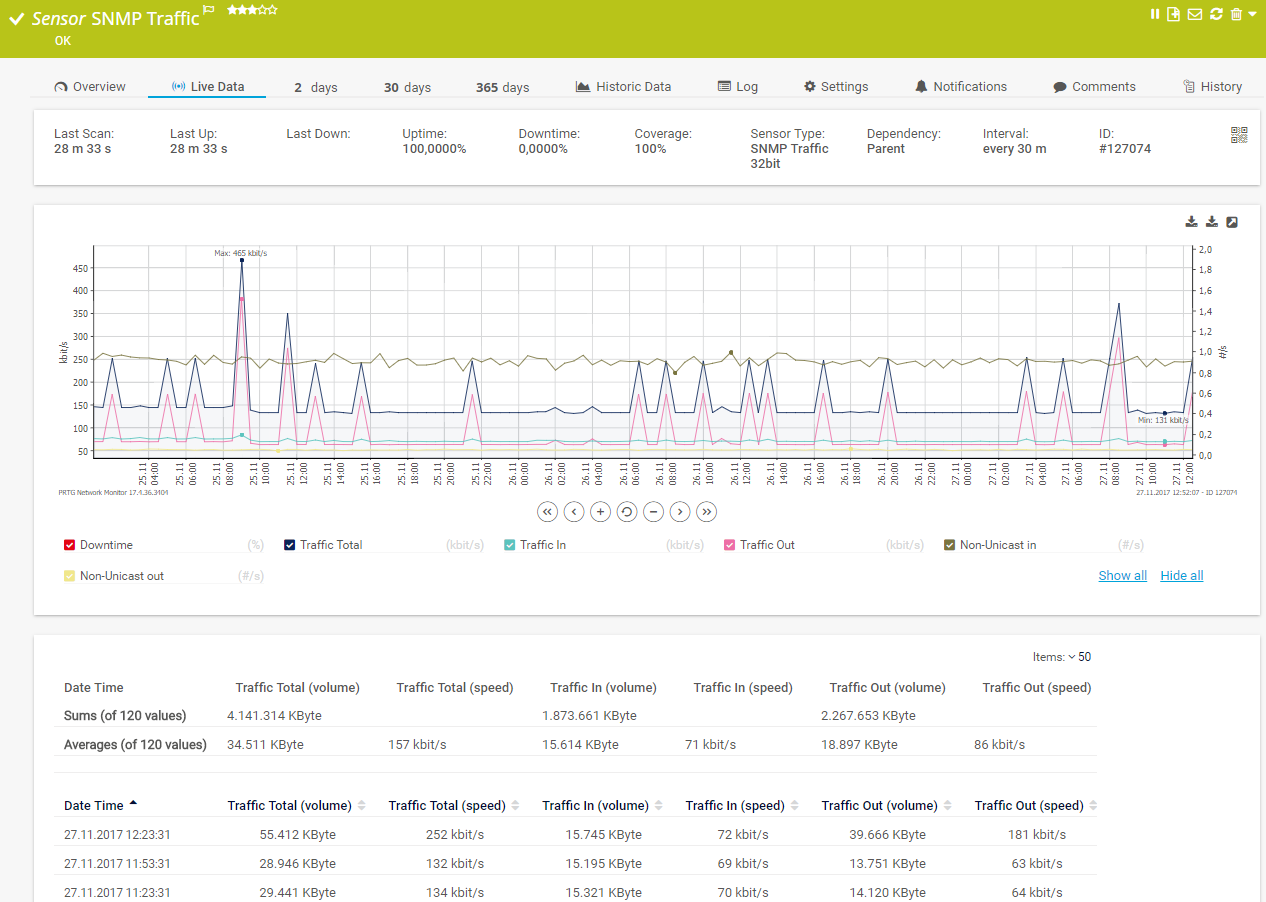
Live traffic data graph in PRTG
PRTG comes with more than 250 native sensor types for monitoring your entire on-premises, cloud, and hybrid cloud environment out of the box. Check out some examples below!
See the PRTG Manual for a list of all available sensor types.
Custom alerts and data visualization let you quickly identify and prevent health, performance, and network security issues.
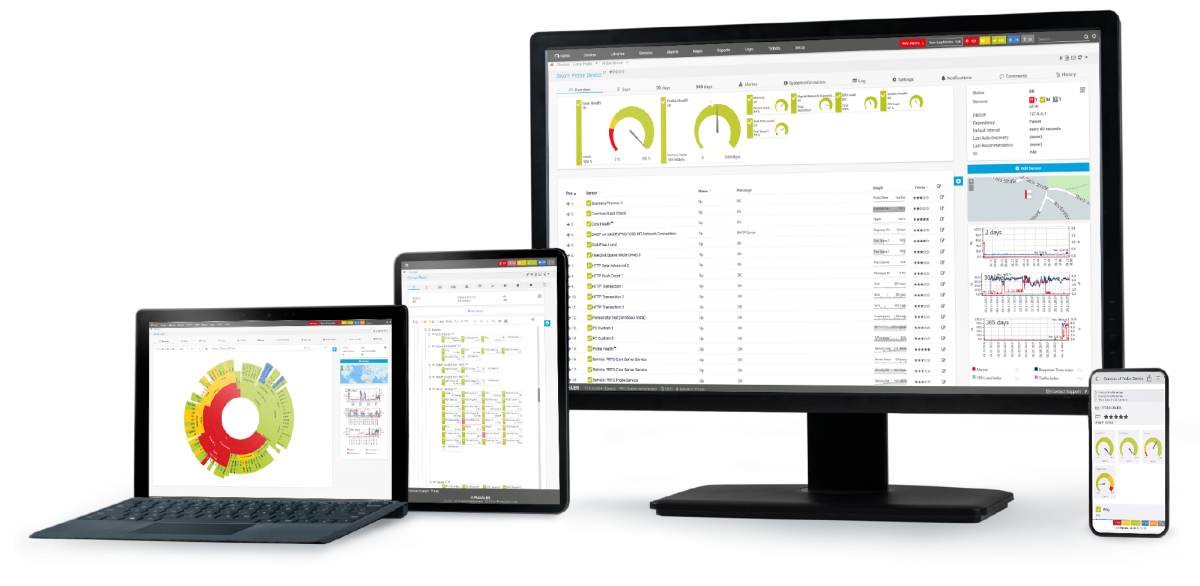
Set up PRTG in minutes and use it on almost any mobile device.

“Excellent tool for detailed monitoring. Alarms and notifications work greatly. Equipment addition is straight forward and server initial setup is very easy. ...feel safe to purchase it if you intend to monitor a large networking landscape.”
Partnering with innovative IT vendors, Paessler unleashes synergies to create
new and additional benefits for joined customers.
Integrating monitoring results from PRTG into NetBrain maps makes the foundation for network automation.
Paessler and Plixer provide a complete solution adding flow and metadata analysis to a powerful network monitoring tool.
UVexplorer integrates tightly with PRTG to bring fast and accurate network discovery, detailed device inventory, and automatic network mapping to the PRTG platform.
Real-time notifications mean faster troubleshooting so that you can act before more serious issues occur.
Network Monitoring Software – Version 25.3.110.1313 (August 27, 2025)
Download for Windows and cloud-based version PRTG Hosted Monitor available
English, German, Spanish, French, Portuguese, Dutch, Russian, Japanese, and Simplified Chinese
Network devices, bandwidth, servers, applications, virtual environments, remote systems, IoT, and more
Choose the PRTG Network Monitor subscription that's best for you
A network protocol analyzer (also protocol analysis tool, traffic analyzer, packet analyzer, or packet analysis tool) is software that you can use to record and analyze data traffic in a network. In concrete terms, this means that the network traffic is broken down according to various parameters. The data flows are then displayed in diagrams and tables for analysis.
PRTG includes protocol analysis functionalities to track and analyze using packet sniffing, as well as different flow protocols. Network traffic is categorized by connection, IP address, and by protocol.
In the context of flow monitoring, the term “flow” refers to the flow of data packets between two endpoints, such as devices or applications. Recording the data flow is mostly done by exporting the flow data of a device (for example a router, firewall, or switch). In addition, a data collector is required. Its task is to log the data so that it can be analyzed later.
PRTG network protocol analyzer offers several preconfigured sensors for collecting, analyzing, and monitoring flow data.
PRTG incorporates flow monitoring technologies like NetFlow, sFlow, and jFlow in its protocol analysis toolkit. This allows for the in-depth examination of network traffic patterns, helping to identify the types of traffic and protocols being used, as well as pinpointing sources of high bandwidth consumption. Flow monitoring is essential for understanding how data moves through your network and for identifying potential security threats or inefficiencies.
Yes, while PRTG network protocol analyzer respects encryption by not decrypting content, it analyzes encrypted traffic flow data to provide insights on bandwidth usage, communication patterns, and source/destination metrics. This level of analysis is critical for managing network performance and security, even when the traffic content remains private.
PRTG network protocol analyzer offers extensive customization options for protocol and flow analysis, including the ability to set specific sensors and filters for monitoring particular protocols or traffic types. This flexibility ensures that network administrators can focus on the traffic that matters most to their organization's security and performance goals.
Leveraging protocol analysis and flow data, PRTG can detect anomalies by comparing current traffic patterns against historical baselines. This capability of our network protocol analyzer allows for the early detection of unusual activities, such as spikes in bandwidth usage or the emergence of unfamiliar protocols, which could indicate security concerns or network issues.
Indeed, PRTG's flow monitoring capabilities extend to both internal network traffic and external Internet-bound traffic. This ensures comprehensive visibility into all data flows, enabling effective management and security oversight across the entire network infrastructure.
In PRTG, “sensors” are the basic monitoring elements. One sensor usually monitors one measured value in your network, for example the traffic of a switch port, the CPU load of a server, or the free space on a disk drive. On average, you need about 5-10 sensors per device or one sensor per switch port.
Paessler conducted trials in over 600 IT departments worldwide to tune its network monitoring software closer to the needs of sysadmins. The result of the survey: over 95% of the participants would recommend PRTG – or already have.
Paessler PRTG is used by companies of all sizes. Sysadmins love PRTG because it makes their job a whole lot easier.
Bandwidth, servers, virtual environments, websites, VoIP services – PRTG keeps an eye on your entire network.
Everyone has different monitoring needs. That’s why we let you try PRTG for free.