• Company
    • About Us
    • Case Studies
    • Press Center
    • Careers
    • Blog
    • Contact us
  • Contact us
  • Login
 
  • English
    • Deutsch
    • Español
    • Français
    • Italiano
    • Português
Paessler
                    - The Monitoring Experts
  • Products
    • Paessler PRTG
      Paessler PRTGMonitor your whole IT infrastructure
      • PRTG Network Monitor
      • PRTG Enterprise Monitor
      • PRTG Hosted Monitor
      • PRTG UVexplorer
      • PRTG extensionsExtensions for Paessler PRTGExtend your monitoring to a new level
    • Icon Features
      FeaturesExplore all monitoring features
      • Maps & dashboards
      • Alerts & notifications
      • Multiple user interfaces
      • Distributed monitoring
      • Customizable reporting
  • Solutions
    • By TeamFor your organization size
      • Small Business IT
      • Mid-Market IT
      • Enterprise IT
      • MSP Network Monitoring
    • Industries
      By IndustryFor your business sector
      • Industrial
      • Healthcare
      • Government
      • Education
      • Data Center
      • Finance
    • IT Topics
      By Use CaseFor every technical scenario
      • Network Monitoring
      • Server Monitoring
      • OT Monitoring
      • Distributed Monitoring
      • Network Topology Mapping
      • SNMP Monitoring
      • Bandwidth Monitoring
  • Pricing
  • Resources
    • Getting Started
      Getting StartedModules for self-paced learning
    • How-to Guides
      How-to GuidesGet the most out of PRTG
    • Videos & Webinars
      Videos & WebinarsLearn from Paessler experts
    • IT  Knowledge
      IT KnowledgeExpand your IT knowledge
    • PRTG Manual
      PRTG ManualFull documentation
    • Knowledge Base
      Knowledge BaseShare community knowledge
    • PRTG Sensor Hub
      PRTG Sensor HubGet sensors, scripts & templates
    • Trainings
      PRTG TrainingLearn how to work with PRTG
  • Partners
    • Icon Handshake
      Become a PartnerFor resellers and channel partners
    • Icon MSP
      Become an MSPDeliver monitoring as a managed service
    • icon partner
      Partner PortalLog in to your partner account
    • Deal Registration
      Deal RegistrationRegister your sales opportunities
    • icon search
      Find a PartnerFind partners selling Paessler products
    • icon technology
      Technology AlliancesSee Paessler technology partnerships
    • Partner HubTools for Your Success
  • Company
    • About Us
    • Case Studies
    • Press Center
    • Careers
    • Blog
    • Contact us
  • Contact us
  • Login
  • English
    • Deutsch
    • Español
    • Français
    • Italiano
    • Português
  • Get a quote
  • Free trial

Proactive Anomaly Detection Monitoring

PRTG monitors continuously. When behavior deviates from what's normal, you find out before it becomes an outage.

Free download
PRODUCT OVERVIEW

How do you detect network anomalies before they cause downtime?  

Effective anomaly detection monitoring doesn't run on a single method. Threshold alerts catch what you anticipated when you configured them. Everything else needs historical comparison to surface: metrics that drift without hitting a hard limit, gradual behavioral shifts that look fine on any given day. The combination of both layers is what separates reactive alerting from actual anomaly visibility. 

PRTG covers both. Fixed thresholds are active from day one. The Unusual Detection layer compares current sensor values against a sufficiently long historical baseline (typically several weeks), flagging deviations from established normal behavior that static limits wouldn't catch. When a sensor's behavior shifts, the device tree shows a visual indicator and the historical graph marks the point where the deviation started. Supported technologies: NetFlow, jFlow, sFlow, IPFIX, SNMP, WMI, Packet Sniffer, SSL/TLS, TCP/IP, WMI Security Center, Cloud Ping.

Download PRTG Trial

What you will find on this page

  • Detect Anomalies with PRTG
  • How to Monitor Anomalies
  • Anomaly Detection: Manual vs. PRTG
  • FAQs

PRTG is compatible with all major vendors, products, and systems

compatible with all major vendors, products, and systems

How PRTG Helps You Stay Ahead of Infrastructure Issues

Know when something deviates from normal, not just when it hits a limit

Unusual Detection doesn't replace threshold alerting. It covers what thresholds structurally can't. A fixed limit catches a value when it crosses the line you drew, but it won't catch a server that's been trending warmer for two weeks or a switch generating slightly more network traffic than last week. Those data points pass through unnoticed. PRTG compares each sensor's current values against its own established baseline, flags the deviation with an Unusual status in the device tree, and shows you in the historical graph exactly when the shift started.

  • Flags deviations from each sensor's own established normal data patterns, not from a manually defined limit
  • Works across any sensor type: performance, network traffic, availability
  • Visual indicator appears in the device tree when behavior shifts from the sensor's norm
  • The historical graph shows when the deviation started. That's the part that matters for tracking down what changed.
  • No manual threshold definition needed for this detection layer

See exactly what's driving a traffic spike, not just that one happened

Flow data doesn't just tell you traffic is elevated. When you open a Toplist view, you see the top sources, connections, and protocols driving that traffic for any time window you configure. That's root cause data, not another summary metric to act on. Filter in real time by port, address, or application and you're looking at what actually matters, not everything at once. 

  • Toplist views surface top traffic sources, connections, and protocols the moment you need them
  • Filter by port, address, or application to isolate the anomaly. No manual log review.
  • Devices without flow protocol support aren't excluded. The Packet Sniffer monitors packet headers directly on the local interface as a fallback, useful for outlier detection when flow data isn't available.
  • Works for devices with and without flow protocol support
  • Reduces the manual effort involved in tracing bandwidth-related incidents
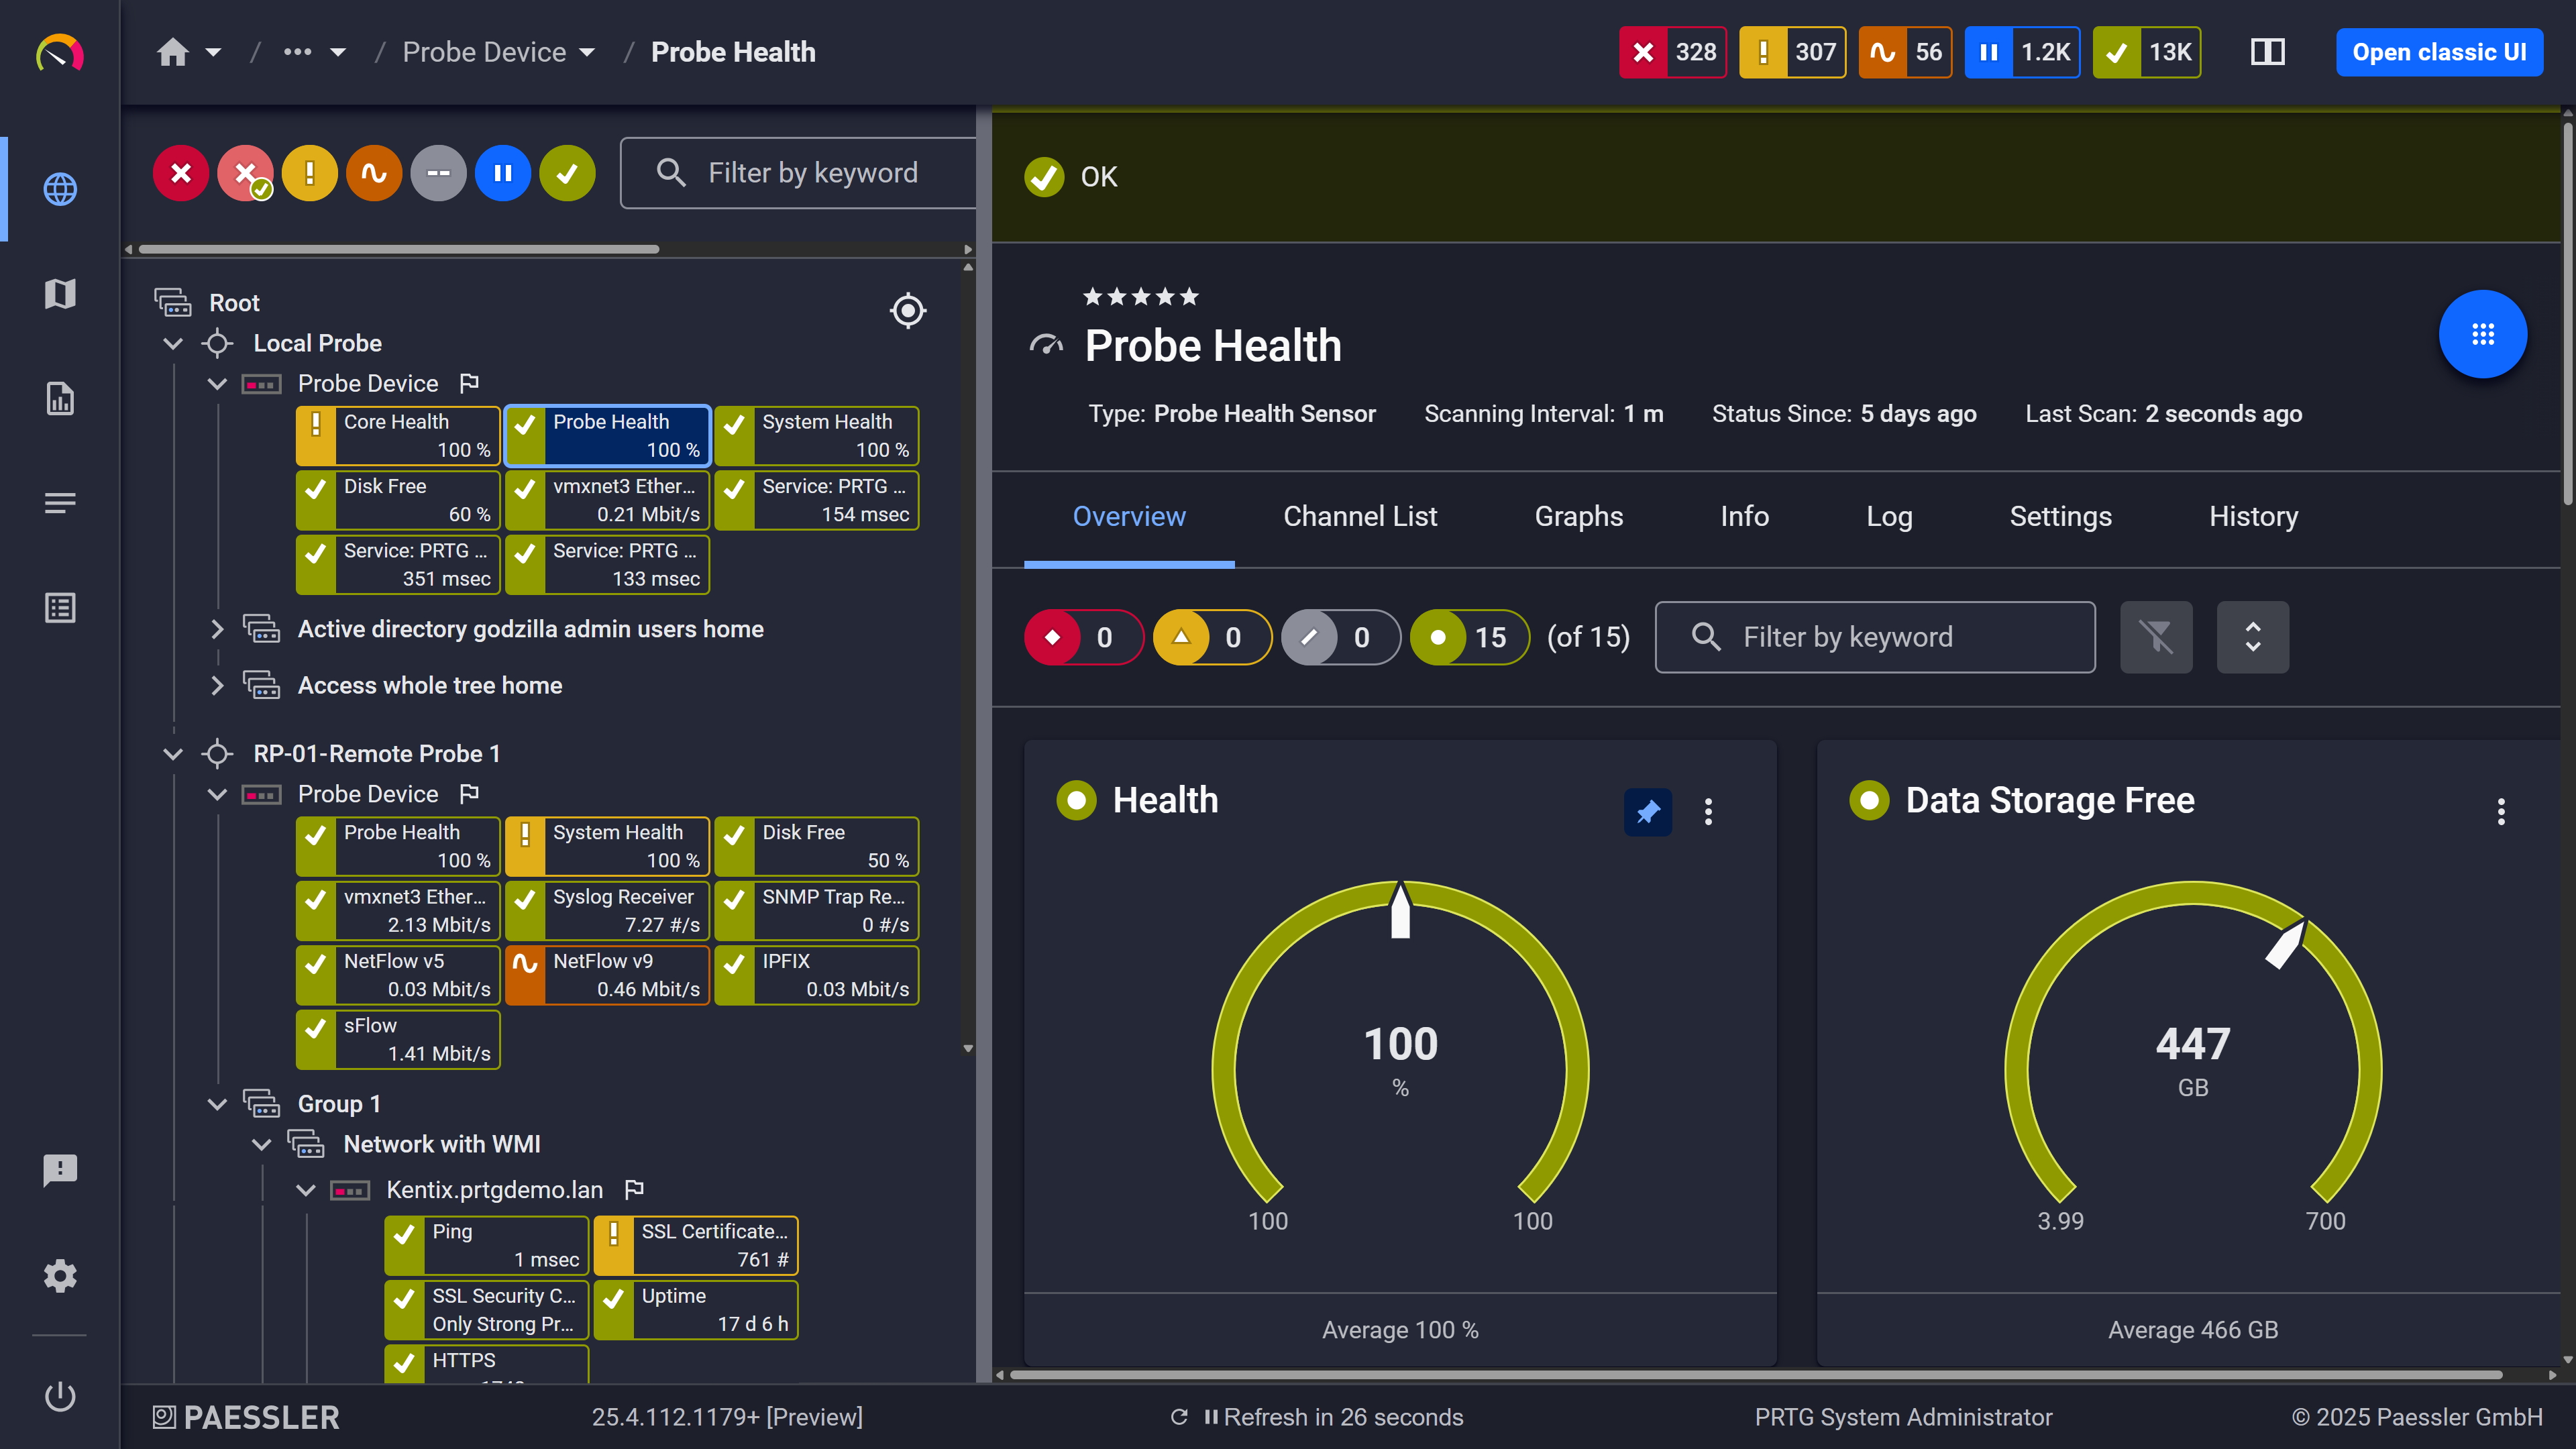
PRTG web interface showing live performance graphs for a Probe Health sensor

Live graphs, real-time performance data
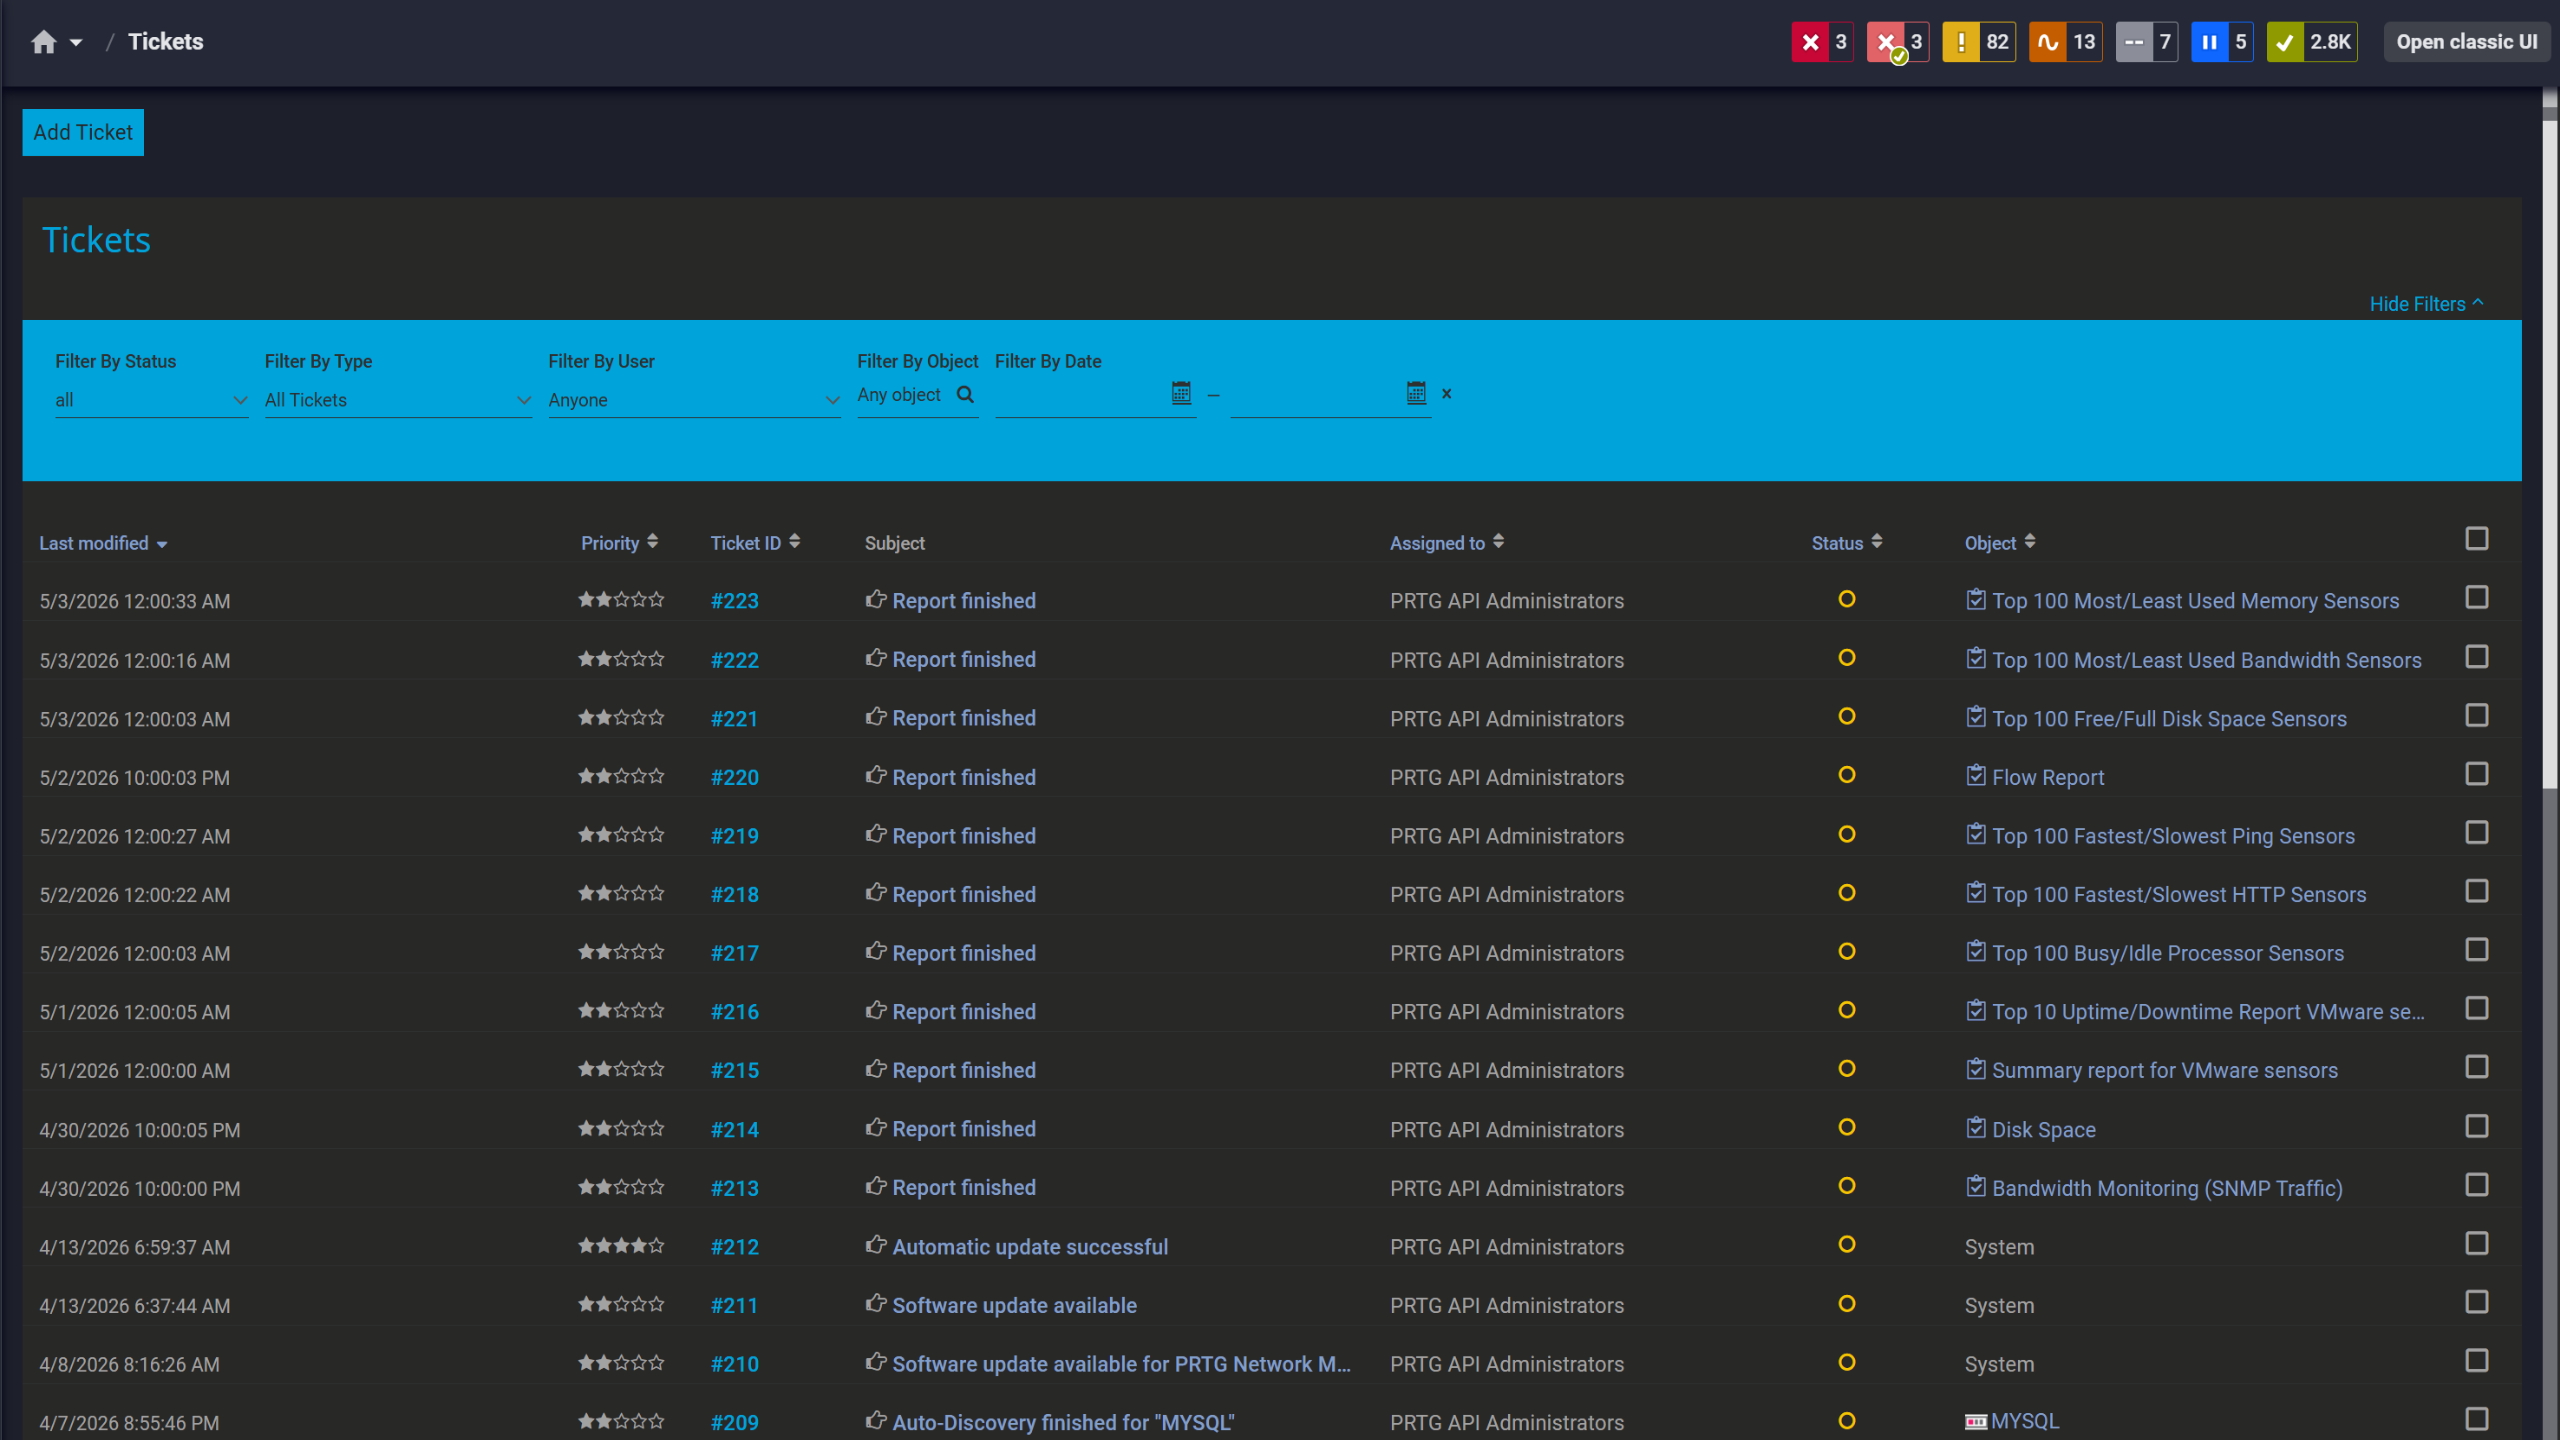
PRTG tickets list showing system notifications, report completions, and update alerts

Tickets keep your team aligned

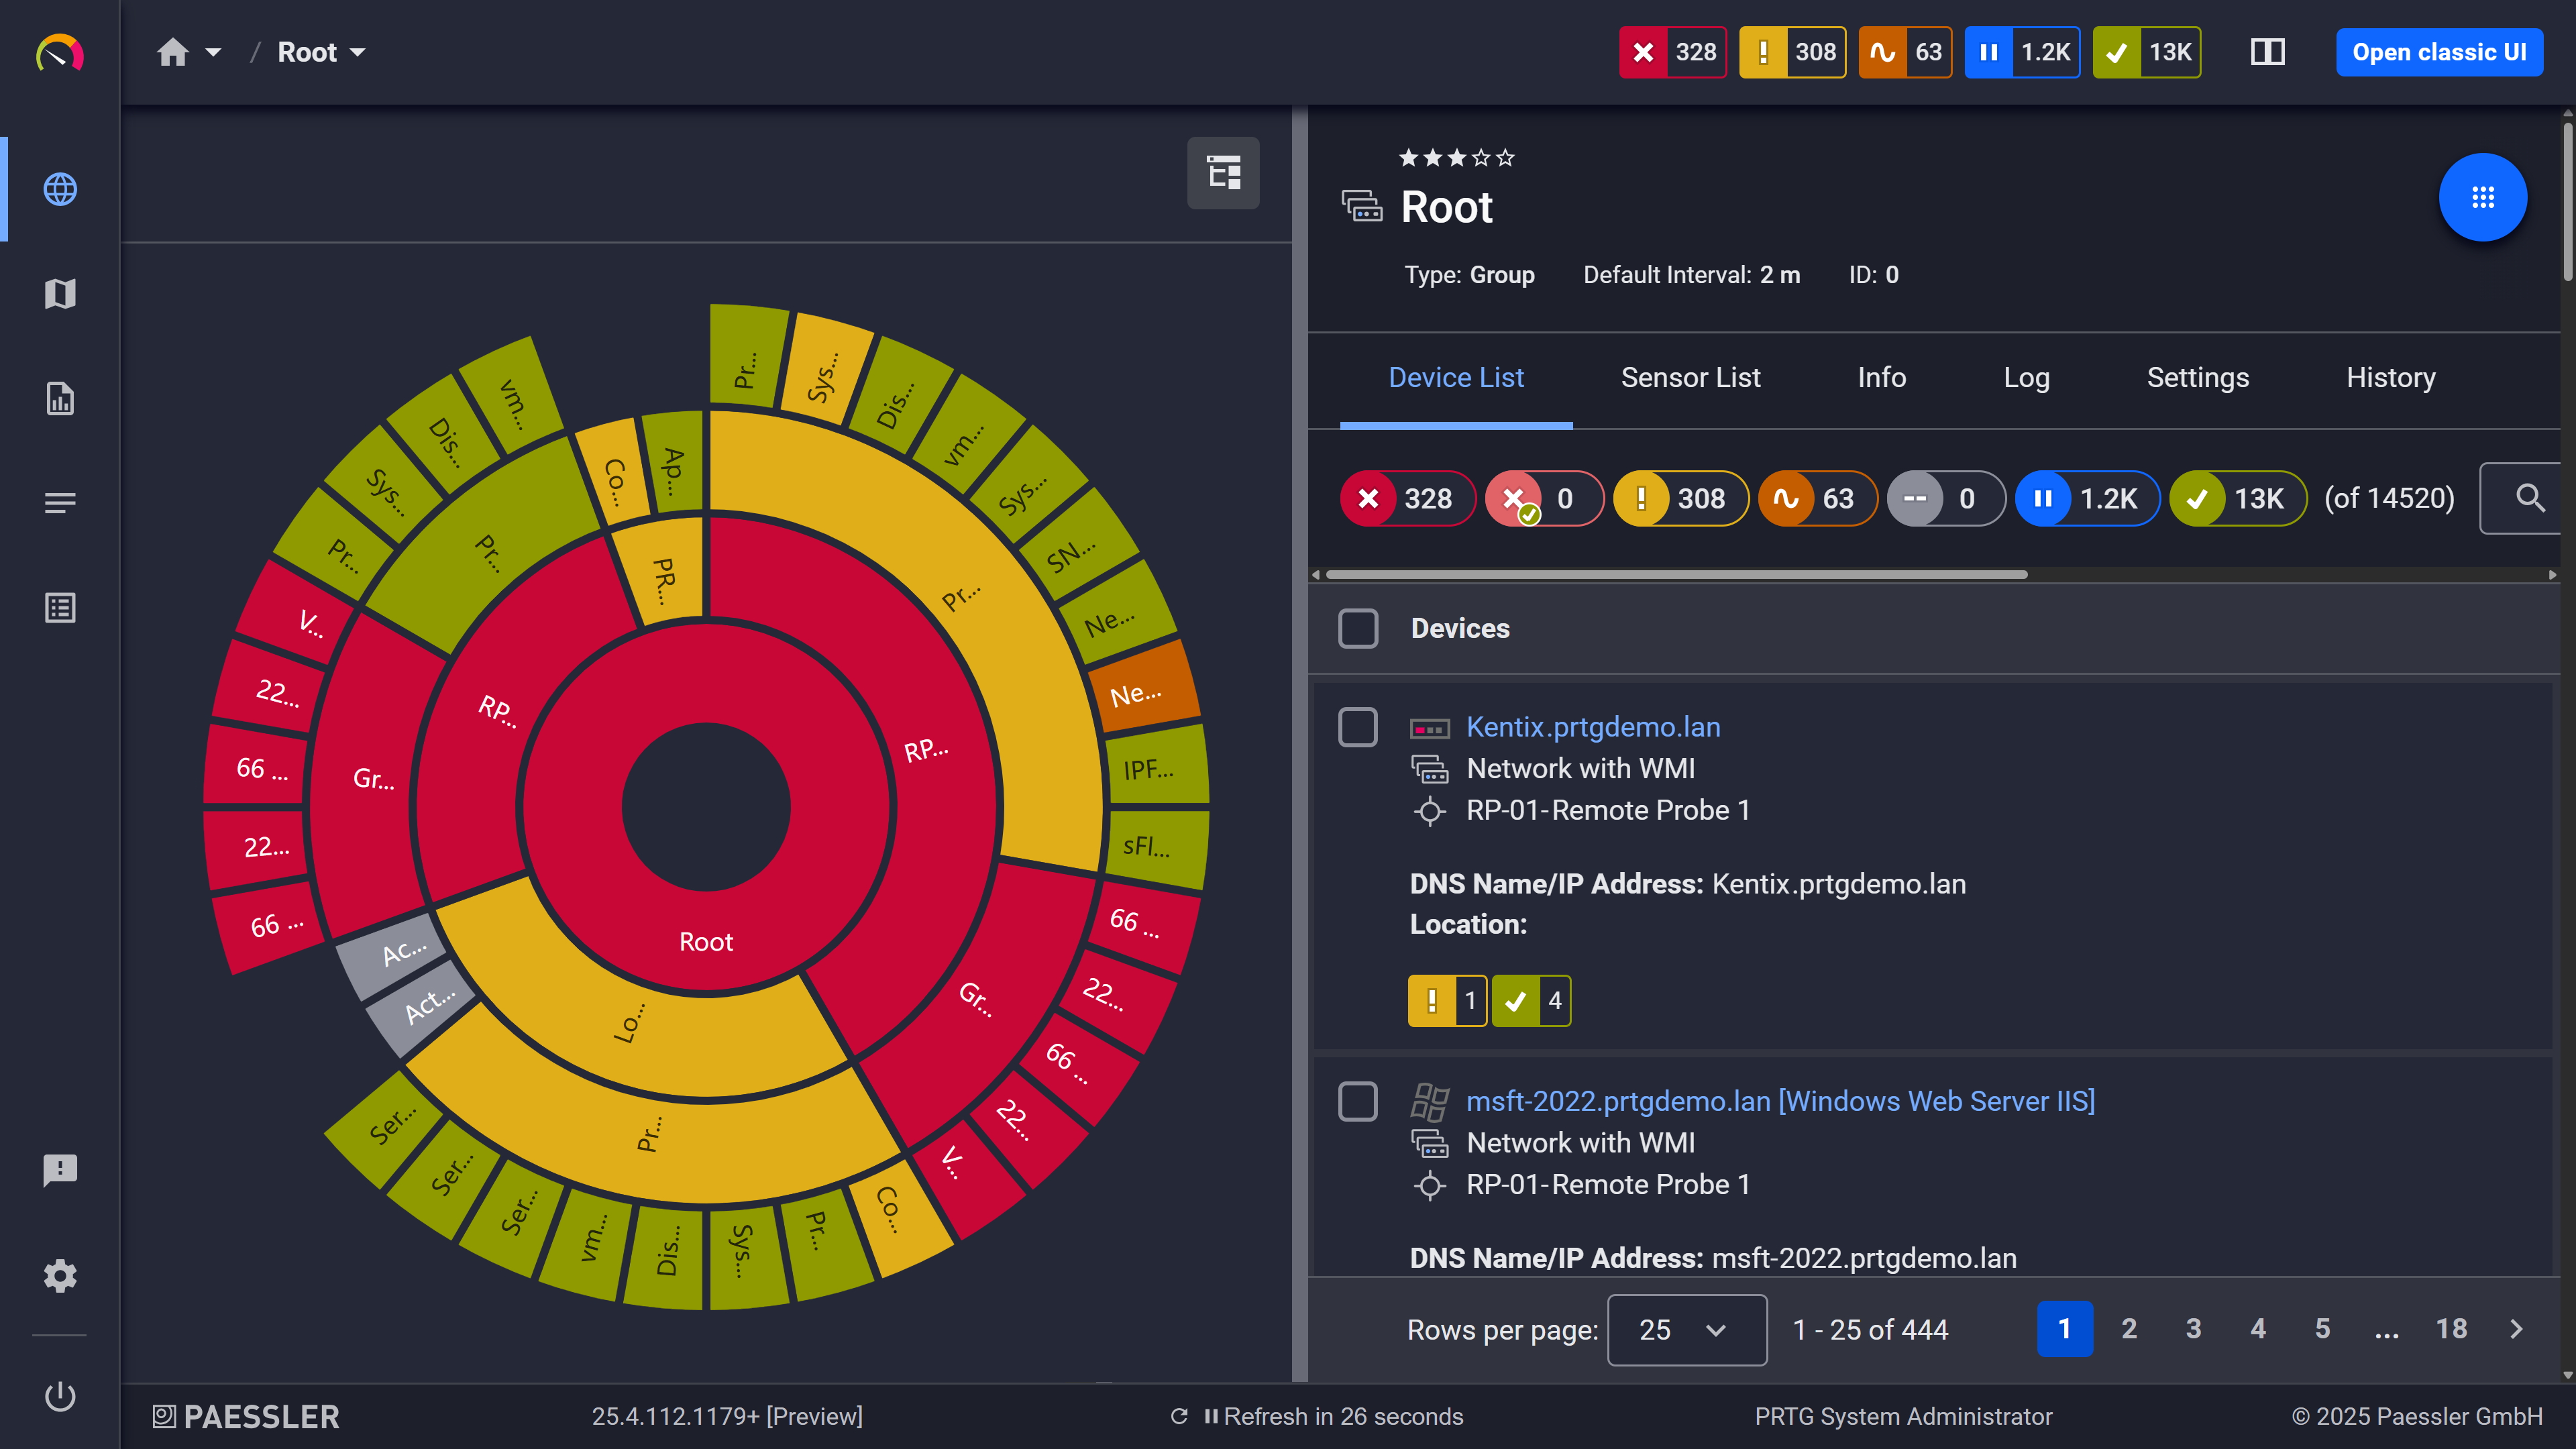
PRTG sunburst chart visualizing the full network hierarchy with color-coded sensor status

Your entire network, visualized instantly

Track Performance Trends Across Weeks and Months

A CPU climbing from 55% to 78% over three weeks never trips a 90% threshold, but that doesn't mean nothing is happening. Slow resource exhaustion looks fine in every point-in-time check and tends to only become obvious in retrospect, which is the wrong time to notice it. Historical graphs and dashboards give you the longitudinal view across servers, network devices, and hybrid environments, while configurable warning and error thresholds per channel still handle hard limits for latency and downtime scenarios. 

  • Compare today's CPU, memory, disk, and interface load against last week or last month
  • Performance visualization across multiple devices in one dashboard
  • Warning and error thresholds configurable per metric channel for hard limits
  • Coverage across servers, network devices, and hybrid environments in one tool
  • Reports for specific time windows to support capacity decisions. Useful for planning conversations, not just incident response.

See Why IT Professionals Trust PRTG

Start monitoring your infrastructure in minutes. No professional services, no complex configuration, no risk.

Free download
PRODUCT OVERVIEW

Add a behavioral visibility layer on top of your existing security tools

This isn't a cybersecurity replacement, and it's worth being explicit about that scope upfront. What it is: an observability layer for behavioral deviations that signature-based tools structurally miss. A device generating unusual outbound connections, a server talking to destinations it never reached before, or a TLS certificate that expired unnoticed don't always produce a security event. They show up as anomalies in behavioral data streams that continuous monitoring surfaces before your SIEM does. 

  • Identify outbound connections and traffic destinations that don't match your network's normal data patterns
  • Flag expired or misconfigured TLS/SSL certificates before they create exposure
  • Monitor the status of Windows security products across endpoints via WMI Security Center sensors
  • Complements your SIEM or IDS without duplicating it. Worth being explicit about that boundary too.
  • Covers on-premises and distributed environments from one monitoring instance
PRTG reports list showing scheduled monitoring reports with run times and sensor counts

Scheduled reports, always on time

PRTG web interface showing Probe Health sensor with health and storage gauge widgets

Probe health at a glance

PRTG web interface showing device tree and full device list with sensor status badges

Full device list, instant overview

How PRTG Monitors Anomalies In Your Infrastructure 

PRTG uses four mechanisms for anomaly detection monitoring. They operate independently and serve different purposes. Not all of them are available from day one, and that distinction matters when you're planning your setup.

Baseline Detection

The baseline needs time to form. Unusual Detection needs enough historical data to build a reliable baseline. In practice, plan for a baseline build-up phase (often several weeks) before baseline-based deviations become meaningful. A baseline built from fewer data points produces false positives at a rate that makes the feature more noise than signal. 

Once the historical data is there PRTG compares current average sensor values against that established historical average.  When values deviate significantly from the baseline, the sensor is highlighted as unusual so you can spot deviations quickly in the device tree and in historical graphs. 

Also worth being clear: this is statistical comparison, not machine learning. No neural networks, no model training, no labeled data. You can see exactly what the baseline is and why a sensor is flagged. The tradeoff for that transparency is the 28–34 day wait.

Flow Monitoring

When a spike registers the follow-up question is always the same. Toplist views within flow sensors answer it directly, surfacing the top traffic sources, connections, and protocols for whatever time window you're looking at. PRTG receives flow data exported by network devices and evaluates it using NetFlow v5/v9, jFlow, sFlow, and IPFIX sensors. Each sensor supports custom channel filters by port, IP range, or protocol for targeted data analysis. 

For devices that don’t export flow data, the Packet Sniffer sensor can monitor traffic directly on the local network interface. It’s less detailed than flow export, but still provides visibility when flow data isn’t available.

Threshold-Based Alerting

This one works from day one. No baseline period, no waiting. Configure warning and error limits per sensor channel and PRTG handles notification when values cross them. Limits can be set as absolute values or delta values (measurements per second), with separate warning and error thresholds per channel. Notification delivery is configurable by escalation step, time delay, and method: email, push notification, Microsoft Teams, Slack, SNMP Trap, and others. 

That independence from Unusual Detection's data requirements is what makes threshold alerting immediately useful after setup. The two anomaly detection methods complement each other. They don't compete.

Historical Data

PRTG stores all sensor readings continuously. After an incident, the useful question usually isn't what failed. It's what the time-series looked like in the hours or days before it. That data exists without any manual intervention and is available as graphs or exportable reports (e.g. PDF, HTML, CSV, XML), covering any time range you specify. 

This accumulated dataset is also what Unusual Detection runs its baseline calculation against. Same historical data. Two separate uses.

free downLoad

Anomaly Detection: Manual vs. PRTG

FEATURE

Without a Monitoring Tool

Without a Monitoring Tool

With PRTG

With PRTG

Establishing a performance baseline

Without a Monitoring Tool
not included

Manual log exports, spreadsheets, periodic review

With PRTG
included

Continuous automatic data collection across all monitored sensors

Detecting traffic anomalies

Without a Monitoring Tool
not included

Periodic interface checks, reactive investigation

With PRTG
included

Flow sensors running continuously; Toplist drill-down on demand

Flagging behavioral deviations

Without a Monitoring Tool
not included

No systematic method; relies on someone noticing

With PRTG
included

Unusual Detection compares against historical baseline automatically

SSL/TLS certificate health

Without a Monitoring Tool
not included

Calendar reminders, manual checks per host

With PRTG
included

SSL Security Check sensor alerts before expiry or misconfiguration

Spotting gradual resource decline

Without a Monitoring Tool
not included

Often missed until threshold breach or failure

With PRTG
included

Historical graphs visualize trends across any time window

free downLoad

”PRTG helps us monitor critical security systems to give customers the peace of mind that their devices are operational and protecting their valuable assets.”

Rob Jackson, President
Integrated Precision Systems

“When it comes to security, we do of course use classic tools such as firewalls, virus scanners, and intrusion detection systems. However, these are no longer enough today. PRTG provides for additional security by detecting unusual behavior which may be a sign that a hacker has outsmarted our security systems.”

Damir Karacic, IT Administrator
Noris Inklusion

“Monitoring with PRTG is crucial for security. Today’s threats can move low and slow, so in addition to looking at the usual suspects, you also need to keep tabs on other indicators. For example, if a server is running a peak capacity for no apparent reason, you want to know so you can take a look and see what’s up – for example an open connection that is being used to extract data in a ransomware attack.”

Jon Larsen, CIO
Richweb

“The best thing about PRTG is that it provides for simple and effective monitoring, all the while respecting the security requirements of manufacturers. PRTG is so easy to use, that many of our monitoring tasks are now handled by our interns. We will definitely expand our use of the software in the future.”

Karsten Boettger, Head of IT
LAKUMED Clinics

Paessler PRTG Network Monitor licenses & pricing

Choose the PRTG Network Monitor subscription that's best for you.

License NameLicense descriptionPriceLicense DetailsGet startedPricing Details
PRTG 500$200per month paid annuallyBuy nowBuy now

Enough to monitor multiple aspects of 50 devices

PRTG 1000$358per month paid annuallyBuy nowBuy now

Enough to monitor multiple aspects of 100 devices

PRTG 2500$742per month paid annuallyBuy nowBuy now

Enough to monitor multiple aspects of 250 devices

PRTG 5000$1,300per month paid annuallyBuy nowBuy now

Enough to monitor multiple aspects of 500 devices

PRTG 10000$1,642per month paid annuallyBuy nowBuy now

Enough to monitor multiple aspects of 1000 devices

Over 100,000 Customers Worldwide Love Paessler  

customer success stories

 Anomaly Detection Monitoring: Frequently Asked Questions


What is anomaly detection in IT monitoring?

In real-world infrastructure monitoring it means things like: a bandwidth spike that doesn't fit the usual data patterns, a CPU that's been climbing steadily for a week when it normally holds flat, or a device behaving differently than it did last week with no obvious configuration change. Not every anomaly is a crisis. Some are noise. The goal is surfacing the ones worth looking at. 

Three types of anomalies show up in practice. Point anomalies are single data points that are well outside the norm. Contextual anomalies are values that look unusual given the situation (seasonality matters here) but aren't extreme in absolute terms. Collective anomalies are groups of readings that together signal a problem, even if individual values look fine. Good anomaly detection techniques distinguish between these categories, not just flag everything above a line.

Does this type of monitoring require machine learning or AI?

PRTG's Unusual Detection doesn't use machine learning. Full stop. 

What it uses is statistical comparison: PRTG builds a baseline from your environment’s own historical data and flags values that deviate significantly from that established normal range. No deep learning, no neural networks, no model training on labeled data. 

Tools that rely on machine learning models or anomaly detection algorithms like clustering or nearest neighbors can work well in specific contexts. The tradeoffs are real though: they need labeled data to train on, time to become accurate, and still produce false positives even when tuned well. PRTG's approach is deterministic. You can see exactly what the baseline is and why a sensor is flagged. No AI-powered black box, no guesswork.

What types of anomalies can be detected through network monitoring?

The useful distinction is between sudden anomalies and gradual ones, because they need different detection approaches. 

Sudden anomalies are what threshold alerts catch: a bandwidth spike, a server jumping from normal load to maxed out, an interface going down. Gradual anomalies are different: a CPU drifting upward over days, unusual patterns in protocol usage, latency creeping up on a link. These only become visible when compared against historical data over time. Outlier detection for this second category is what Unusual Detection is built for. 

Also worth flagging: seasonality matters. Traffic that looks high in isolation might be completely normal for that time of week or month. And things like expired SSL/TLS certificates or unexpected outbound network traffic destinations sit in their own category, not performance anomalies exactly, but behavioral deviations that continuous monitoring surfaces.

How long does it take for baseline-based anomaly detection to become useful?

The 28–34 day wait isn't something to work around. A baseline built from insufficient data produces false positives at a rate that makes Unusual Detection more noise than signal. So PRTG won't display Unusual status results until that historical data exists. By design, not limitation. 

Still, threshold-based alerting is useful from the moment your sensors are running. No data collection period required. The practical answer for the first month: thresholds handle hard limits, and Unusual Detection comes online once the baseline is complete. Both are part of the anomaly detection system. They just become available at different points in the setup.

How is baseline-aware anomaly detection different from standard threshold alerts?

Here's a concrete example. A server normally runs at 30% CPU. Over two weeks it drifts to 75%. A 90% threshold never fires. Unusual Detection flags it because 75% is significantly higher than what that specific sensor's historical baseline shows as normal, even though it's well below the hard limit. 

Threshold alerting is absolute: when a value crosses the limit you configured, the alert triggers, regardless of whether that value is unusual for this specific sensor. Baseline comparison is relative: it measures current values against standard deviations from the established historical pattern for that sensor specifically. 

The two anomaly detection methods have genuinely different blind spots. Hard limits catch things historical comparison misses. Historical comparison catches gradual drift that thresholds miss entirely. Running both is better than choosing one.

Can network anomaly monitoring help with cybersecurity?

Yes, within a clearly defined scope. Network monitoring doesn't replace security tools. A SIEM or IDS handles different problems, and positioning a monitoring tool as a cybersecurity replacement creates gaps rather than closing them. 

What it adds is an observability layer that signature-based tools can't fully cover. Unusual outbound connections, traffic destinations that don't match normal data patterns, unexpected protocol usage, a device that started communicating with new destinations last Tuesday. These produce anomalies in behavioral data streams before they produce a security event. That's where monitoring sits in the stack. 

SSL/TLS certificate visibility is a practical example. An expired certificate isn't a security incident on its own. But it's exposure that continuous monitoring flags before it becomes one, without needing a SIEM event to trigger the check. For teams already running SIEM or IDS tools, network anomaly monitoring adds the data analysis layer that supports early awareness, not a replacement, just covering a different part of the picture.

Paessler PRTG

Paessler PRTG

Network Monitoring Software – Version 26.1.116.1532 (February 9th, 2026)

Hosting icon

Hosting

Download for Windows and cloud-based version PRTG Hosted Monitor available

Languages icon

Languages

English, German, Spanish, French, Portuguese, Dutch, Russian, Japanese, and Simplified Chinese

test

Monitor everything

Network devices, bandwidth, servers, applications, virtual environments, remote systems, IoT, and more

test

Pricing

Choose the PRTG Network Monitor subscription that's best for you

Discover more monitoring insights and stories

Content illustration

Powerful stories from the monitoring world

  • Network anomaly detection methods, systems and tools
  • Secure your factory floor: How Paessler PRTG helps detect ...
  • Network behavior analysis (NBA) Essential protection for modern IT ...
Support illustration

Resources to master your monitoring challenges

  • Quick Start Guide
  • PRTG Apps for Mobile Network Monitoring
  • How can I speed up PRTG—especially for large installations?
Solution illustration

Solutions for all your monitoring needs

  • Bandwidth Monitoring
  • NetFlow Monitoring
  • Database Monitoring
PRTG Logo

Start Monitoring with PRTG and see how it can make your network more reliable and your job easier.

Free download
PRODUCT OVERVIEW

Products

  • Paessler PRTG
    Paessler PRTGMonitor your whole IT infrastructure
    • PRTG Network Monitor
    • PRTG Enterprise Monitor
    • PRTG Hosted Monitor
    • PRTG UVexplorer
    • PRTG extensions
      Extensions for Paessler PRTGExtend your monitoring to a new level
  • Icon Features
    FeaturesExplore all monitoring features

Monitoring with PRTG

  • Network monitoring
  • Bandwidth monitoring
  • SNMP monitoring
  • Network mapping
  • Wi-Fi monitoring
  • Server monitoring
  • Network traffic analyzer
  • NetFlow monitoring
  • Syslog server

Useful Links

  • PRTG Manual
  • Knowledge Base
  • Customer Success Stories
  • About Paessler
  • Subscribe to newsletter
  • PRTG Support
  • PRTG Consulting
  • PRTG Feedback & Roadmap

Contact

Paessler GmbH
Thurn-und-Taxis-Str. 14, 
90411 Nuremberg 
Germany

[email protected]

+49 911 93775-0

  • Contact us
©2026 Paessler GmbHTerms & ConditionsPrivacy PolicyImprintReport VulnerabilityDownload & InstallSitemap
FAQ FAQ FAQ