• Company
    • About Us
    • Case Studies
    • Press Center
    • Careers
    • Blog
    • Contact us
  • Contact us
  • Login
 
  • English
    • Deutsch
    • Español
    • Français
    • Italiano
    • Português
Paessler
                    - The Monitoring Experts
  • Products
    • Paessler PRTG
      Paessler PRTGMonitor your whole IT infrastructure
      • PRTG Network Monitor
      • PRTG Enterprise Monitor
      • PRTG Hosted Monitor
      • PRTG UVexplorer
      • PRTG extensionsExtensions for Paessler PRTGExtend your monitoring to a new level
    • Icon Features
      FeaturesExplore all monitoring features
      • Maps & dashboards
      • Alerts & notifications
      • Multiple user interfaces
      • Distributed monitoring
      • Customizable reporting
  • Solutions
    • By TeamFor your organization size
      • Small Business IT
      • Mid-Market IT
      • Enterprise IT
      • MSP Network Monitoring
    • Industries
      By IndustryFor your business sector
      • Industrial
      • Healthcare
      • Government
      • Education
      • Data Center
      • Finance
    • IT Topics
      By Use CaseFor every technical scenario
      • Network Monitoring
      • Server Monitoring
      • OT Monitoring
      • Distributed Monitoring
      • Network Topology Mapping
      • SNMP Monitoring
      • Bandwidth Monitoring
  • Pricing
  • Resources
    • Getting Started
      Getting StartedModules for self-paced learning
    • How-to Guides
      How-to GuidesGet the most out of PRTG
    • Videos & Webinars
      Videos & WebinarsLearn from Paessler experts
    • IT  Knowledge
      IT KnowledgeExpand your IT knowledge
    • PRTG Manual
      PRTG ManualFull documentation
    • Knowledge Base
      Knowledge BaseShare community knowledge
    • PRTG Sensor Hub
      PRTG Sensor HubGet sensors, scripts & templates
    • Trainings
      PRTG TrainingLearn how to work with PRTG
  • Partners
    • Icon Handshake
      Become a PartnerFor resellers and channel partners
    • Icon MSP
      Become an MSPDeliver monitoring as a managed service
    • icon partner
      Partner PortalLog in to your partner account
    • Deal Registration
      Deal RegistrationRegister your sales opportunities
    • icon search
      Find a PartnerFind partners selling Paessler products
    • icon technology
      Technology AlliancesSee Paessler technology partnerships
    • Partner HubTools for Your Success
  • Company
    • About Us
    • Case Studies
    • Press Center
    • Careers
    • Blog
    • Contact us
  • Contact us
  • Login
  • English
    • Deutsch
    • Español
    • Français
    • Italiano
    • Português
  • Get a quote
  • Free trial
  1. Home>
  2. By Team>
  3. Enterprise IT

Enterprise-grade reliability without enterprise complexity

  • Built for environments where downtime isn't an option
  • Full visibility across networks, servers, OT systems, and cloud – all in one place
  • Trusted in hospitals, factories, and critical infrastructure worldwide
Contact Sales

Trusted by regional and site-based IT teams at manufacturers, hospitals, universities, retailers, and more - worldwide. 

customer success stories

What customers say about us

Why distributed IT teams choose PRTG

Corporate monitoring tools are built for central IT teams that control everything - not for the plant, regional office, or campus IT team that has its own infrastructure, its own urgency, and no time to wait on central IT. PRTG is built to be deployed by your team, for your environment, on your schedule.

Distributed Enterprise IT
  • Deploy on your own timeline – no waiting for corporate IT procurement or rollout schedules
  • Monitor your specific environment – warehouse networks, hospital wings, plant floors, university campus
  • Sensor-based licensing sized for your local deployment – pay for what you actually monitor
  • Works independently from corporate systems – share data upward when needed
  • Up and running in hours – auto-discovery and pre-configured sensors, your monitoring starts immediately

The monitoring problem that distributed IT teams face every day

You’re accountable for uptime at your site. But the tools available either don’t fit your environment, take too long to deploy, or require resources you don’t have. You need monitoring visibility right now, and on your terms. 

problem icon

Corporate tools weren´t built for your site 

Enterprise-wide monitoring platforms are built for central IT teams, not for a regional office or plant floor. Adding a device takes days. Getting a new sensor approved takes weeks. 

problem icon

Local accountability, centralized bottlenecks 

When something goes down at your site, your team is accountable – not corporate IT. If your monitoring depends on central approval, you're exposed.

problem icon

Not every site looks like headquarters

Your site runs OT systems, industrial devices, and specialized hardware that corporate tools don't support. You need to monitor what's actually there – not what headquarters planned for.

Monitoring that works for your site, your team, your environment 

PRTG gives Distributed Enterprise IT teams the independence, speed, and flexibility to monitor what matters — without navigating corporate complexity

Deploy independently in hours 

  • Install PRTG on a local server – no central IT involvement required
  • Auto-discovery scans your network and adds devices automatically
  • 250+ pre-configured sensors start monitoring straight away

Monitor your environment, your way 

  • Monitor OT systems, specialized hardware, and local applications specific to your site
  • Customizable sensor thresholds and alerts for your team’s specific requirements
  • Local dashboards and maps built for your site layout and workflows

Local budget, measurable ROI 

  • Sensor-based licensing – pay for what you monitor
  • No enterprise pricing, no mandatory professional services, no consultant dependencies
  • Preventing even one major outage typically pays for PRTG many times over

Catch problems before they hit production 

  • Threshold-based alerts via email, SMS, push notifications, or tools like Teams and Slack
  • Your team gets notified immediately, not after an issue is reported
  • Historical trends help identify recurring problems before they cause outages

Monitor IT and OT in one place 

  • IT protocols: SNMP, WMI, SSH, NetFlow, REST API, and more
  • OT and industrial: Modbus, MQTT, OPC UA, and industrial gateway integration
  • One dashboard for your entire environment – IT and OT included

Prove it at site one – then scale

  • Each site deploys independently, or connect locations via remote probes when you're ready
  • Forward alerts and data to central systems via syslog, SNMP traps, or webhooks
  • Your site one success becomes the business case for site two, three, and beyond

Full visibility, built for your site

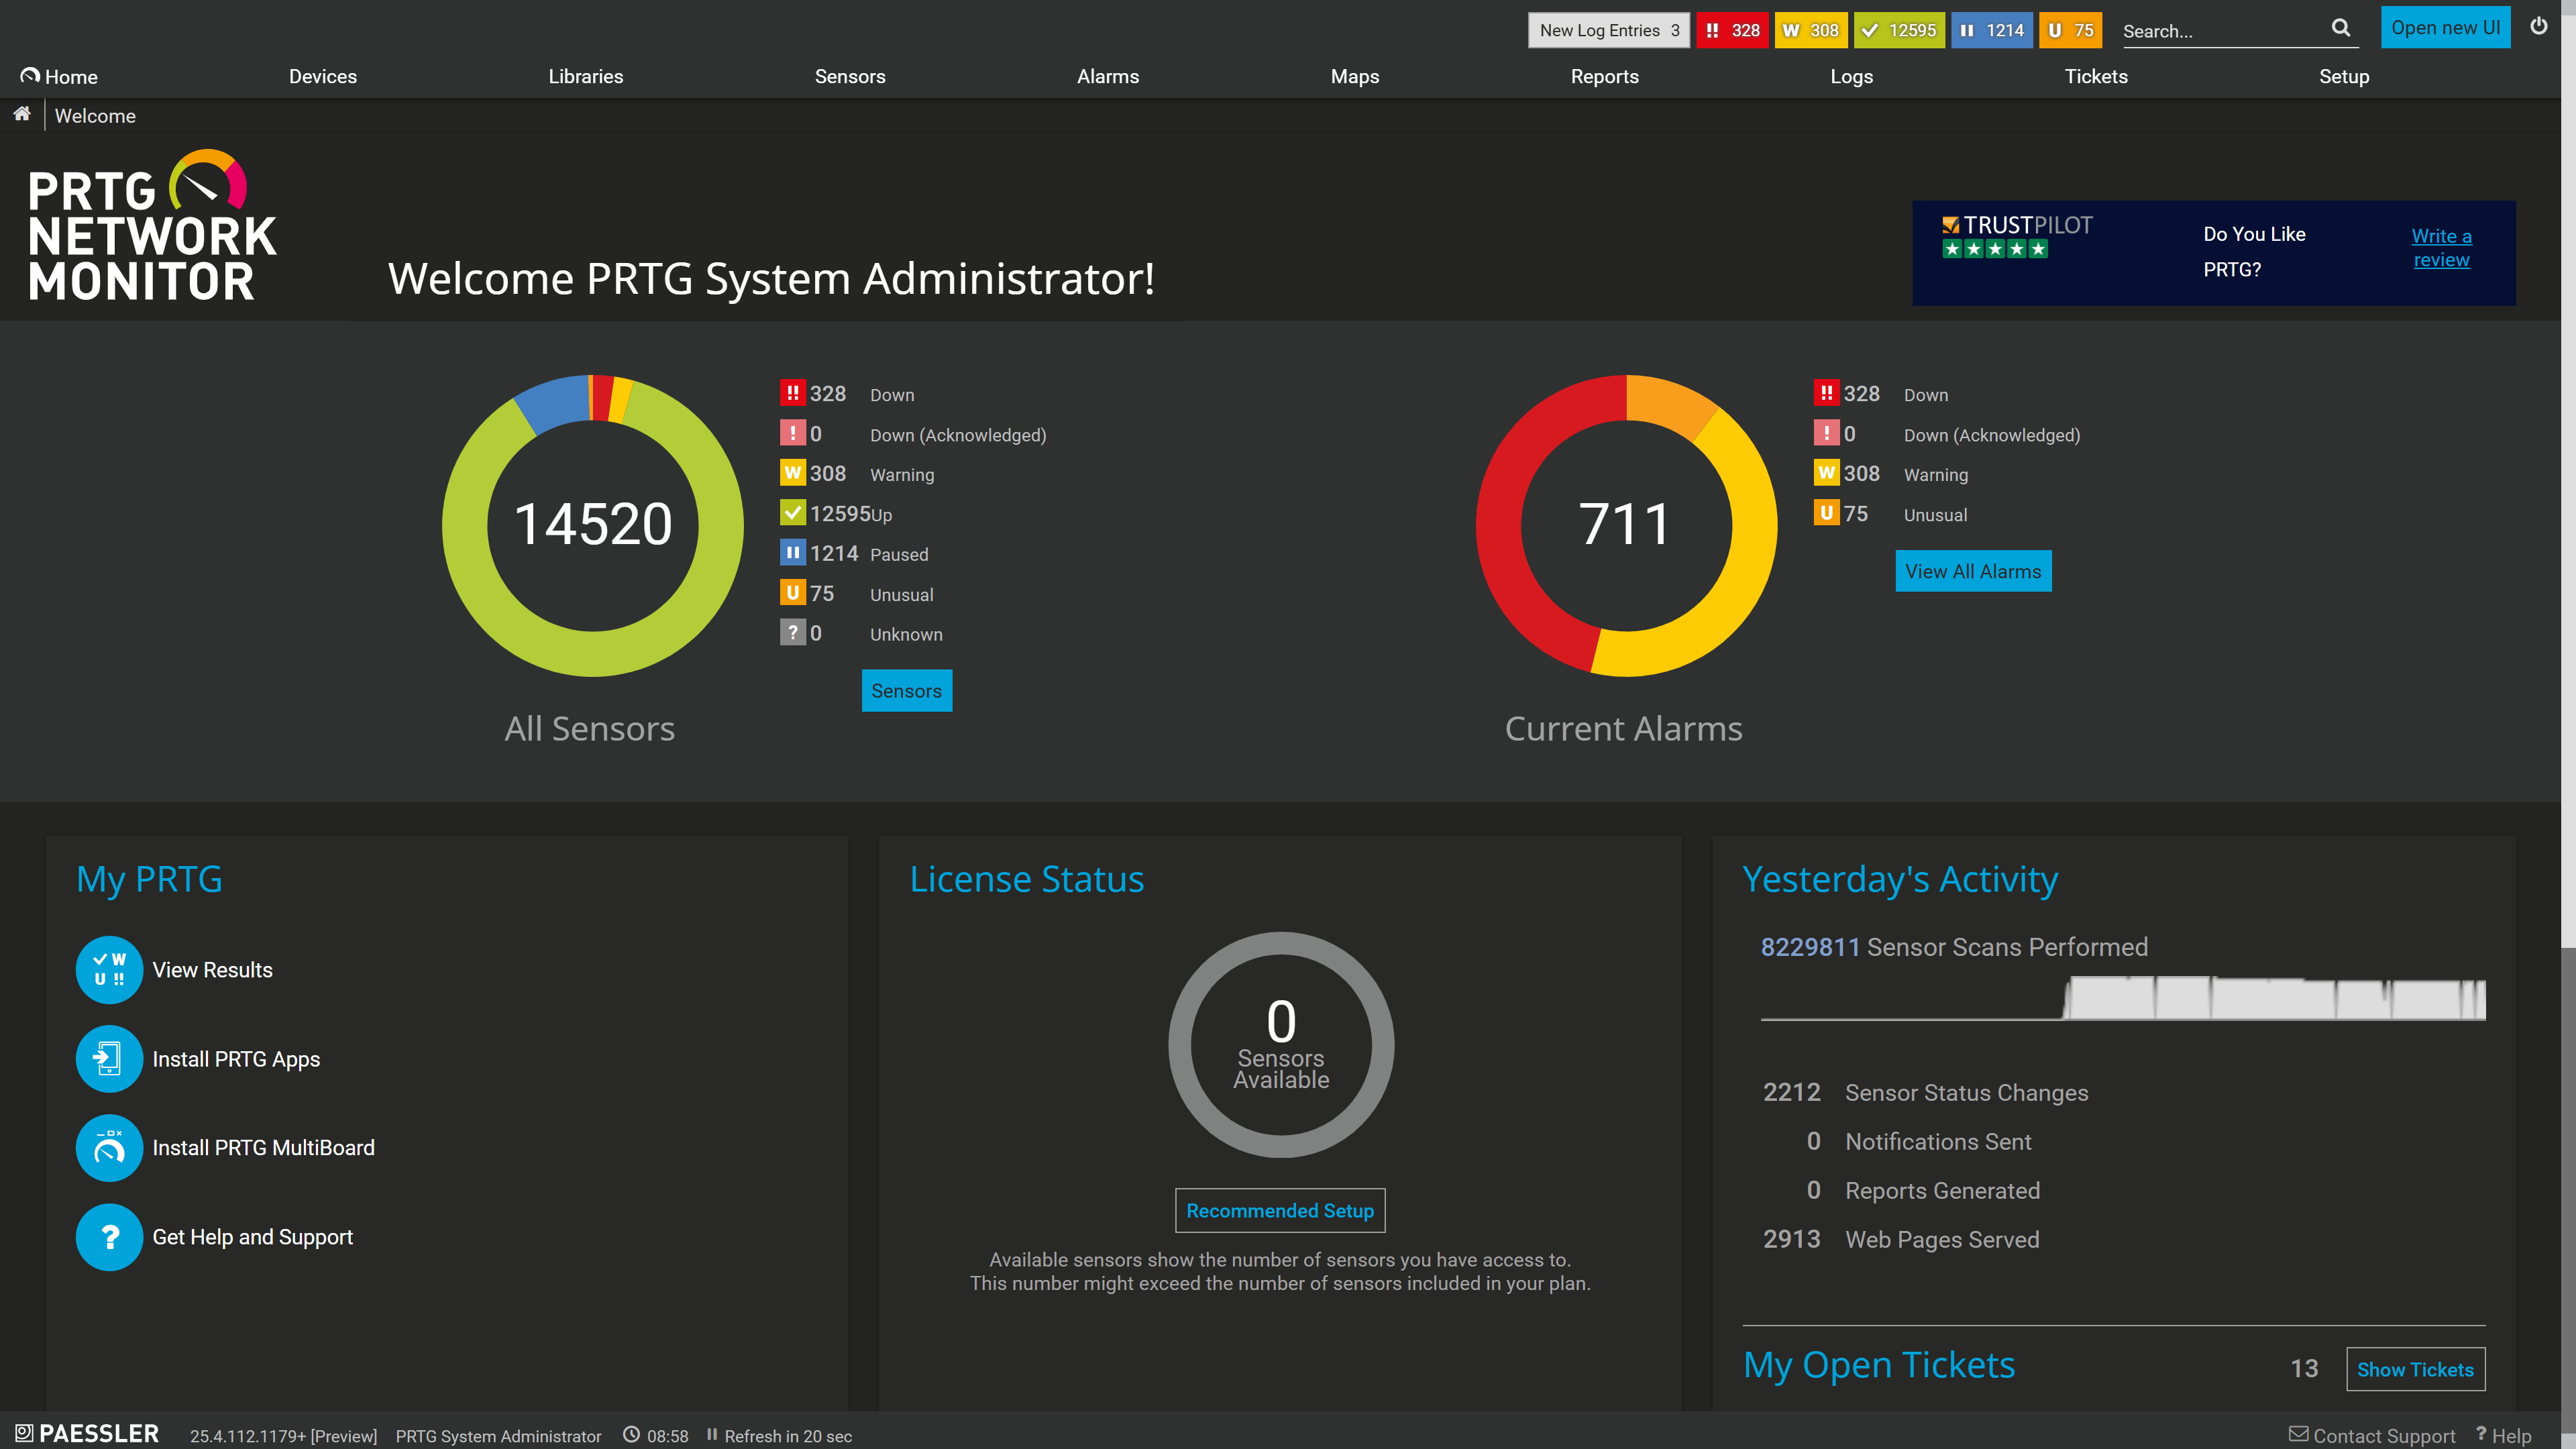
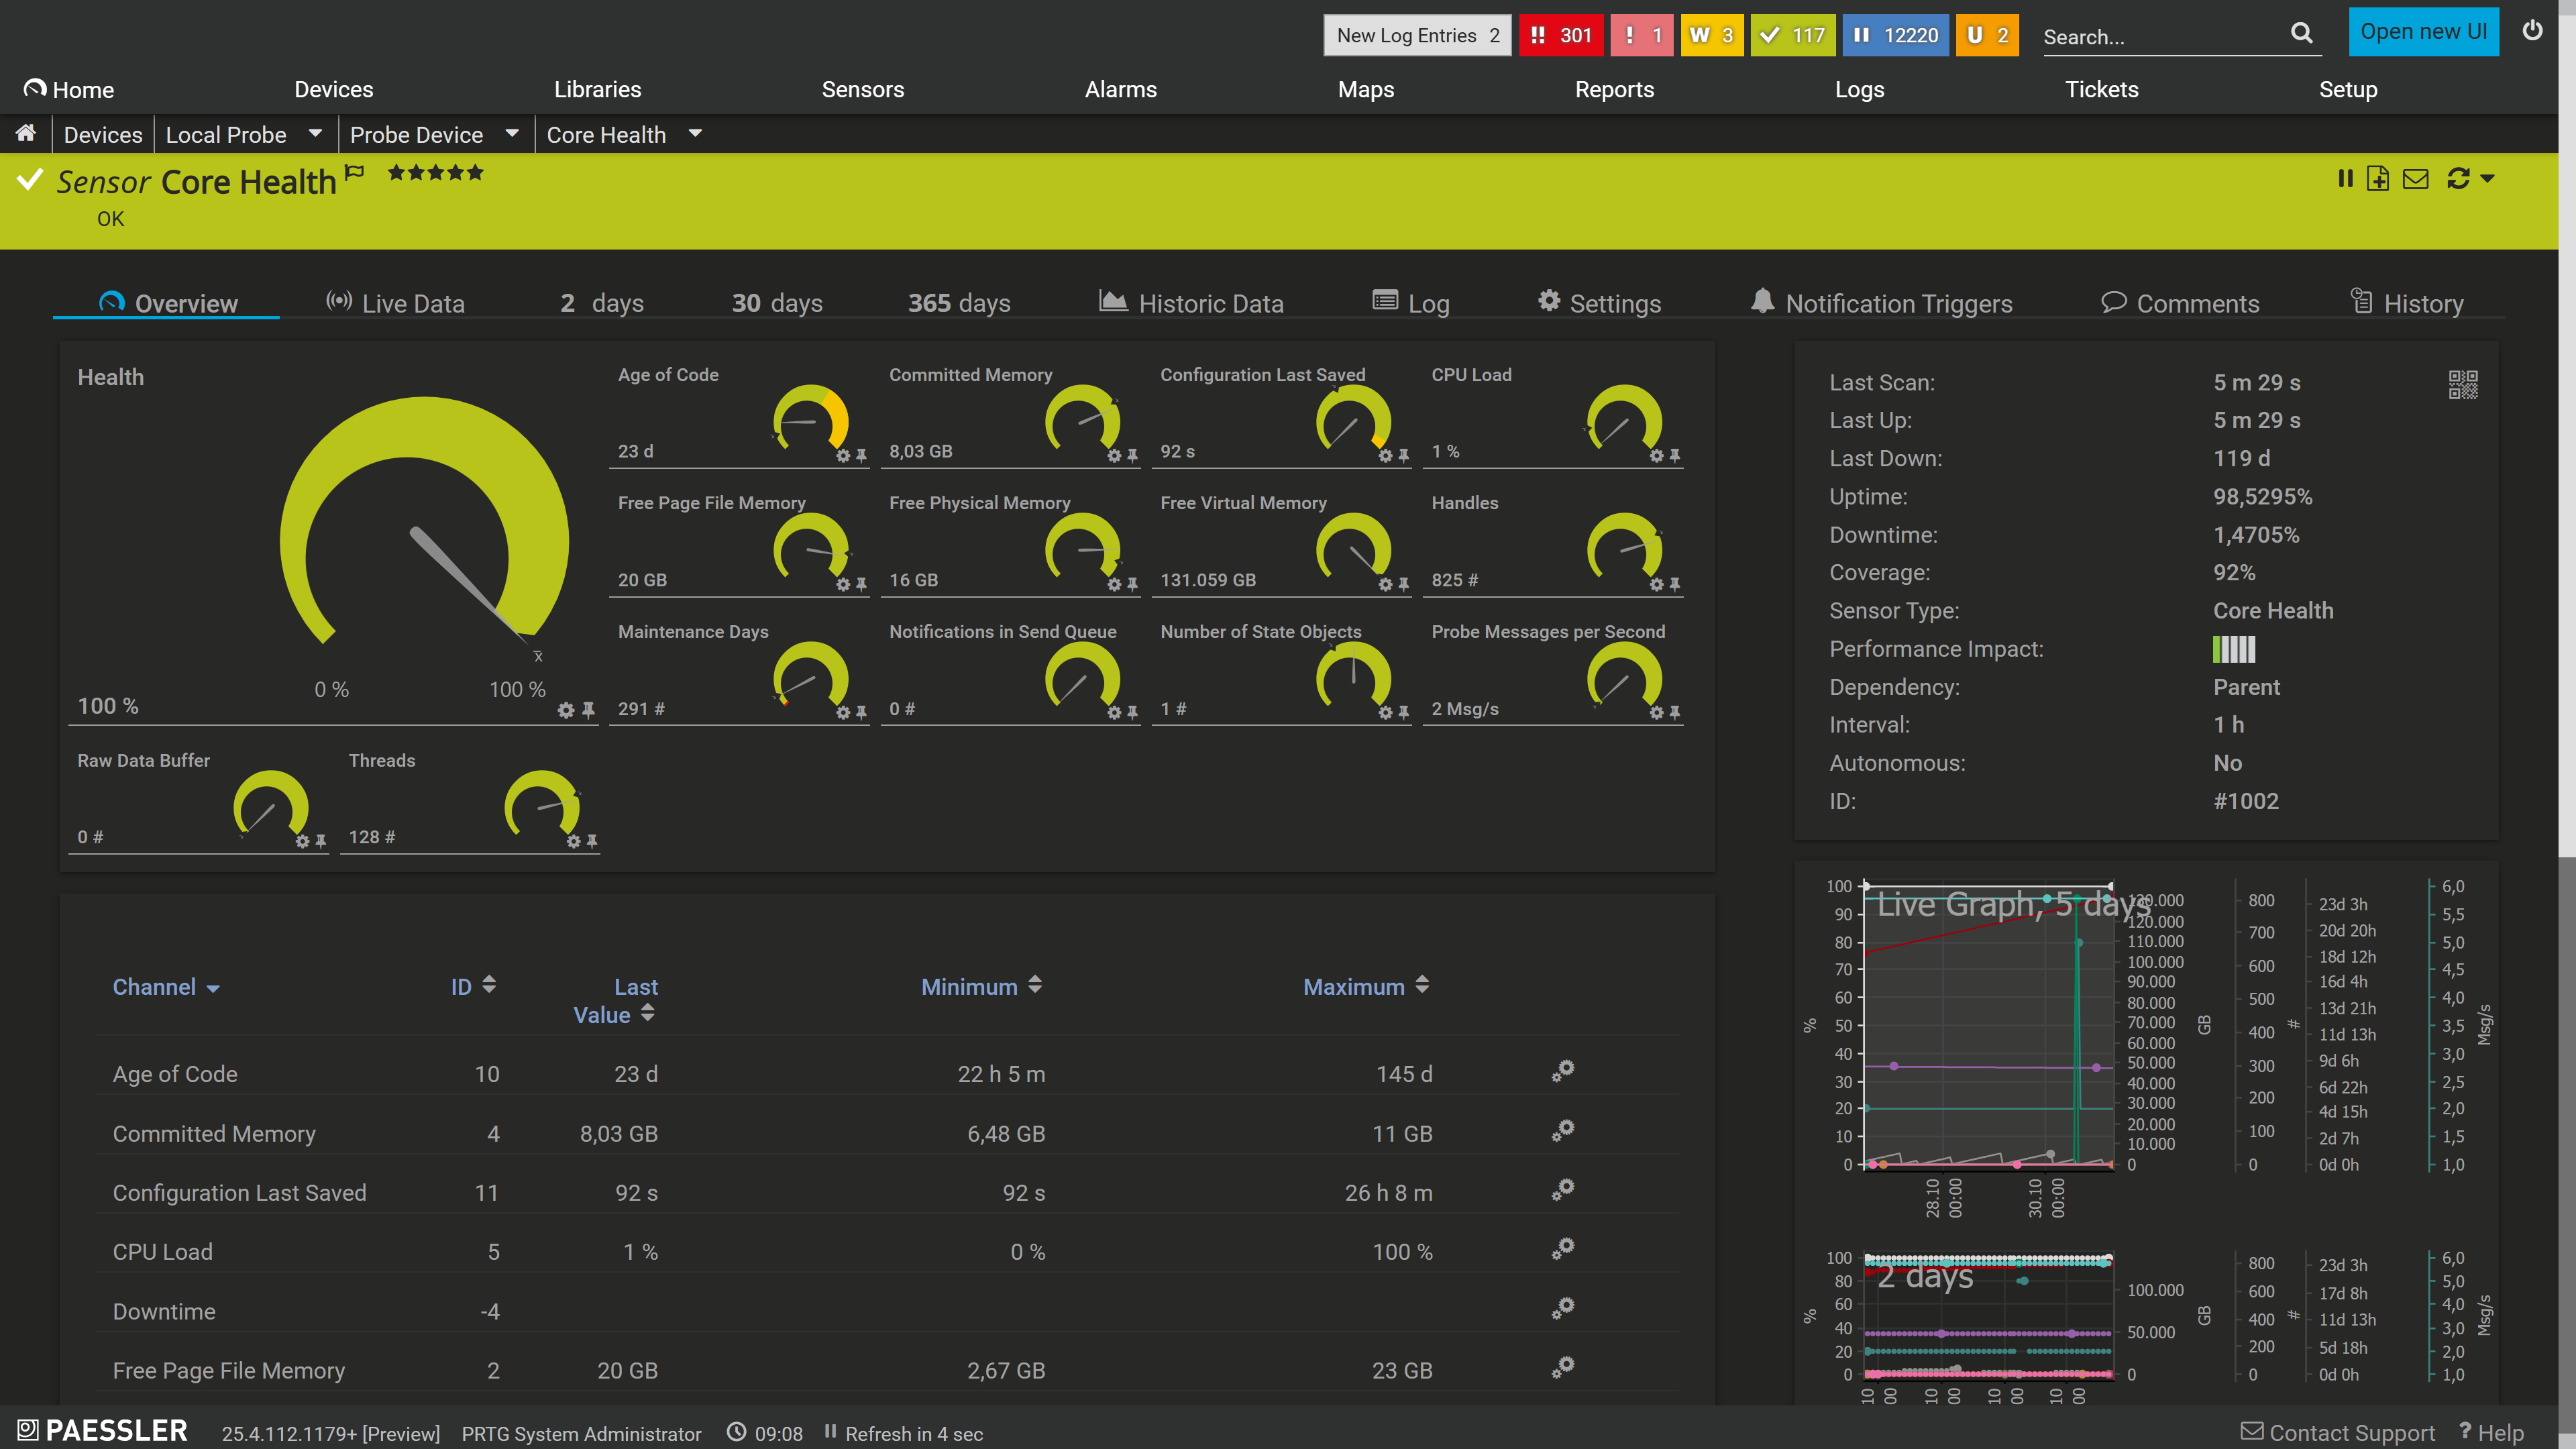
Your team can build maps and dashboards that reflect your actual site layout, your devices, and the metrics that matter to you. Whether you’re monitoring a plant floor network, a hospital campus, or a distribution center, PRTG shows you what’s happening in real time.
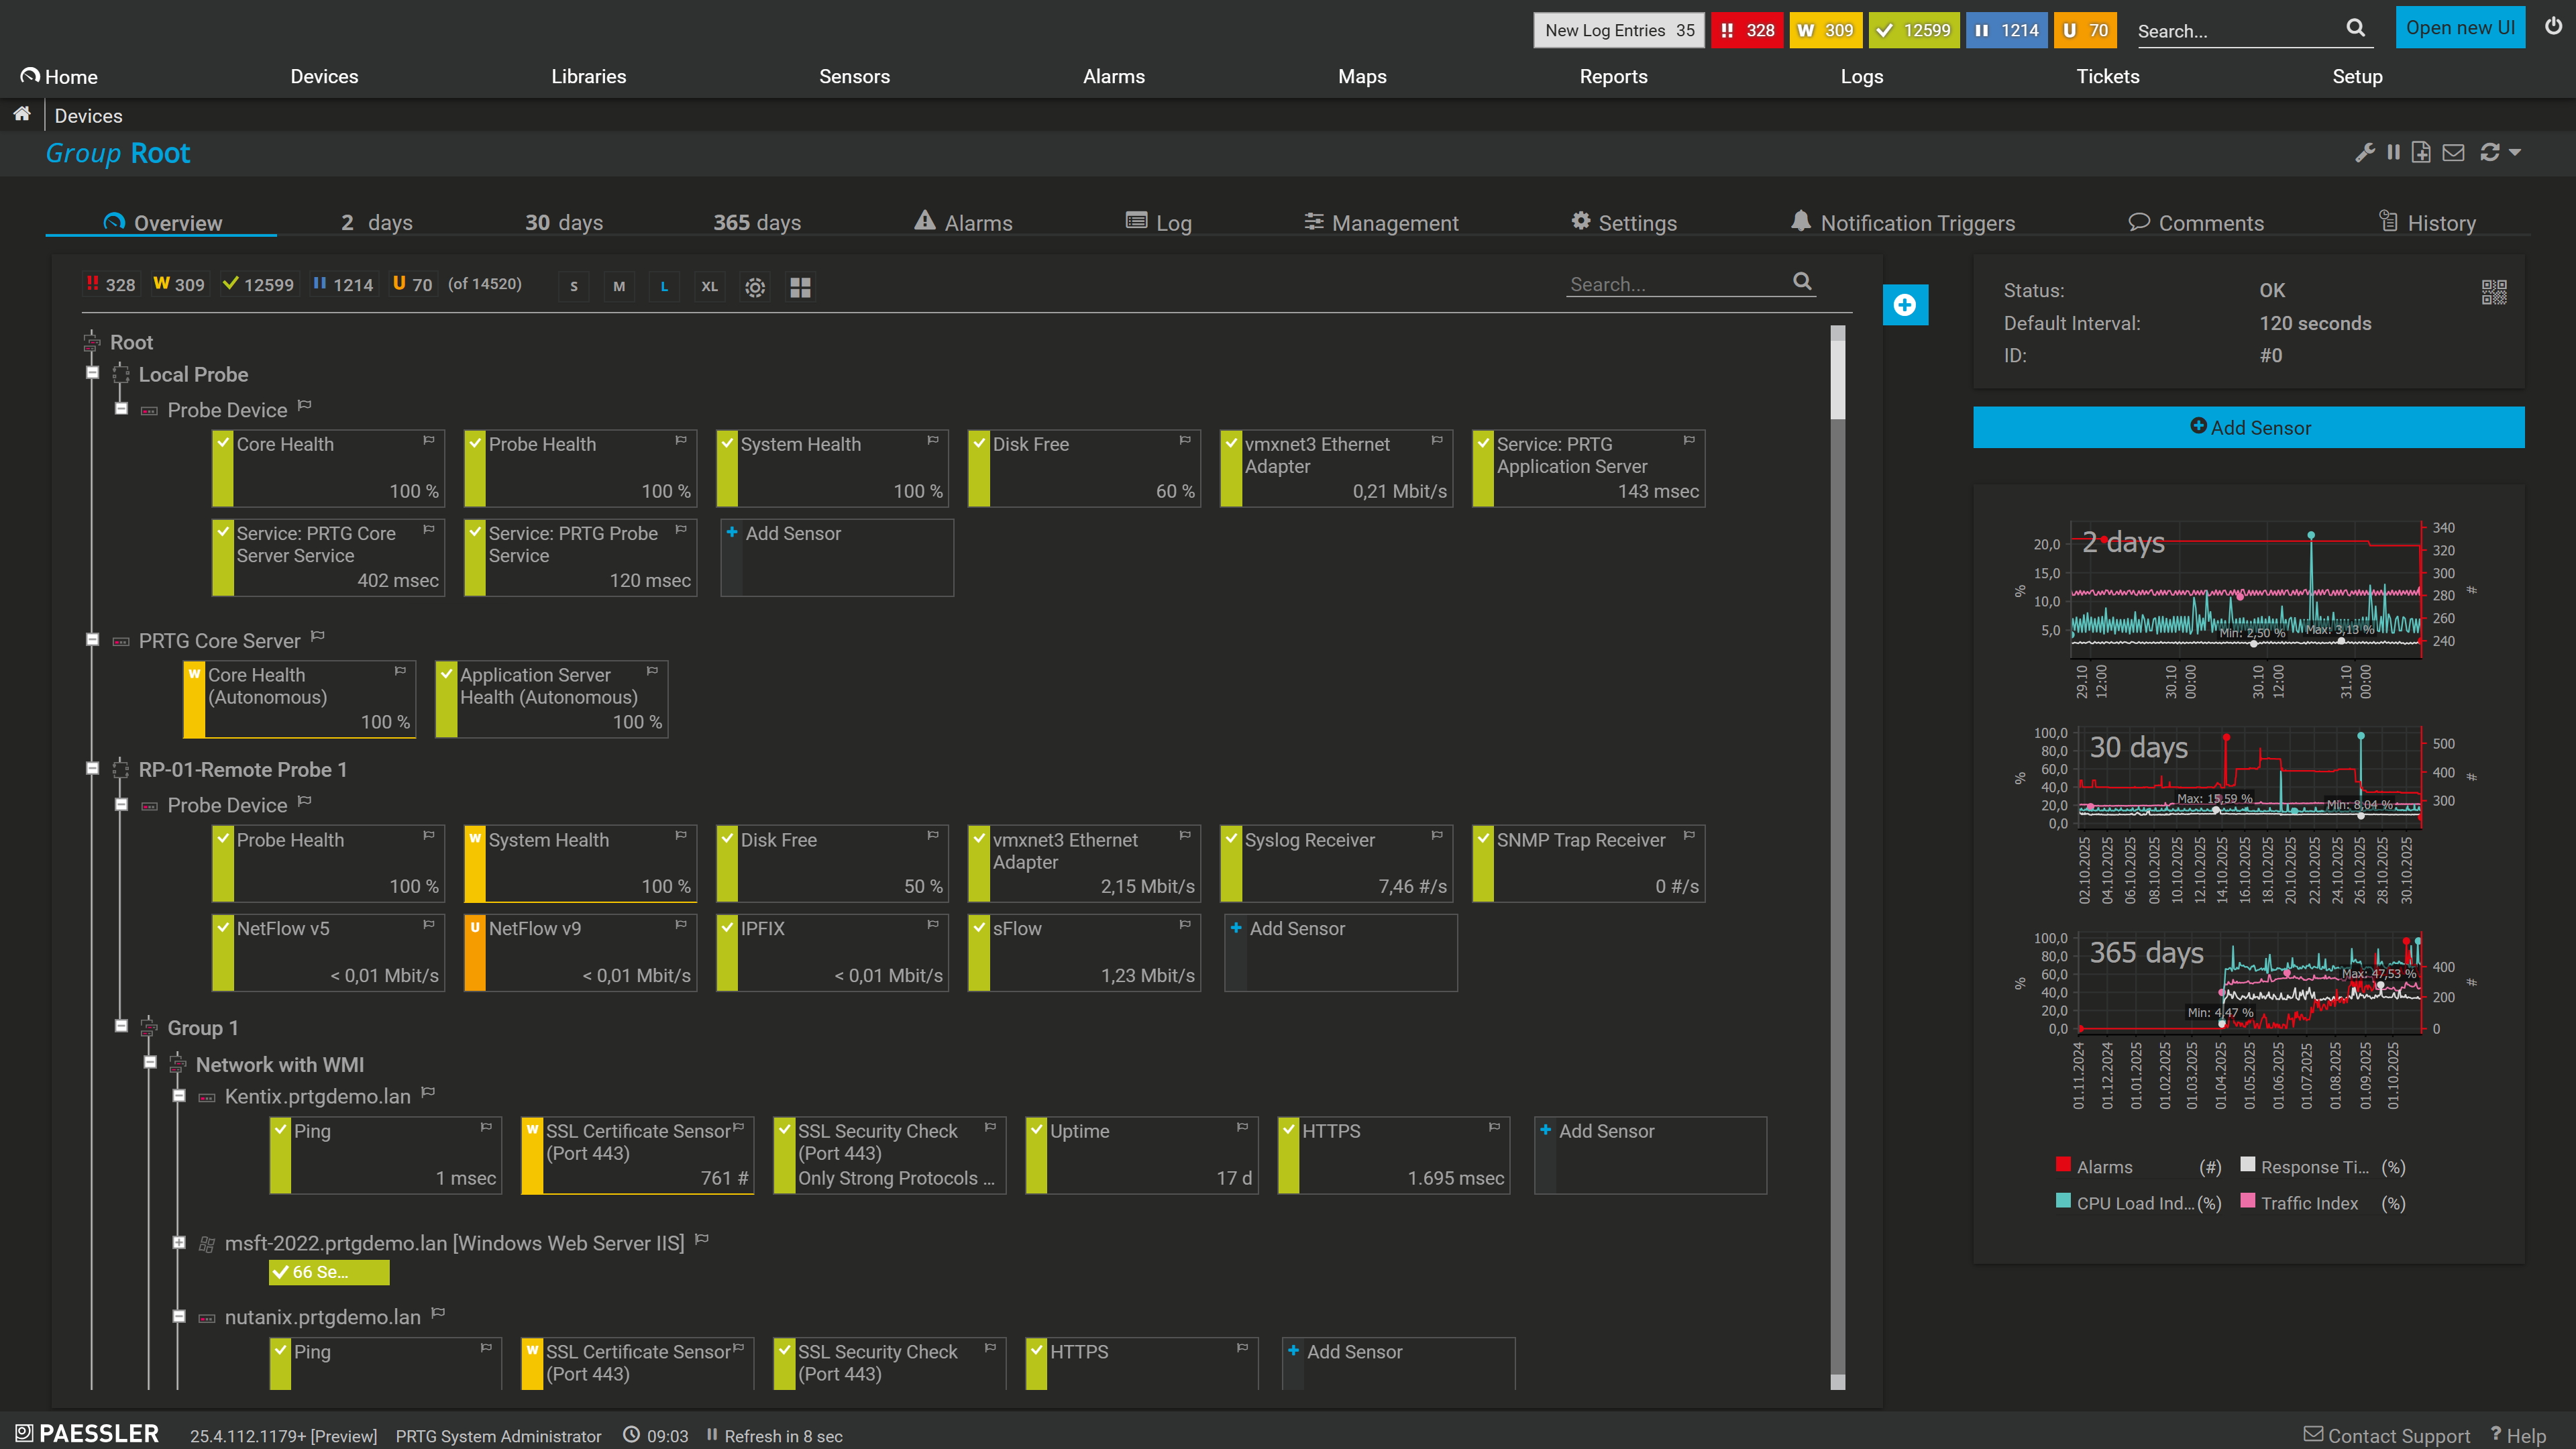
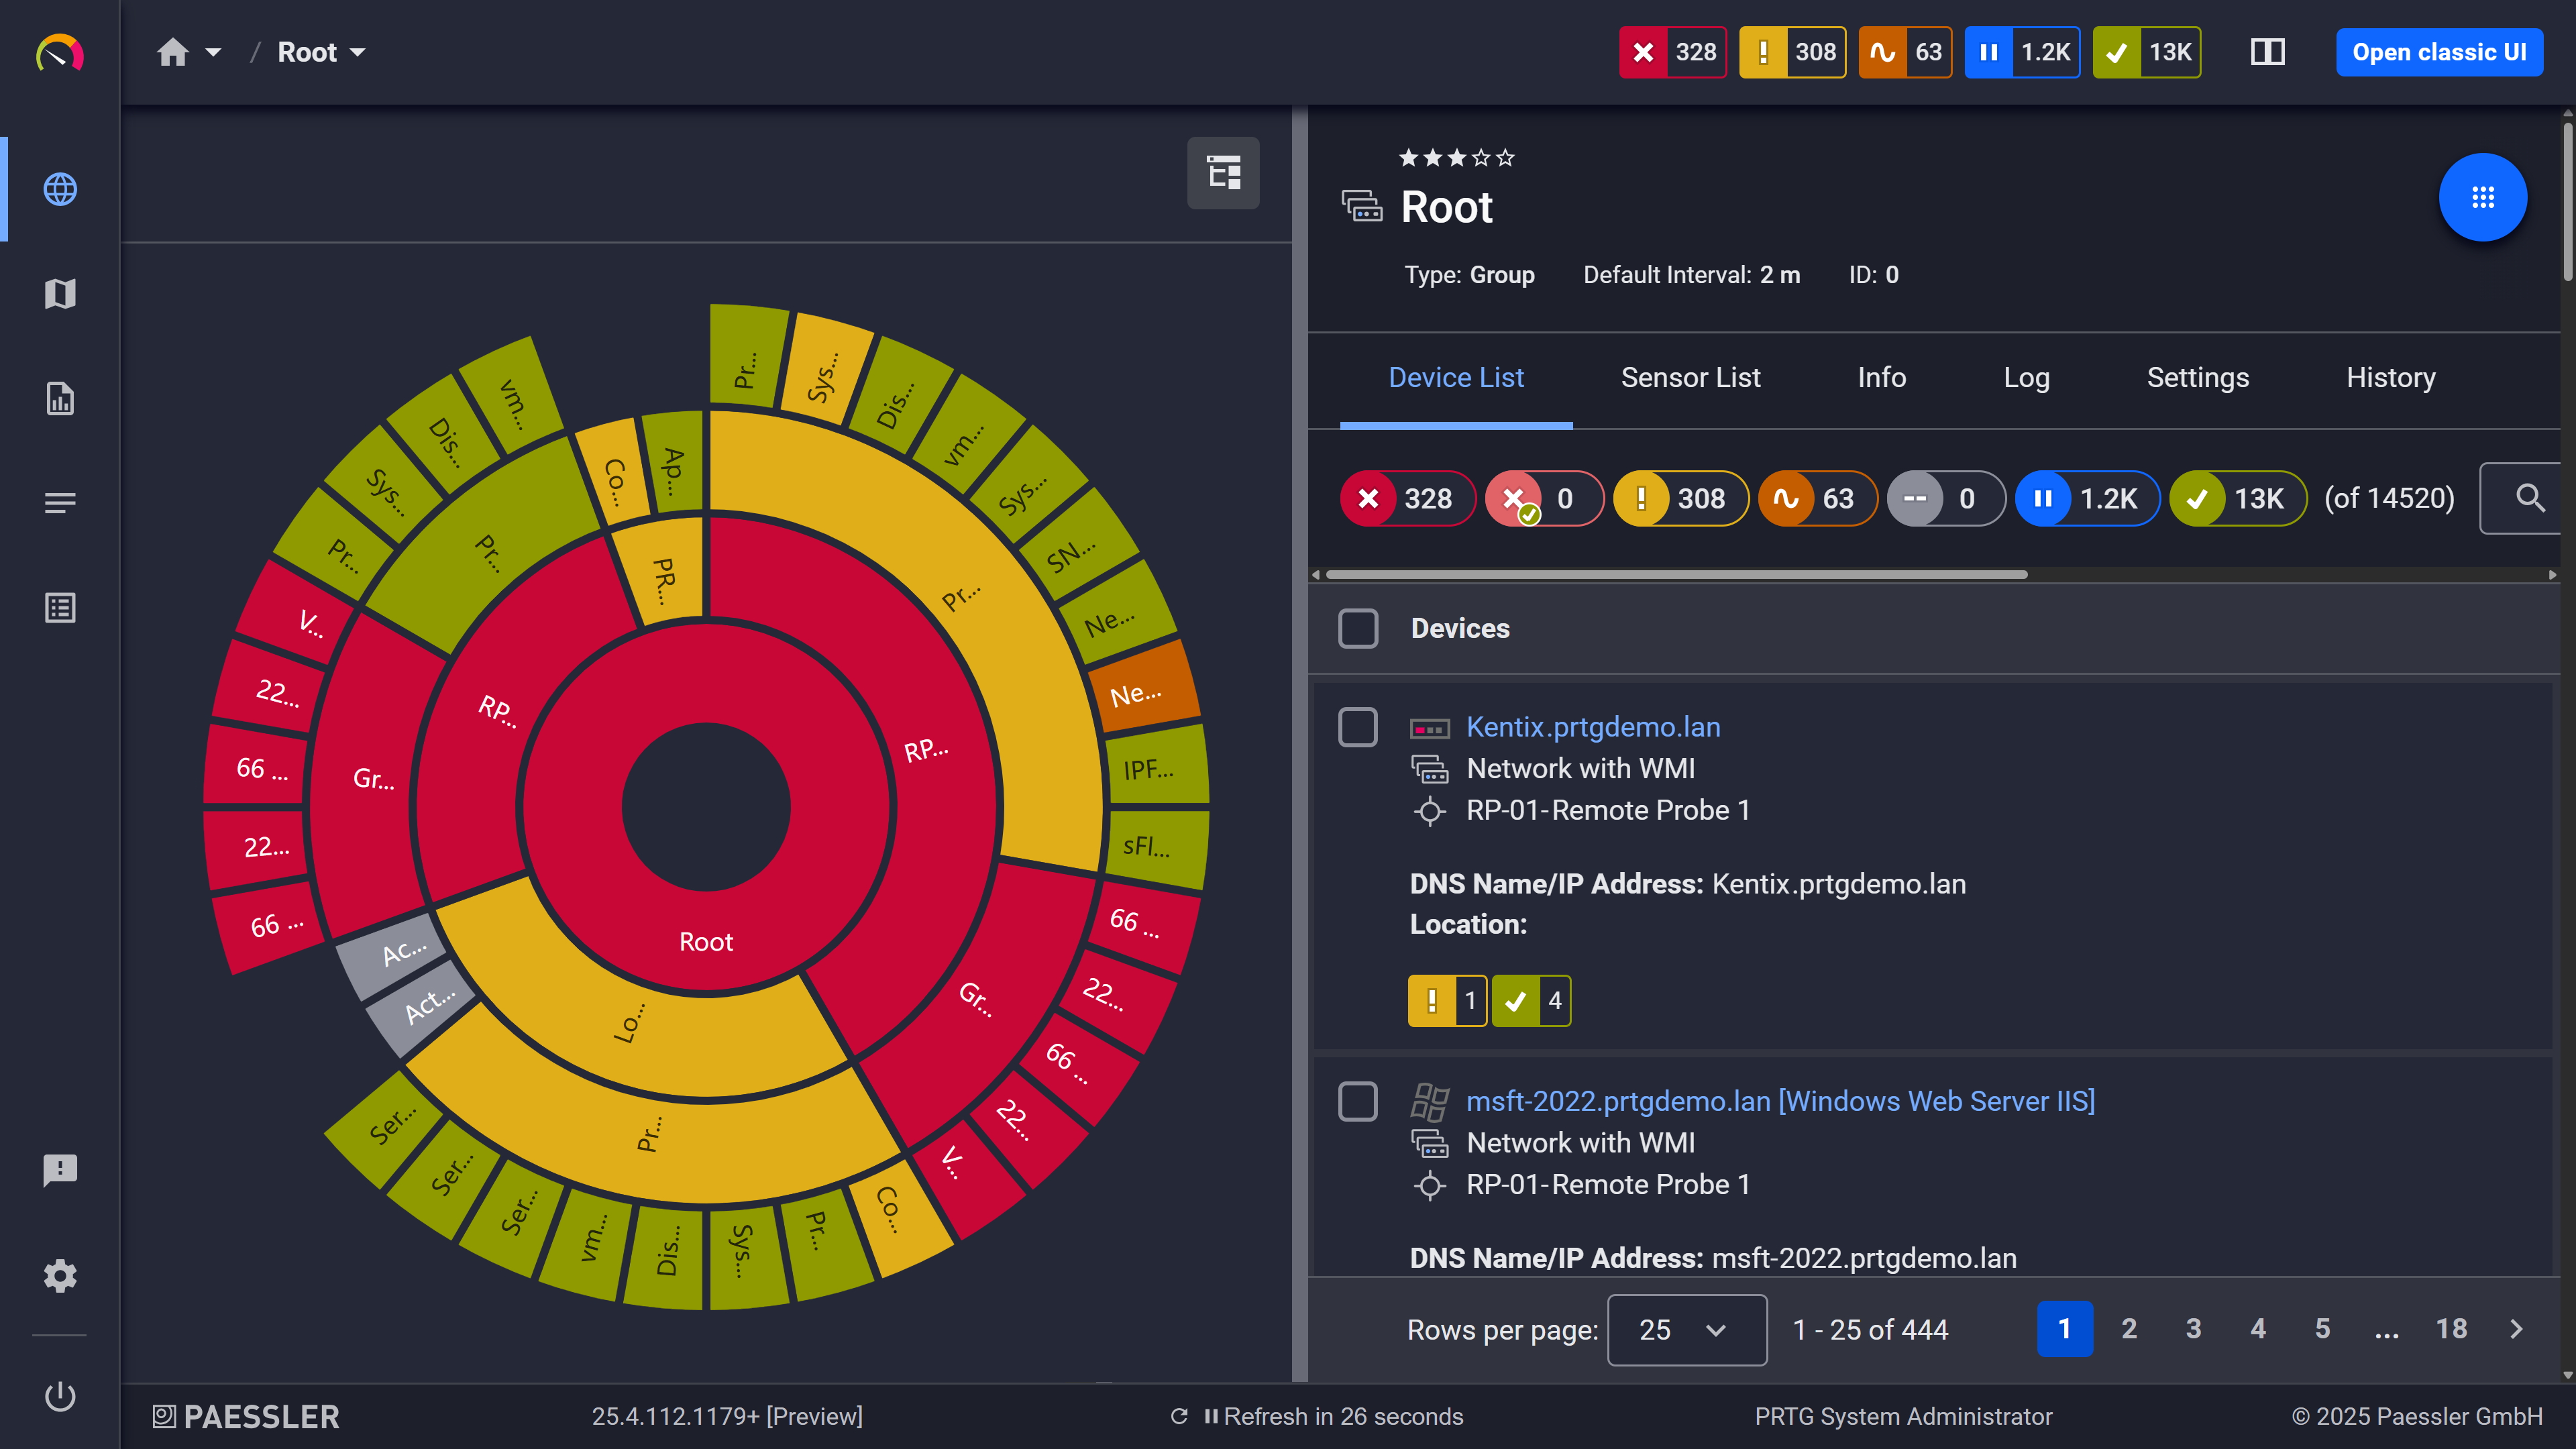
PRTG Device Tree Classic
Sunburst Lori
Home/Welcome Page Paessler PRTG Software
corehealth-classic

Your site, your terms – monitoring that's ready when you are. 

PRTG deploys in hours. Your team is in control from day one. 

Contact Sales

Pre-configured sensors for the infrastructure you actually run 

From standard IT infrastructure to industrial systems, PRTG covers the monitoring scenarios that matter most to Distributed Enterprise IT teams. Here are some of the most relevant sensor types. 

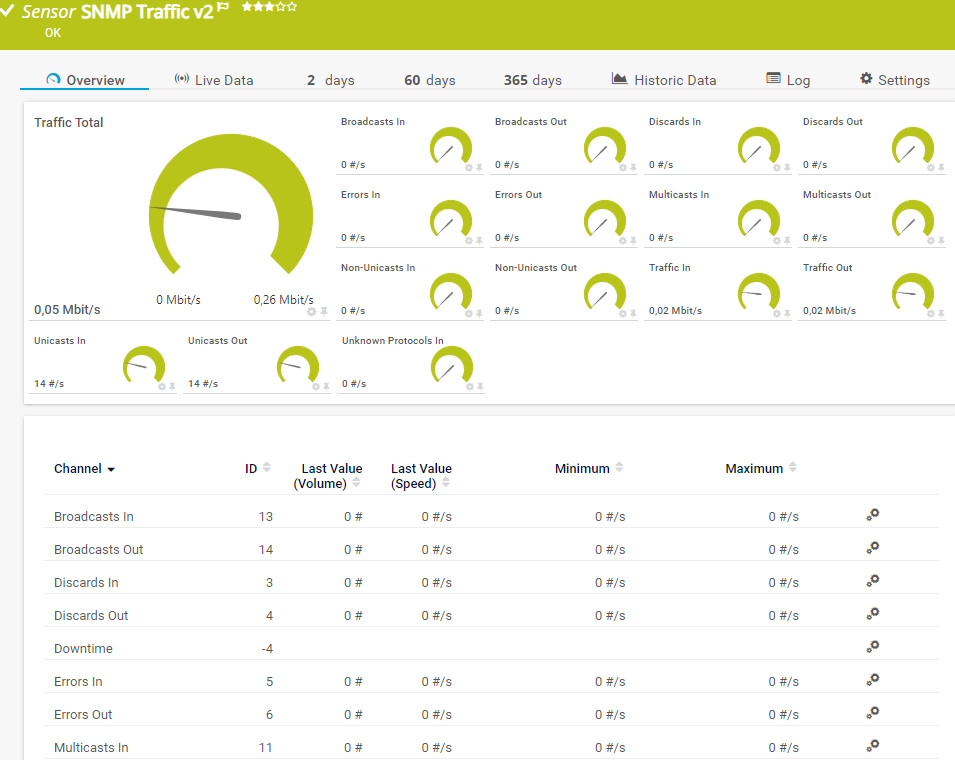
SNMP Traffic v2

The SNMP Traffic v2 sensor monitors bandwidth and traffic on a device. It can show the following:

  • Number of incoming and outgoing broadcast, multicast, unicast, and non-unicast packets
  • Number of incoming and outgoing discards and errors
  • Total, incoming, and outgoing traffic
  • Number of incoming, unknown protocols
SNMP Traffic v2
SNMP Traffic v2

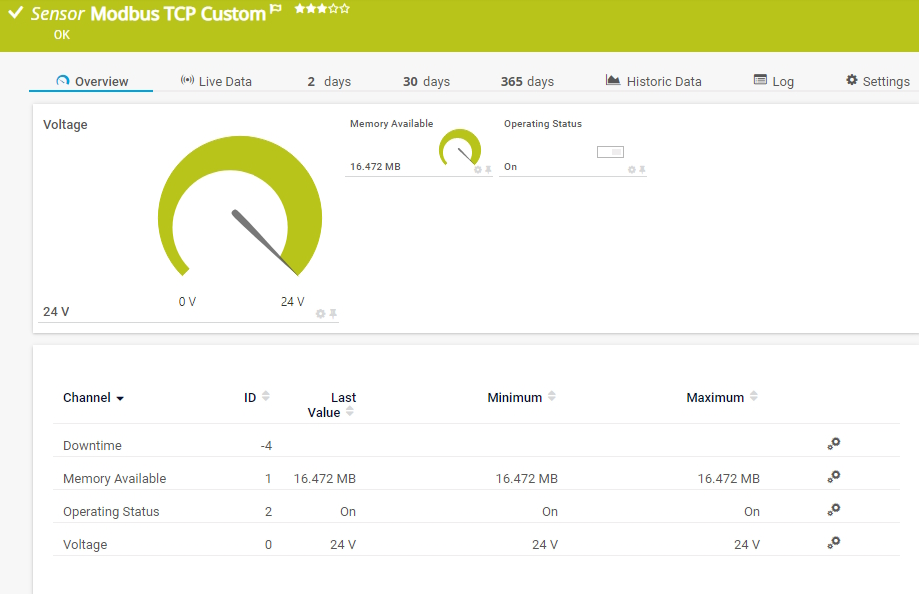
Modbus TCP Custom

The Modbus TCP Custom sensor connects to a Modbus Transmission Control Protocol (TCP) server and monitors up to ten returned numeric values. It can show the following:

  • Downtime
  • Custom numeric values
Modbus TCP Custom
Modbus TCP Custom

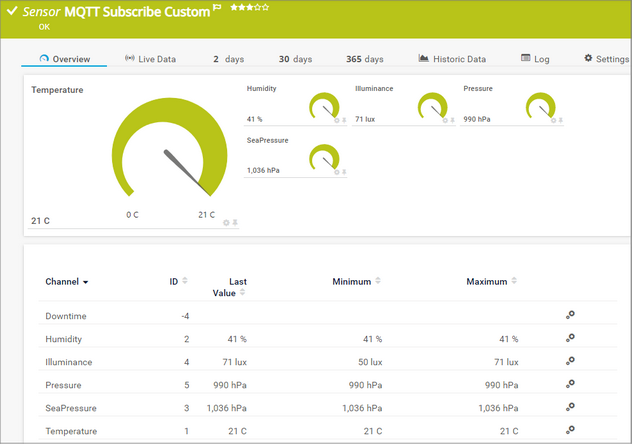
MQTT Subscribe Custom

The MQTT Subscribe Custom sensor subscribes to a Message Queue Telemetry Transport (MQTT) topic and monitors up to ten numeric values from the received JSON data. It can show the following:

  • Downtime
  • Custom numeric values
MQTT Subscribe Custom

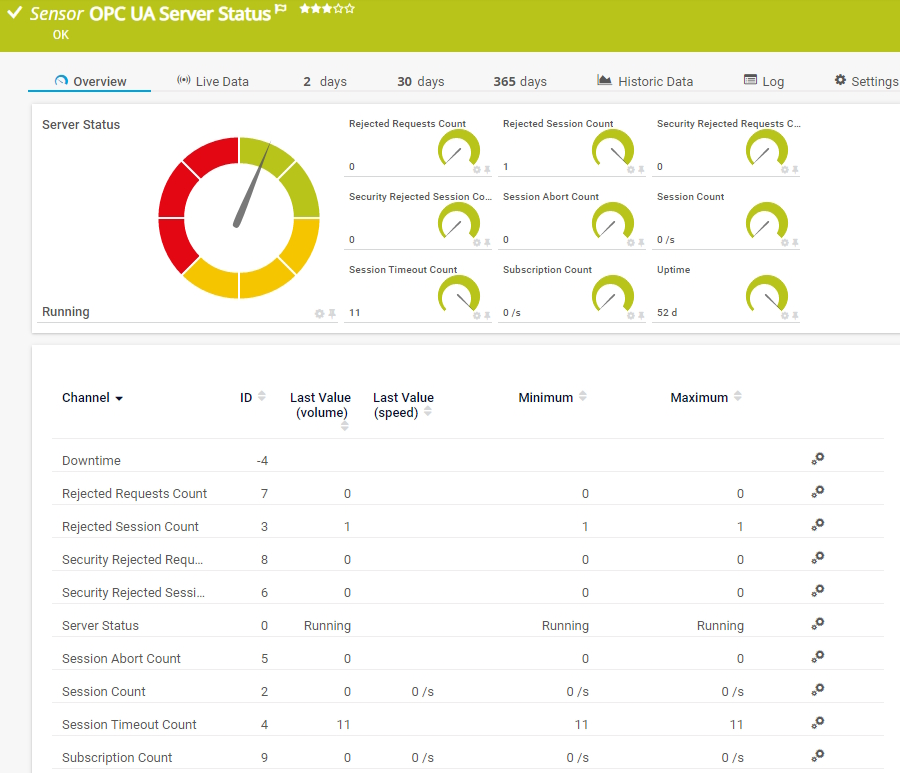
OPC UA Server Status

The OPC UA Server Status sensor monitors the server status, uptime, and diagnostic information of an OPC Unified Architecture (OPC UA) server. It can show the following:

  • Server status
  • Uptime
  • Number of rejected requests and sessions
  • Number of security-rejected requests and sessions
  • Number of subscriptions, sessions, session timeouts, and session aborts
OPC UA Server Status

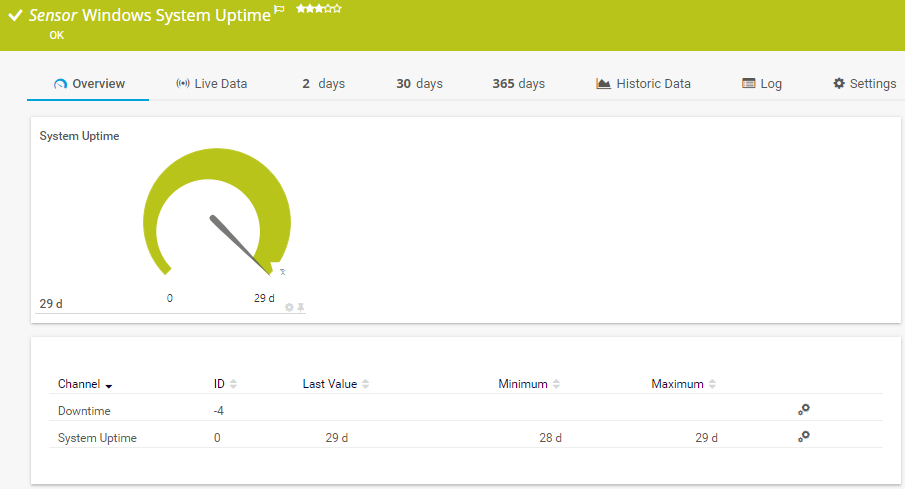
Windows System Uptime

The Windows System Uptime sensor monitors the uptime of a Windows system via Windows Management Instrumentation (WMI) or Windows performance counters. It can show the following:

  • Downtime
  • System uptime
Windows System Uptime

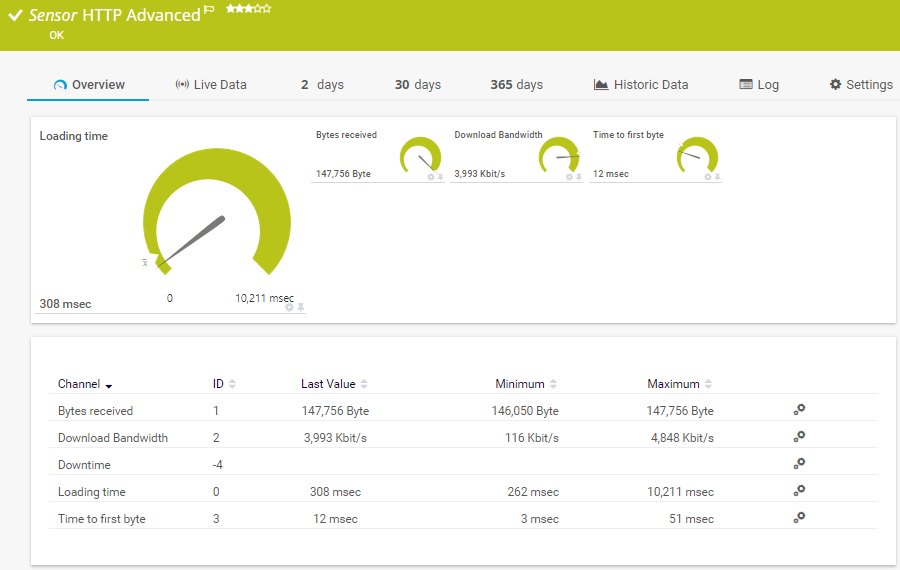
HTTP Advanced

The HTTP Advanced sensor monitors the source code of a web page using HTTP. It supports authentication, content checks, and other advanced parameters. It can show the following:

  • Number of bytes received
  • Download speed
  • Loading time
  • Time to the first byte
HTTP Advanced
HTTP Advanced

See all 250+ sensor types in the PRTG Sensor Manual

Where distributed IT teams use PRTG 

PRTG is flexible enough to work wherever your site operates. Here are the most common deployment environments.

Manufacturing & Plant IT

Monitor your plant’s IT and OT infrastructure together — network switches, industrial PCs, PLCs, SCADA systems, and connected machines. 

Healthcare IT 

Give your hospital wing, clinic network, or regional health system IT team local monitoring visibility — servers, network infrastructure, and medical device connectivity — independent of a central health system’s IT timeline.

University & Campus IT

Monitor campus network infrastructure, Wi-Fi access points, building systems, and application servers — with the flexibility to adapt monitoring as campus needs evolve, without central university IT involvement. 

Retail, Logistics & Distribution 

Keep your distribution center, warehouse, or retail network infrastructure visible and responsive — monitoring local servers, network hardware, and connectivity to ensure operations keep running.

Energy & Utilities IT

Monitor energy management systems, substation networks, and operational technology alongside IT infrastructure — with PRTG’s support for Modbus, MQTT, and SNMP giving you a single view across both domains.

Branch Office IT 

Give your regional office or business unit IT team the monitoring visibility it needs — without the overhead of an enterprise tool. PRTG runs locally, budgets locally, and delivers results your regional leadership can see.

Distributed Enterprise IT teams that trust PRTG 

From manufacturing plants to hospital campuses to regional offices — teams like yours use PRTG to maintain local monitoring control inside larger organizations. 

Dr. Erler Kliniken

When downtime affects patients, not just uptime metrics

Dr. Erler Kliniken relies on PRTG to monitor IT and medical infrastructure 24/7, preventing downtime and ensuring reliable patient care through proactive diagnosis. For a hospital, monitoring isn't an IT nicety — it's part of the care pathway.

Read full case study

Adani Electricity

Powering 3.1 million people leaves no room for blind spots

Adani Electricity Mumbai Limited runs its electricity distribution network's SCADA system on PRTG, now monitoring 300 power substations and more than 1,000 network devices feeding a 900-kilometer fiber network. Built-in alert routing gets the right technician to the right substation, every time — with the setup scaling further every year.

Read full case study

bosch rexroth

Smart factories need smart visibility — from ERP to shop floor

Bosch Rexroth uses PRTG to keep its networked Industry 4.0 production environment running — from ERP and MES systems down to shop-floor sensors — giving engineers the combination of predefined queries and flexible options they need to comprehensively and reliably monitor a complex industrial IT infrastructure.

Read full case study

We appreciate the flexibility of PRTG and how it grows together with the company, supporting our needs to also digitalize the factory floor and monitor not only standard IT infrastructure but also factory equipment.

Sandeep Rai, Network and Security Team Lead
Nobia

When we integrate PRTG from Paessler, we provide a solution that allows the visualization of all industrial and communication components in a single system.

Miguel Ángel López Ávila, General Manager
SE3 (Sistemas Eléctricos y Electrónicos Especializados)

Build your business case for local monitoring 

Need to justify PRTG to regional leadership or a corporate procurement team? These resources can help. 

Resources Solution

Product Demo

See PRTG in a scenario that mirrors a distributed IT deployment — dashboards, local alerts, and OT sensor examples. 

Watch now

Resources Content

Getting Started Guide 

Step-by-step guide for deploying PRTG in your environment — including auto-discovery and first sensor setup. 

Read the guide

Resources Solutions

Talk to an Expert

Talk to a Paessler monitoring expert who understands regional and site IT environments — and can help you build the case internally. 

Get in touch

Frequently Asked Questions

Can I deploy PRTG independently without involving corporate IT?

Yes, PRTG installs on a standard Windows server or workstation at your site. There’s no dependency on central IT infrastructure, and you don’t need corporate IT approval to get started. Your team controls the installation, configuration, and management entirely. 

Will PRTG work alongside our corporate monitoring tools?

Yes, PRTG is designed to complement, not conflict with, central monitoring platforms. It gives your local team the visibility they need independently, while being able to forward alerts and status data to corporate tools via syslog, SNMP traps, email, or webhooks when needed. 

Can PRTG monitor OT and industrial systems as well as standard IT infrastructure?

Yes, PRTG supports industrial protocols including Modbus TCP, MQTT, and OPC UA alongside standard IT protocols like SNMP, WMI, and SSH. This makes it suitable for environments where IT and OT systems coexist — such as manufacturing plants, energy sites, or facilities with building management systems. 

How do we justify PRTG to corporate procurement or leadership?

The strongest arguments are speed and local control. PRTG deploys in hours without professional services, sized with sensor-based licensing to fit a local budget. Most customers find that preventing even one significant outage pays for the tool many times over. Our team can help you build the business case if needed - including ROI framing for regional leadership. 

What does PRTG cost for a local deployment?

PRTG uses sensor-based licensing, so you pay for the number of sensors you use — not the number of users, devices, or sites. A local site deployment covering 100–500 devices is typically a fraction of the cost of an enterprise-wide platform. We will support you in finding the right plan for your environment. 

How much effort does PRTG take to maintain?

PRTG is designed for lean teams. Once deployed and configured, it runs continuously without daily intervention. Alerts notify your team when action is needed. Most teams spend a few hours on initial setup and occasional maintenance — not ongoing admin. No dedicated monitoring engineer is required. 

Can I expand PRTG to other sites later?

Yes. Each site can run its own independent PRTG instance, or you can use remote probes to monitor additional locations from a single central installation. Many teams start with one site and expand as the value becomes visible to regional or divisional leadership. There's no need to renegotiate licensing from scratch - you scale what you already have.

Start with your site. Build the case for the rest. 

Deploy in hours. Show results. When leadership asks how to roll it out to the next location - you'll already have the answer. 
Contact Sales

Products

  • Paessler PRTG
    Paessler PRTGMonitor your whole IT infrastructure
    • PRTG Network Monitor
    • PRTG Enterprise Monitor
    • PRTG Hosted Monitor
    • PRTG UVexplorer
    • PRTG extensions
      Extensions for Paessler PRTGExtend your monitoring to a new level
  • Icon Features
    FeaturesExplore all monitoring features

Monitoring with PRTG

  • Network monitoring
  • Bandwidth monitoring
  • SNMP monitoring
  • Network mapping
  • Wi-Fi monitoring
  • Server monitoring
  • Network traffic analyzer
  • NetFlow monitoring
  • Syslog server

Useful Links

  • PRTG Manual
  • Knowledge Base
  • Customer Success Stories
  • About Paessler
  • Subscribe to newsletter
  • PRTG Support
  • PRTG Consulting
  • PRTG Feedback & Roadmap

Contact

Paessler GmbH
Thurn-und-Taxis-Str. 14, 
90411 Nuremberg 
Germany

[email protected]

+49 911 93775-0

  • Contact us
©2026 Paessler GmbHTerms & ConditionsPrivacy PolicyImprintReport VulnerabilityDownload & InstallSitemap
CCTV CCTV CCTV