• Company
    • About Us
    • Press Center
    • Careers
    • Blog
    • IT Knowledge
    • Contact us
  • Contact us
  • Login
 
  • English
    • Deutsch
    • Español
    • Français
    • Italiano
    • Português
Paessler
                    - The Monitoring Experts
  • Products
    • Paessler PRTG
      Paessler PRTGMonitor your whole IT infrastructure
      • PRTG Network Monitor
      • PRTG Enterprise Monitor
      • PRTG Hosted Monitor
      • PRTG UVexplorer
      • PRTG extensionsExtensions for Paessler PRTGExtend your monitoring to a new level
    • Icon Features
      FeaturesExplore all monitoring features
      • Maps & dashboards
      • Alerts & notifications
      • Multiple user interfaces
      • Distributed monitoring
      • Customizable reporting
  • Solutions
    • By TeamFor your organization size
      • Small Business IT
      • Mid-Market IT
      • Enterprise IT
      • MSP Network Monitoring
    • Industries
      By IndustryFor your business sector
      • Industrial
      • Healthcare
      • Energy
      • Government
      • Education
      • Data Center
      • Finance
    • IT Topics
      By Use CaseFor every technical scenario
      • Network Monitoring
      • Server Monitoring
      • OT Monitoring
      • Distributed Monitoring
      • Network Topology Mapping
      • SNMP Monitoring
      • Bandwidth Monitoring
  • Pricing
  • Resources
    • Getting Started
      Getting StartedModules for self-paced learning
    • How-to Guides
      How-to GuidesGet the most out of PRTG
    • Videos & Webinars
      Videos & WebinarsLearn from Paessler experts
    • Case StudiesProven results across industries
    • PRTG Manual
      PRTG ManualFull documentation
    • Knowledge Base
      Knowledge BaseShare community knowledge
    • PRTG Sensor Hub
      PRTG Sensor HubGet sensors, scripts & templates
    • Trainings
      PRTG TrainingLearn how to work with PRTG
  • Partners
    • Icon Handshake
      Become a PartnerFor resellers and channel partners
    • Icon MSP
      Become an MSPDeliver monitoring as a managed service
    • icon partner
      Partner PortalLog in to your partner account
    • Deal Registration
      Deal RegistrationRegister your sales opportunities
    • icon search
      Find a PartnerFind partners selling Paessler products
    • icon technology
      Technology AlliancesSee Paessler technology partnerships
    • Partner HubTools for Your Success
  • Company
    • About Us
    • Press Center
    • Careers
    • Blog
    • IT Knowledge
    • Contact us
  • Contact us
  • Login
  • English
    • Deutsch
    • Español
    • Français
    • Italiano
    • Português
  • Get a quote
  • Free trial
  1. Home>
  2. By Industry>
  3. Energy

IT/OT monitoring for energy companies, all in a single tool

  • See network health and device status on one screen — not split across separate IT and SCADA dashboards 
  • Simplify NERC CIP, NIS2, and IEC 62443 compliance with continuous monitoring and evidence that your controls are working 24/7 
  • Cut investigations from days to hours and see your network's behavior before an event, right alongside your historian data 
Talk to an expert
Watch a Demo
Overviewchallengesbenefitssensorscustomer storiesFAQ

5 reasons why energy companies monitor IT and OT with PRTG

When a PLC stops responding or a link to a substation drops, the question is always the same: is it network, facility, or process? PRTG brings network, utility, and process data together and when something trips, you see the full picture in one place, not separate systems.

Financial services with PRTG
  • Walk into your next NERC CIP, NIS2, or IEC 62443 audit with evidence already collected from continuous compliance monitoring
  • Spot a failing switch or RTU before it takes down a substation. Modbus, OPC UA, and MQTT monitored alongside IT
  • Catch SCADA and PLC degradation before it hits operations - health and performance monitoring built in
  • Monitor substations and generation sites with no local IT staff needed. Remote probes cover it all
  • Give every team the view they need, from one source of truth, with dashboards built for control room, NOC, and management

Paessler PRTG is trusted by 500,000 users worldwide

Siemens
Truma
Bosch
rexroth
SMS group

The monitoring challenges energy companies face every day

Two semicircular arrows pointing toward each other to form a circle.

No proof after an outage

After an outage, two questions always follow: what caused it, and how do you show NERC CIP, NIS2, or IEC 62443 regulators that it's addressed? PRTG's OPC UA Server feeds network data into your OT stack, so engineering and compliance both get a documented record of what happened. 

Graphic representation of a locked padlock

Compliance documentation built from manual effort 

NERC CIP, NIS2, and IEC 62443 require continuous visibility into critical assets. PRTG gives you the data compliance reporting depends on with asset inventory, uptime history, and alerting. All ready on demand, without assembling logs manually. 

Graphically stylized representation of a computer monitor

Blind dispatch to remote sites 

When a device fails, you need to know what's wrong before a technician drives out. PRTG gives remote visibility into switches, networking equipment, satellite links, cellular quality, RTU health, environmental conditions, access control, and CCTV. 

Graphically stylized representation of a computer monitor

Alarm-to-cause guesswork in the control room 

When a control room alarm fires, operators need to know which device failed. PRTG feeds alarms into your SCADA so one click shows the specific device or segment behind the problem. No bridging between IT dashboards and SCADA required. 

Graphically stylized representation of a computer monitor

Shadow devices on the OT network

A new device can join the SCADA network with no ticket, no updated documentation, no asset record, and IT is the last to know. PRTG closes that visibility gap without opening a new one, with OT network monitoring thats fully air-gapped where required. 

Graphically stylized representation of a computer monitor

OT anomalies with no infrastructure context 

A slow RTU, gaps in historian logs, a stalled SCADA polling cycle. These are often infrastructure problems, not OT problems. PRTG gives control room and SCADA teams visibility into the network and server layer underneath, so odd process behavior comes with an answer. 

Ready to close the IT/OT gap? 

Talk to an expert
Watch a Demo

Why PRTG is the monitoring tool of choice for energy companies

Audit-ready data, without a separate reporting process 

PRTG retains continuous asset status, uptime history, and threshold event logs. All the records NERC CIP, NIS2, and IEC 62443 require. 

  • A continuous record of asset status and threshold events
  • Supports NERC CIP documentation, NIS2 continuity requirements, and IEC 62443 segmentation monitoring
  • No manual log assembly for audits

See every substation, every generation node, all in one place 

Deploy lightweight remote probes at substations and generation sites. They collect data locally and report back centrally, with no local IT staff needed. 

  • Central visibility across all remote sites
  • Instant alerts when a site loses connectivity or a device stops responding
  • No on-site management required

One platform for IT and OT, all without disrupting either 

PRTG monitors servers, switches, and firewalls alongside RTUs, PLCs, and industrial gateways, using read-only, with configurable polling intervals so data collection doesn't disrupt OT operations. 

  • IT and OT data in a single platform
  • Custom dashboard views for IT and OT teams
  • Modbus, OPC UA, and MQTT support with configured sensors

Keep the systems that run your grid visible 

Monitor the IT environment your SCADA, EMS, and historian servers run on, and the data flows between field devices and control systems. 

  • CPU, memory, disk, and availability of control system servers
  • Communication path monitoring between field devices and upstream systems
  • Process and network data reviewed together for faster root-cause investigation

Close the gap between SCADA and network infrastructure 

Network switches, servers, UPS units, and communication devices generate SNMP data your SCADA was never designed to collect. 

  • SNMP events published to your SCADA via PRTG's OPC UA Server, with no custom development required
  • Device failures, link drops, and hardware faults all now part of your operational picture
  • Infrastructure events that once lived outside SCADA's view, all now inside it

Keep your OT network visible and under control 

Monitor firewalls, VPN tunnels, and OT network segmentation devices, and forward syslog data to your SIEM. PRTG complements your security toolchain, it doesn't replace it. 

  • Firewall and VPN availability and performance monitoring
  • Traffic pattern visibility across OT network segments
  • Syslog forwarding to your existing SIEM

Our Users Give Top Ratings for Monitoring With Paessler PRTG

Gartner peer insights
spiceworks
G2
Capterra

What IT/OT monitoring looks like in PRTG for energy companies

Illustration PRTG You entire Environmen in One Place

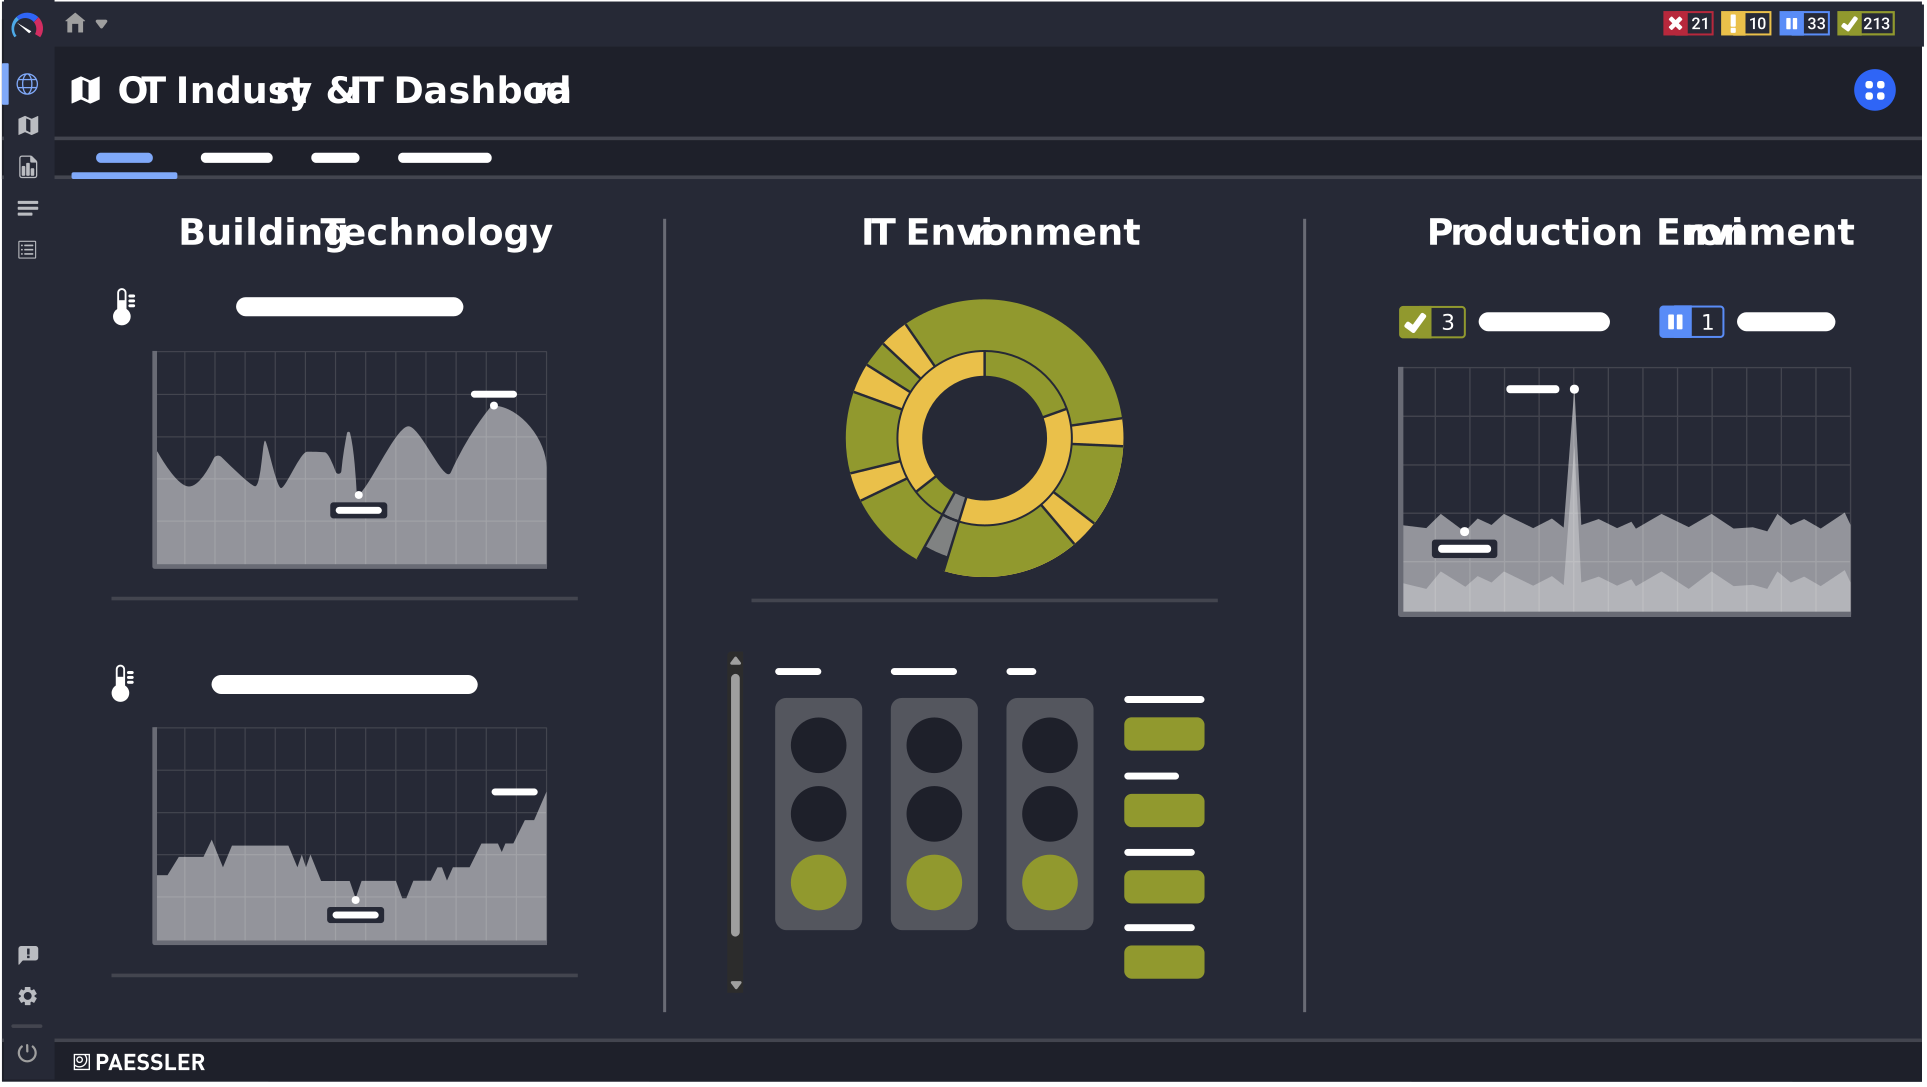
IT and OT data in a single dashboard — building systems, IT environment, and production, side by side
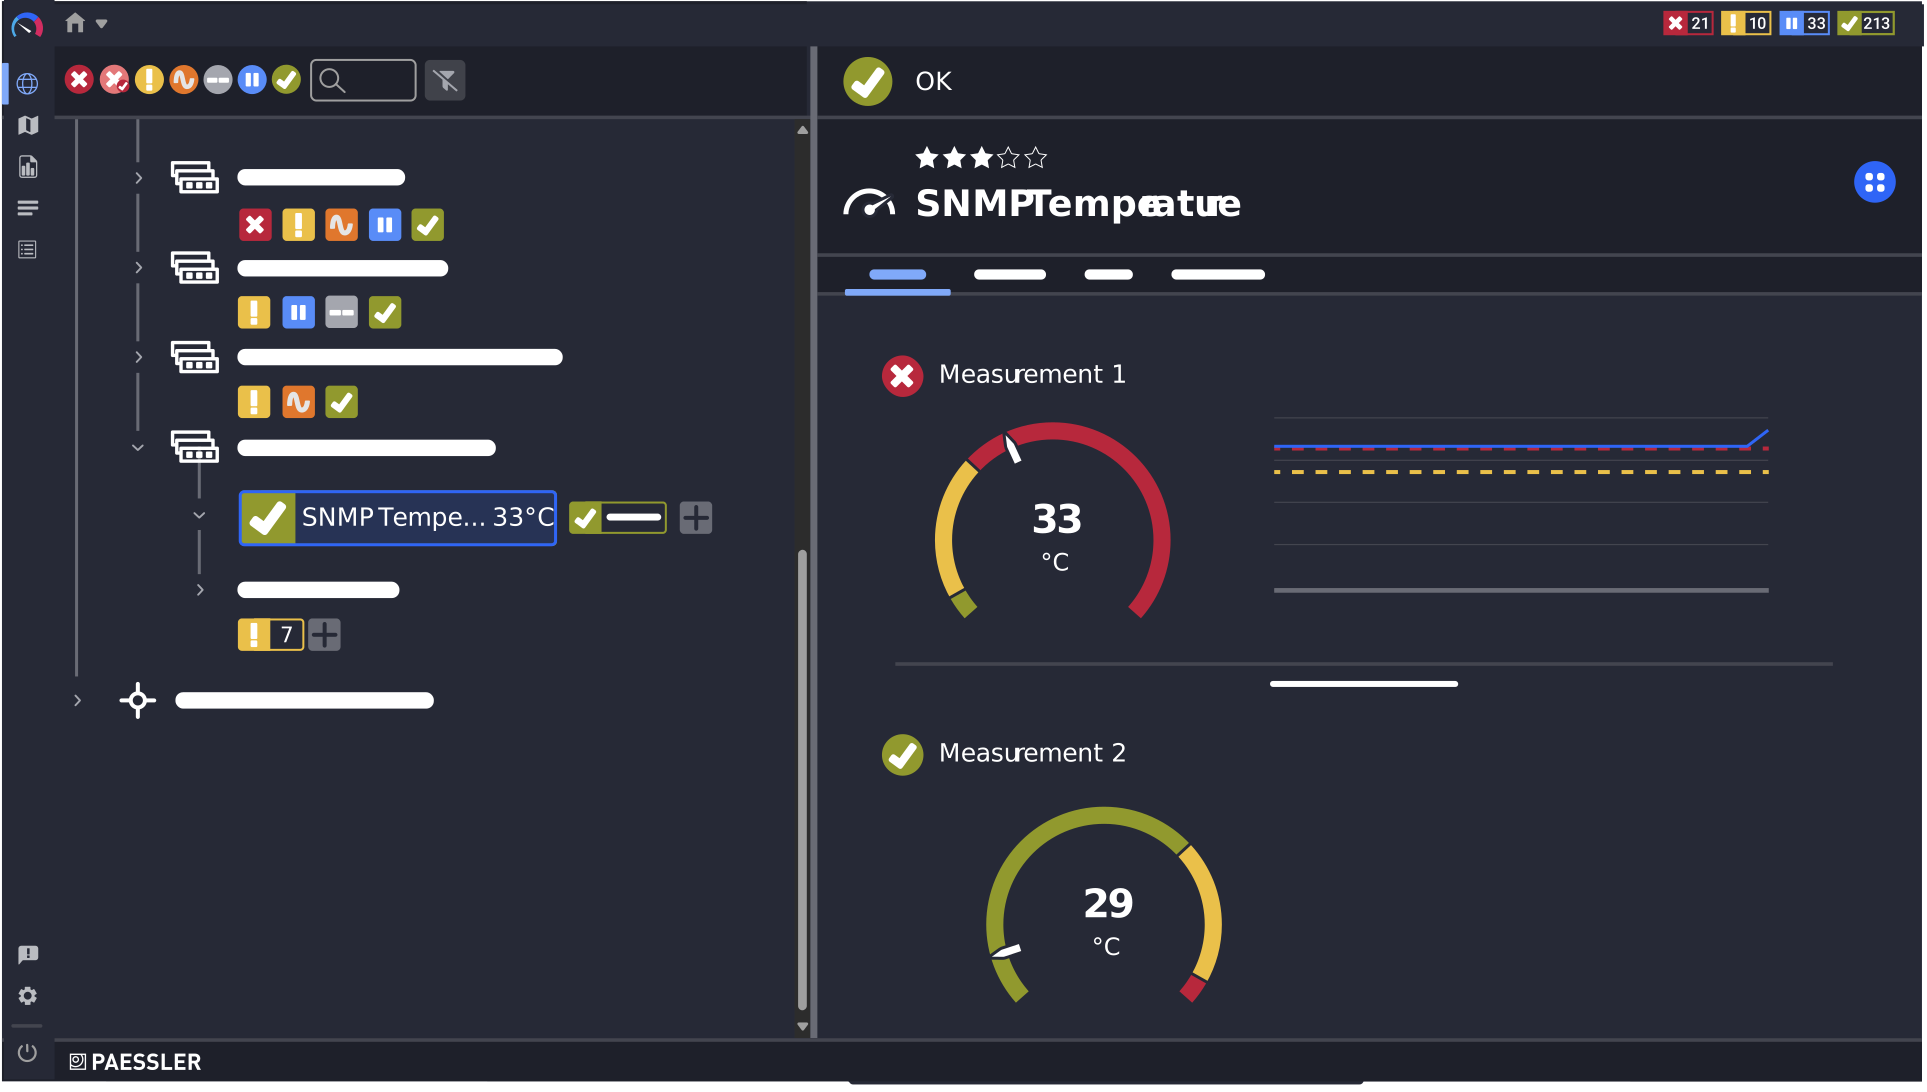
Illustration PRTG Catch Problems before Users notice.svg

SNMP sensor data down to individual measurements, like cabinet temperature
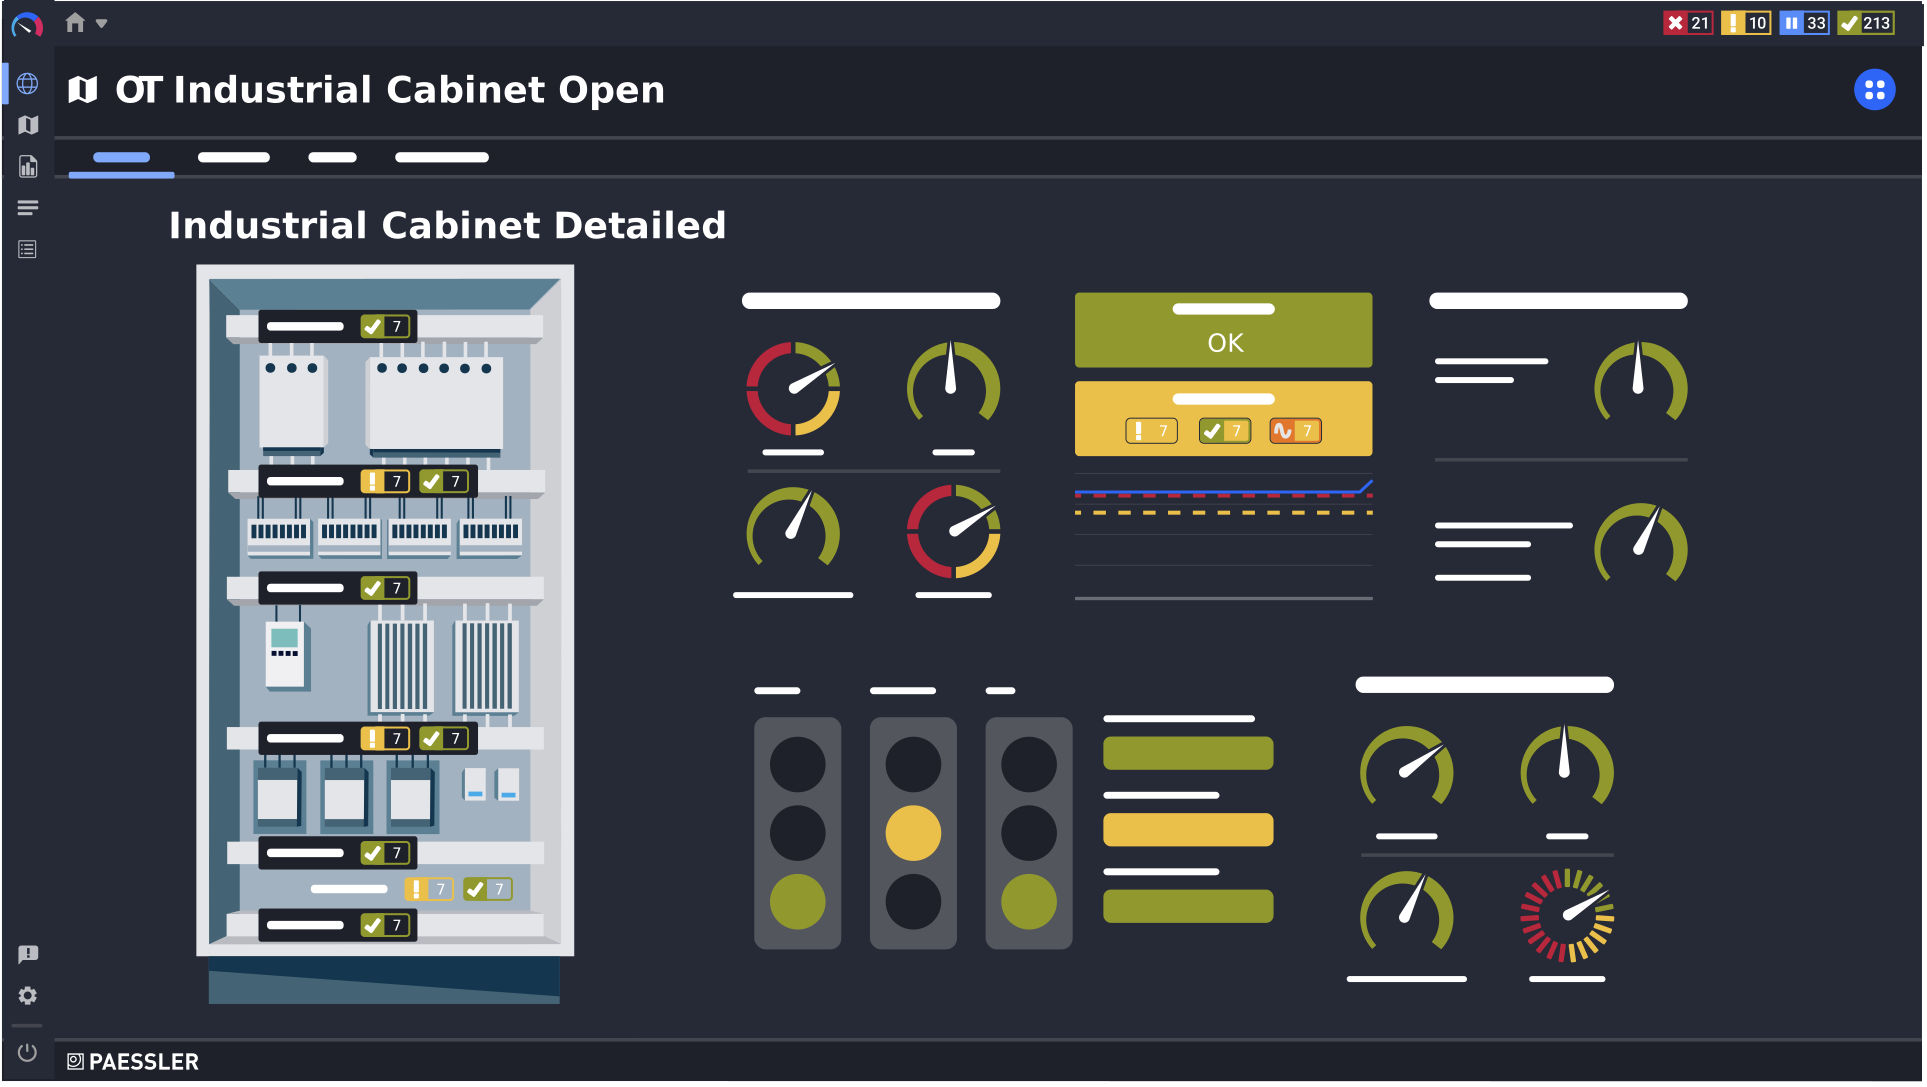
Illustration PRTG Build for Critical Infrastructure

Industrial cabinet status at a glance — every component monitored in one view

Watch how PRTG monitors IT and OT together

Talk to an expert
Watch a Demo

Sensors built for energy environments 

PRTG supports standard IT protocols and OT protocols, including Modbus, OPC UA, MQTT, SIMATIC S7, all configured to your environment. 

Monitoring Topic

PRTG Sensors

What It Monitors

Field devices health status (RTUs, PLCs, critical power equipment) 
  • Modbus RTU Custom, Modbus TCP Custom
  • SIMATIC S7-300/400 CPU Status; SIMATIC S7-300/400 CPU Restart Overview
  • SIMATIC S7-300/400 LED Status; SIMATIC S7-1200/1500 CPU Status
Memory register values, device availability, and response time from Modbus-compatible RTUs, PLCs, and critical power devices 
OPC UA servers 
  • OPC UA Server Status
  • OPC UA Custom
Server status, uptime, rejected requests, and session health 
MQTT brokers and data flows 
  • MQTT Round Trip
  • MQTT Subscribe Custom
Broker availability, round-trip time, and data delivery from MQTT-connected field devices 

See the PRTG Manual for a list of all available sensor types.
PRTG OPC UA Server

Discover our product extension Paessler PRTG OPC UA Server

Bring IT infrastructure data into the SCADA environment. PRTG's OPC UA Server publishes network switch health, server status, and communication link data to any OPC UA-compatible system your Operations teams use.

Find out more

Success stories from energy customers

Companies around the world trust PRTG Network Monitor when it comes to ensuring that their IT systems run smoothly.

Brand logo of Dätwyler

Adani Electricity 

Keeping the Lights On for 3.1 Million People: 300 Substations, One Platform 

Adani Electricity supplies power to 3.1 million consumers across 400 square kilometers of Mumbai. With 300 unmanned substations and a 900 km fiber network to monitor around the clock, they needed a solution that could handle SCADA data, optical parameters, and complex alerting at scale. PRTG met every requirement, and keeps expanding as the grid grows. 

Read full case study 

Brand logo of SMS group

ENGIE Solutions 

25,000 Sensors, 900 Sites, One Unified View 

ENGIE Solutions provides energy and efficiency services across France, and monitors it all with PRTG. When IoT deployments pushed their setup past 25,000 sensors across data centers, remote sites, and wind turbines, they scaled to PRTG Enterprise Monitor. Today, 63 team members rely on a single consolidated dashboard to stay on top of everything, from server health to connected heating systems. 

Read full case study 

Brand logo of Siemens

GRUPOTEC 

Solar Parks Across Three Continents: Monitored from One Control Center 

GRUPOTEC operates 20 solar parks in Spain, the UK, France, Kenya, and beyond. With strict 99% availability SLAs and industrial controllers to monitor alongside IT networks, they needed more than a standard monitoring tool. PRTG with Modbus compatibility and Business Process sensors gives their team in Spain a single view of power generation and network health across every park, wherever it is. 

Read full case study 

Go deeper: IT/OT monitoring resources for energy companies

Keep your healthcare IT healthy with PRTG: DICOM & HL7 sensors

Support IT/OT convergence with holistic monitoring

In Energy companies, the right teams need the right data. Our guide shows how to implement holistic monitoring that brings elements from IT, OT and IIoT into your dashboards.

Download white paper
Two monitors one showing a medical image of a hand, the other one showing the brand icon of PRTG

Use case: Infrastructure monitoring in the energy sector

See how PRTG is used to monitor an energy grid in practice — combining SCADA systems, remote OT devices, and IT infrastructure into one consolidated view. A real-world demonstration with partners, built around the challenges of managing distributed energy infrastructure.

Read the blog post
Learn how to monitor healthcare IT with PRTG: Tutorial videos

Mind your Blind Spots — The challenges of IT/OT convergence

Watch this on-demand webinar to understand where IT and OT monitoring gaps occur — and how a unified approach closes them. Relevant for energy teams managing both control systems and IT infrastructure across distributed sites.

Watch the webinar

Energy IT/OT monitoring: FAQ 

What is IT/OT convergence in energy?

IT manages servers, networks, and applications, while OT manages SCADA, RTUs, PLCs, and field devices — traditionally with little visibility into each other's environment. That blind spot shows up worst during an incident. 
PRTG bridges the gap in both directions: IT gains visibility into industrial controllers, while PRTG's OPC UA Server feeds infrastructure data directly into the SCADA dashboards and historians OT already uses, with no new tool required. 

What OT protocols does PRTG support?

Modbus (Modbus RTU Custom and Modbus TCP Custom), OPC UA, MQTT, and SIMATIC S7 - alongside all standard IT protocols (SNMP, WMI, SSH, REST APIs). OT sensors are designed for you to customize them to match your device.

Can PRTG help with NERC CIP, NIS2, or IEC 62443?

PRTG automatically maintains the asset visibility, uptime history, and threshold event records that NERC CIP, NIS2, and IEC 62443 auditors ask for, making reporting available when you need it, scheduled or on demand

How does PRTG monitor remote and unmanned substations?

A lightweight monitoring probe deploys at each site, collects data locally, and reports back to your central PRTG core server, with no local IT staff needed to manage it day-to-day. The core server can be deployed on your air-gapped OT network, or your enterprise network, entirely depending on your security requirements.

Does PRTG monitoring manage OT systems?

No. PRTG is agentless, and uses read-only versions of Modbus, OPC UA, MQTT, SNMP. It does not write to or command field devices.

What is a sensor in PRTG?

One sensor monitors one measured value. A switch port's traffic, a server's CPU load, or a Modbus register value. Our users typically configure 5–10 sensors per device.

PRTG Logo

Questions about your setup? Let's talk 

Talk to an expert
Watch a Demo

Products

  • Paessler PRTG
    Paessler PRTGMonitor your whole IT infrastructure
    • PRTG Network Monitor
    • PRTG Enterprise Monitor
    • PRTG Hosted Monitor
    • PRTG UVexplorer
    • PRTG extensions
      Extensions for Paessler PRTGExtend your monitoring to a new level
  • Icon Features
    FeaturesExplore all monitoring features

Monitoring with PRTG

  • Network monitoring
  • Bandwidth monitoring
  • SNMP monitoring
  • Network mapping
  • Wi-Fi monitoring
  • Server monitoring
  • Network traffic analyzer
  • NetFlow monitoring
  • Syslog server

Useful Links

  • PRTG Manual
  • Knowledge Base
  • Customer Success Stories
  • About Paessler
  • Subscribe to newsletter
  • PRTG Support
  • PRTG Consulting
  • PRTG Feedback & Roadmap

Contact

Paessler GmbH
Thurn-und-Taxis-Str. 14, 
90411 Nuremberg 
Germany

[email protected]

+49 911 93775-0

  • Contact us
©2026 Paessler GmbHTerms & ConditionsPrivacy PolicyImprintTrust CenterDownload & InstallSitemap
Contact Contact Contact