• Company
    • About Us
    • Case Studies
    • Press Center
    • Careers
    • Blog
    • Contact us
  • Contact us
  • Login
 
  • English
    • Deutsch
    • Español
    • Français
    • Italiano
    • Português
Paessler
                    - The Monitoring Experts
  • Products
    • Paessler PRTG
      Paessler PRTGMonitor your whole IT infrastructure
      • PRTG Network Monitor
      • PRTG Enterprise Monitor
      • PRTG Hosted Monitor
      • PRTG UVexplorer
      • PRTG extensionsExtensions for Paessler PRTGExtend your monitoring to a new level
    • Icon Features
      FeaturesExplore all monitoring features
      • Maps & dashboards
      • Alerts & notifications
      • Multiple user interfaces
      • Distributed monitoring
      • Customizable reporting
  • Solutions
    • By TeamFor your organization size
      • Small Business IT
      • Mid-Market IT
      • Enterprise IT
      • MSP Network Monitoring
    • Industries
      By IndustryFor your business sector
      • Industrial
      • Healthcare
      • Government
      • Education
      • Data Center
      • Finance
    • IT Topics
      By Use CaseFor every technical scenario
      • Network Monitoring
      • Server Monitoring
      • OT Monitoring
      • Distributed Monitoring
      • Network Topology Mapping
      • SNMP Monitoring
      • Bandwidth Monitoring
  • Pricing
  • Resources
    • Getting Started
      Getting StartedModules for self-paced learning
    • How-to Guides
      How-to GuidesGet the most out of PRTG
    • Videos & Webinars
      Videos & WebinarsLearn from Paessler experts
    • IT  Knowledge
      IT KnowledgeExpand your IT knowledge
    • PRTG Manual
      PRTG ManualFull documentation
    • Knowledge Base
      Knowledge BaseShare community knowledge
    • PRTG Sensor Hub
      PRTG Sensor HubGet sensors, scripts & templates
    • Trainings
      PRTG TrainingLearn how to work with PRTG
  • Partners
    • Icon Handshake
      Become a PartnerFor resellers and channel partners
    • Icon MSP
      Become an MSPDeliver monitoring as a managed service
    • icon partner
      Partner PortalLog in to your partner account
    • Deal Registration
      Deal RegistrationRegister your sales opportunities
    • icon search
      Find a PartnerFind partners selling Paessler products
    • icon technology
      Technology AlliancesSee Paessler technology partnerships
    • Partner HubTools for Your Success
  • Company
    • About Us
    • Case Studies
    • Press Center
    • Careers
    • Blog
    • Contact us
  • Contact us
  • Login
  • English
    • Deutsch
    • Español
    • Français
    • Italiano
    • Português
  • Get a quote
  • Free trial
  1. Home>
  2. Company>
  3. Case Studies>
  4. ENGIE Solutions

ENGIE Solutions Scales to 25,000+ Sensors Without Losing Sight of the Bigger Picture

Challenge: Outgrowing a single PRTG instance while maintaining real-time visibility

download PDF
Logo Company ENGIE Solutions

COMPANY
ENGIE Solutions

INDUSTRY
Energy & Utilities

COMPANY SIZE
Enterprise

COUNTRY
France

SCALE
900+ sites, two data centers, IoT infrastructure

Icon Sensor

25,000+ sensors across IT and IoT infrastructure

Icon Monitoring

900+ agencies and facilities monitored

Icon Team

63 team members using PRTG daily

The problem

ENGIE Solutions provides energy and efficiency services to businesses and communities across France. Its IT team used PRTG to monitor servers, storage, and applications across two data centers and 900+ sites.

Then the scope changed. In 2018, the company began deploying IoT equipment at scale: meters, thermostats, connected heating systems, and wind turbines, at remote locations and customer premises.

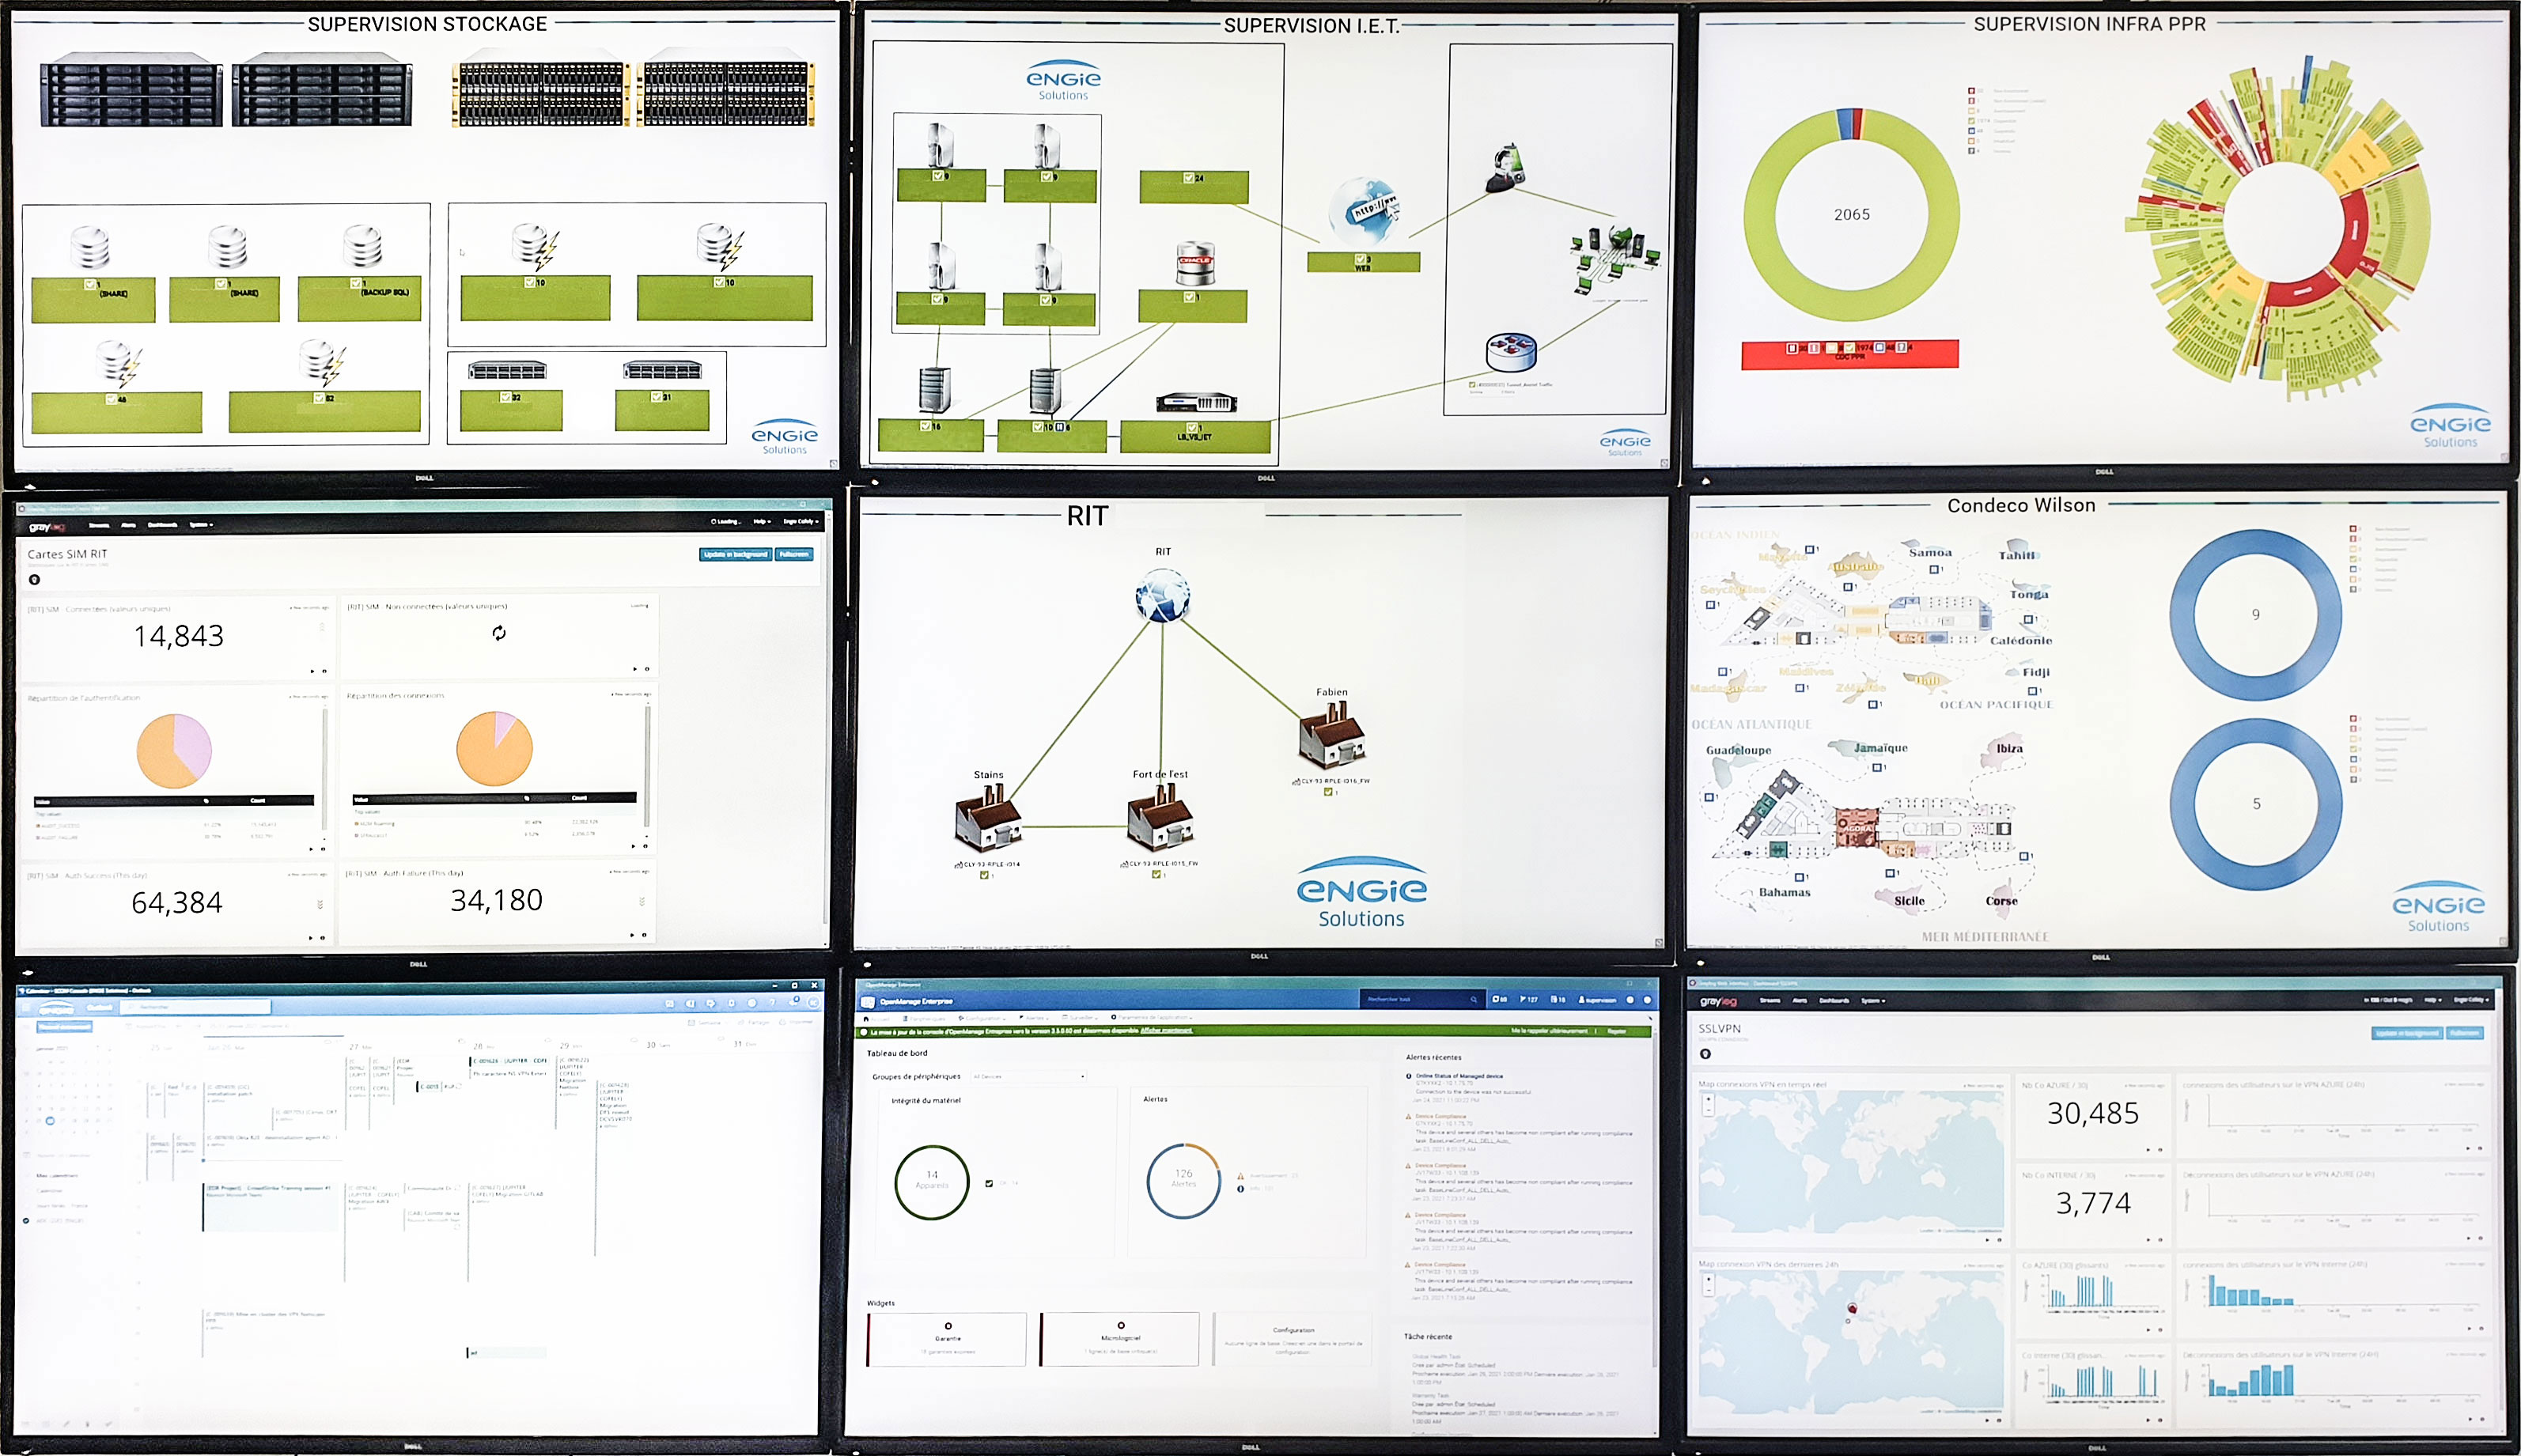
By late 2020, the team had 25,000 sensors in place and expected 15,000 more. The single-server setup was at capacity. Scaling meant risking the unified view their IT room's nine screens depended on.

What changed with PRTG

The team migrated to PRTG Enterprise Monitor, built for large-scale deployments with a flexible membership-based license.

The key addition: ITOps Board. It runs multiple PRTG servers in parallel while delivering one consolidated dashboard. From a high-level overview to individual sensor data, everything is visible without switching tools.

With 63 daily users, the team builds custom sensors via the PRTG API and REST APIs integrated into CI/CD pipelines. SQL queries, Elasticsearch filtering, and MIB management are routine.

Automation became central. New virtual machines trigger automatic sensor deployment. Anomalies send alerts to the responsible provider, no manual step required.

SLA management improved. The team tracks performance for ENGIE Direct, their customer-facing platform, and shares visibility with colleagues, partners, and customers through PRTG reporting.

The challenge for large organizations is to successfully monitor tens of thousands of elements in real time, and ensure that they are performing well, without drowning in a flood of information. ITOps Board solves the problem by providing that essential consistency, especially since PRTG “oversees” other monitoring solutions in an overall merging of dashboards that organizes all the information, from the global level to the most granular. It's a real help in our ongoing quest for simplification.

Guillaume Baudry, Network Architect
ENGIE Solutions
PRTG Logo

PRTG monitors large-scale IT and IoT infrastructure — from data centers to wind turbines — from one platform.

CONTACT SALES
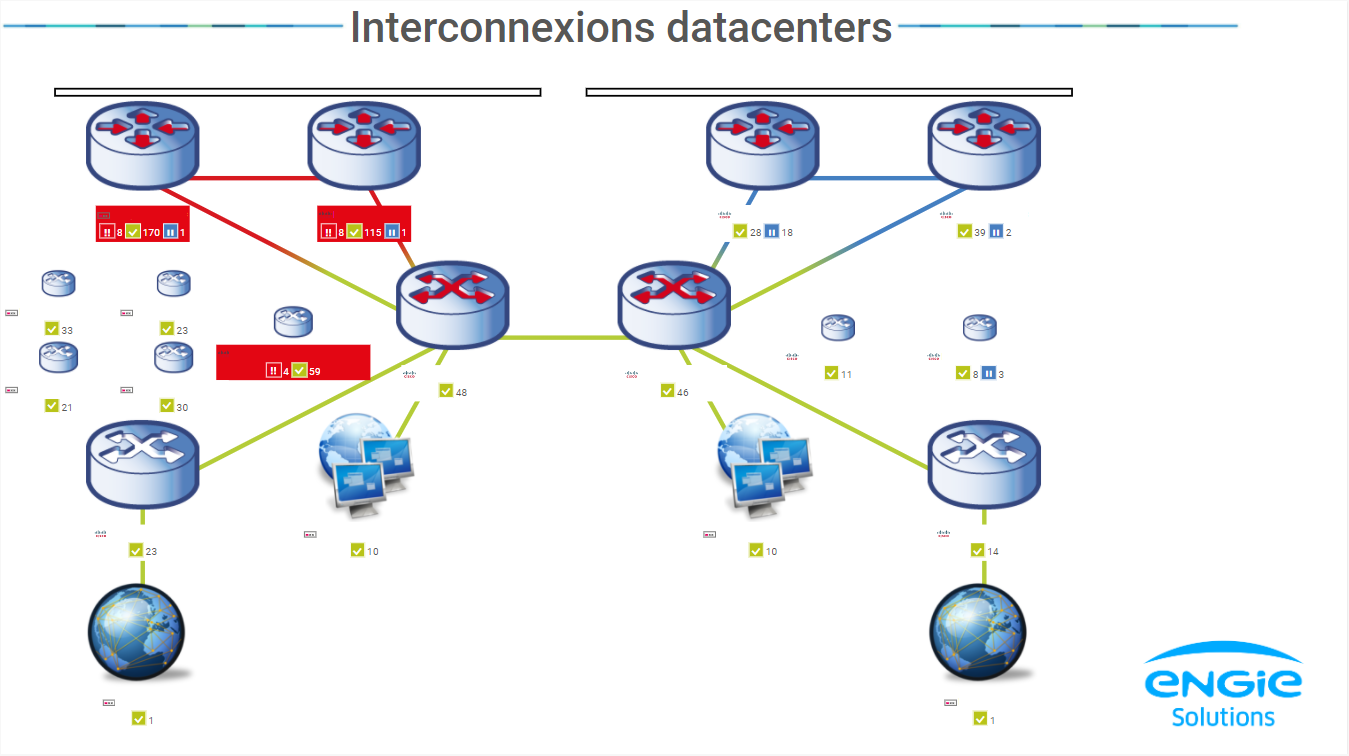
case study engie solutions interconnexions datacenters
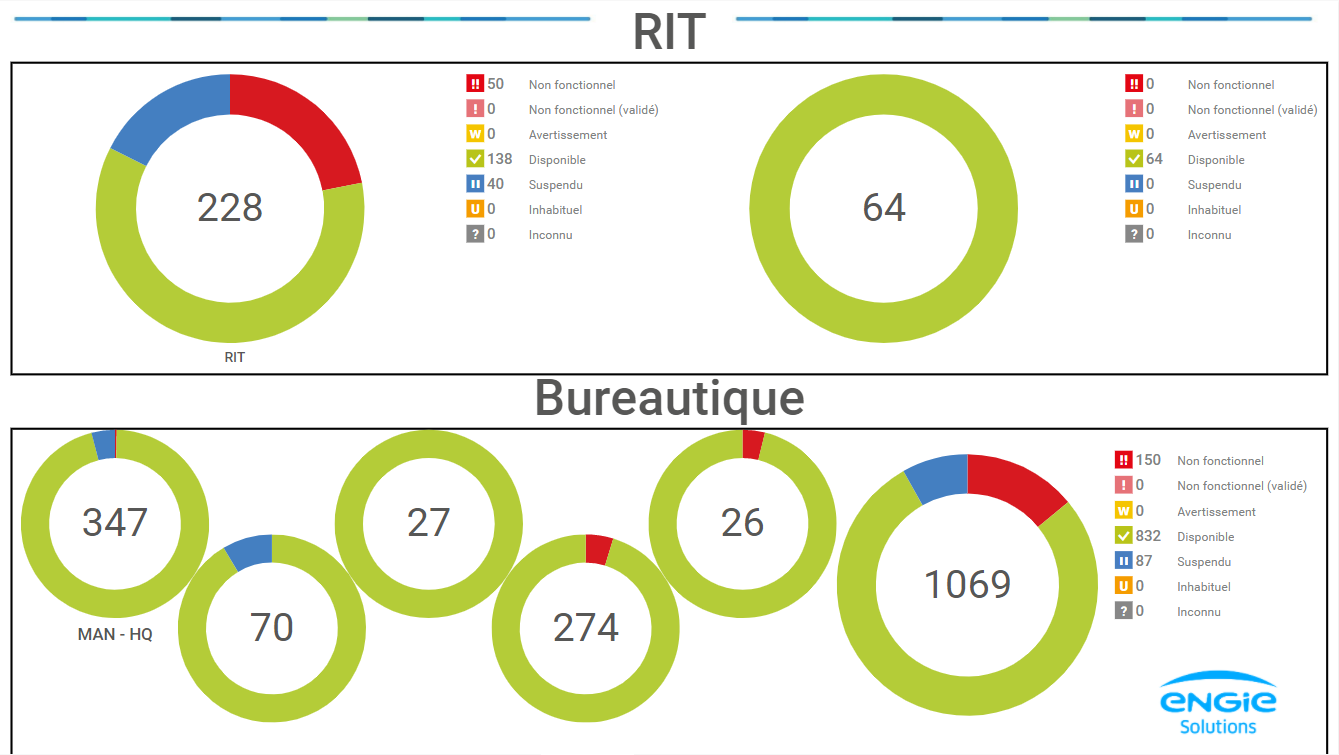
case study engie solutions IoT and office automation monitoring
case study engie solutions dashboards

Discover more monitoring insights and stories

Solution illustration

Solutions for all your monitoring needs

  • Google Cloud Monitoring
  • SNMP Monitoring
  • Application Monitoring
Content illustration

Powerful stories from the monitoring world

  • Customer success stories - Paessler
  • ENGIE Solutions improves monitoring of its large IT and IoT ...
  • Customer success story Process Automation Solutions
Support illustration

Resources to master your monitoring challenges

  • PRTG Engine ID
  • Following PRTG update, "Failed to connect. "Please check the SSH ...
  • SFTP/SSH : Invalid key exchange algorithm error - Paessler Helpdesk
Explore All Case Studies

Products

  • Paessler PRTG
    Paessler PRTGMonitor your whole IT infrastructure
    • PRTG Network Monitor
    • PRTG Enterprise Monitor
    • PRTG Hosted Monitor
    • PRTG UVexplorer
    • PRTG extensions
      Extensions for Paessler PRTGExtend your monitoring to a new level
  • Icon Features
    FeaturesExplore all monitoring features

Monitoring with PRTG

  • Network monitoring
  • Bandwidth monitoring
  • SNMP monitoring
  • Network mapping
  • Wi-Fi monitoring
  • Server monitoring
  • Network traffic analyzer
  • NetFlow monitoring
  • Syslog server

Useful Links

  • PRTG Manual
  • Knowledge Base
  • Customer Success Stories
  • About Paessler
  • Subscribe to newsletter
  • PRTG Support
  • PRTG Consulting
  • PRTG Feedback & Roadmap

Contact

Paessler GmbH
Thurn-und-Taxis-Str. 14, 
90411 Nuremberg 
Germany

[email protected]

+49 911 93775-0

  • Contact us
©2026 Paessler GmbHTerms & ConditionsPrivacy PolicyImprintReport VulnerabilityDownload & InstallSitemap
Paessler PRTG Paessler PRTG Paessler PRTG