• Company
    • About Us
    • Case Studies
    • Press Center
    • Careers
    • Blog
    • Contact us
  • Contact us
  • Login
 
  • English
    • Deutsch
    • Español
    • Français
    • Italiano
    • Português
Paessler
                    - The Monitoring Experts
  • Products
    • Paessler PRTG
      Paessler PRTGMonitor your whole IT infrastructure
      • PRTG Network Monitor
      • PRTG Enterprise Monitor
      • PRTG Hosted Monitor
      • PRTG UVexplorer
      • PRTG extensionsExtensions for Paessler PRTGExtend your monitoring to a new level
    • Icon Features
      FeaturesExplore all monitoring features
      • Maps & dashboards
      • Alerts & notifications
      • Multiple user interfaces
      • Distributed monitoring
      • Customizable reporting
  • Solutions
    • By TeamFor your organization size
      • Small Business IT
      • Mid-Market IT
      • Enterprise IT
      • MSP Network Monitoring
    • Industries
      By IndustryFor your business sector
      • Industrial
      • Healthcare
      • Government
      • Education
      • Data Center
      • Finance
    • IT Topics
      By Use CaseFor every technical scenario
      • Network Monitoring
      • Server Monitoring
      • OT Monitoring
      • Distributed Monitoring
      • Network Topology Mapping
      • SNMP Monitoring
      • Bandwidth Monitoring
  • Pricing
  • Resources
    • Getting Started
      Getting StartedModules for self-paced learning
    • How-to Guides
      How-to GuidesGet the most out of PRTG
    • Videos & Webinars
      Videos & WebinarsLearn from Paessler experts
    • IT  Knowledge
      IT KnowledgeExpand your IT knowledge
    • PRTG Manual
      PRTG ManualFull documentation
    • Knowledge Base
      Knowledge BaseShare community knowledge
    • PRTG Sensor Hub
      PRTG Sensor HubGet sensors, scripts & templates
    • Trainings
      PRTG TrainingLearn how to work with PRTG
  • Partners
    • Icon Handshake
      Become a PartnerFor resellers and channel partners
    • Icon MSP
      Become an MSPDeliver monitoring as a managed service
    • icon partner
      Partner PortalLog in to your partner account
    • Deal Registration
      Deal RegistrationRegister your sales opportunities
    • icon search
      Find a PartnerFind partners selling Paessler products
    • icon technology
      Technology AlliancesSee Paessler technology partnerships
    • Partner HubTools for Your Success
  • Company
    • About Us
    • Case Studies
    • Press Center
    • Careers
    • Blog
    • Contact us
  • Contact us
  • Login
  • English
    • Deutsch
    • Español
    • Français
    • Italiano
    • Português
  • Get a quote
  • Free trial
  1. Home>
  2. By Team>
  3. Mid-Market IT

Powerful IT monitoring that grows with you

  • One platform for on-premises servers, cloud services, and network devices — no tool switching 
  • Catch issues before they become outages — threshold-based alerts, your team acts first
  • One dashboard for your whole environment — built once, not rebuilt every quarter
Contact Sales

Trusted by regional and site-based IT teams at manufacturers, hospitals, universities, retailers, and more - worldwide. 

customer success stories

What customers say about us

Why mid-market IT teams choose PRTG

Your IT environment is growing — more sites, more cloud, more stakeholders demanding visibility. PRTG gives mid-market IT teams unified control across their entire infrastructure, without adding management overhead.

Mid-Market IT
  • Monitor network, servers, cloud, and applications — all from one installation
  • Scales from 100 to thousands of sensors — no dedicated monitoring team required
  • Auto-discovery and 250+ pre-configured sensors get you up and running in hours
  • Dashboards and reports that give IT leadership clear visibility — no manual compiling required
  • No consultants, no lengthy deployment — managed by your own team from day one

The monitoring problem that mid-marked IT teams face every day

Most monitoring tools were built for either small teams or large enterprises. Mid-market IT teams fit neither box.

Icon Lightning

Blind spots across a fragmented environment 

As you add offices, cloud workloads, and remote sites, your IT environment fragments. No single view means your team switches between tools — and blind spots create outage risk that goes undetected until users notice.

Icon Lightning

Reactive firefighting that erodes confidence 

When problems are reported by users instead of caught by your monitoring, your team goes into reactive mode. Leadership loses confidence. Strategic work never happens.

Icon Lightning

IT's value is invisible — until something breaks

Leadership needs to see uptime, performance, and ROI — not just hear about it after an incident. Without clear dashboards and structured reporting, IT stays invisible to the business until something goes wrong.

Monitoring built for the complexity you actually have

PRTG is built for the complexity you actually have – without the overhead you can’t afford.

Immediate visibility — from day one

  • Auto-discovery maps your network and adds devices automatically across all sites
  • 250+ pre-configured sensors start monitoring immediately — servers, switches, cloud, apps
  • Deploy in hours without professional services or specialist training

Multi-site monitoring in one place 

  • Monitor all your offices, data centers, remote sites, and cloud services from a single interface
  • Remote probes extend PRTG's reach to distributed locations without additional server infrastructure
  • Consistent monitoring configuration across all sites — no per-site setup required

Dashboards leadership actually understands

  • Customizable operational dashboards give clear view of infrastructure health across your environment
  • Built-in reporting on uptime, performance trends, and alert history - ready to share without manual work
  • Color-coded status maps make it easy to brief leadership on IT health at a glance

Catch problems before they escalate 

  • Threshold-based alerts via email, SMS, push notifications, or tools like Teams and Slack
  • Dependency-aware alerting reduces noise — so your team focuses on what actually needs attention
  • Historical trend data helps identify recurring issues before they become chronic problems

Your entire hybrid stack - covered 

  • Network: SNMP, NetFlow, sFlow, Packet Sniffing across all vendors
  • Servers: Windows (WMI), Linux/Unix (SSH), VMware, Hyper-V, storage systems
  • Cloud & SaaS: AWS, Azure, Microsoft 365 — alongside your on-premises infrastructure

Scales with your organization

  • Sensor-based licensing grows with your infrastructure — add sites and devices without adding complexity
  • Lightweight architecture runs on standard hardware — no dedicated monitoring server team required
  • From 100 devices today to multi-site deployments tomorrow — same tool, same interface

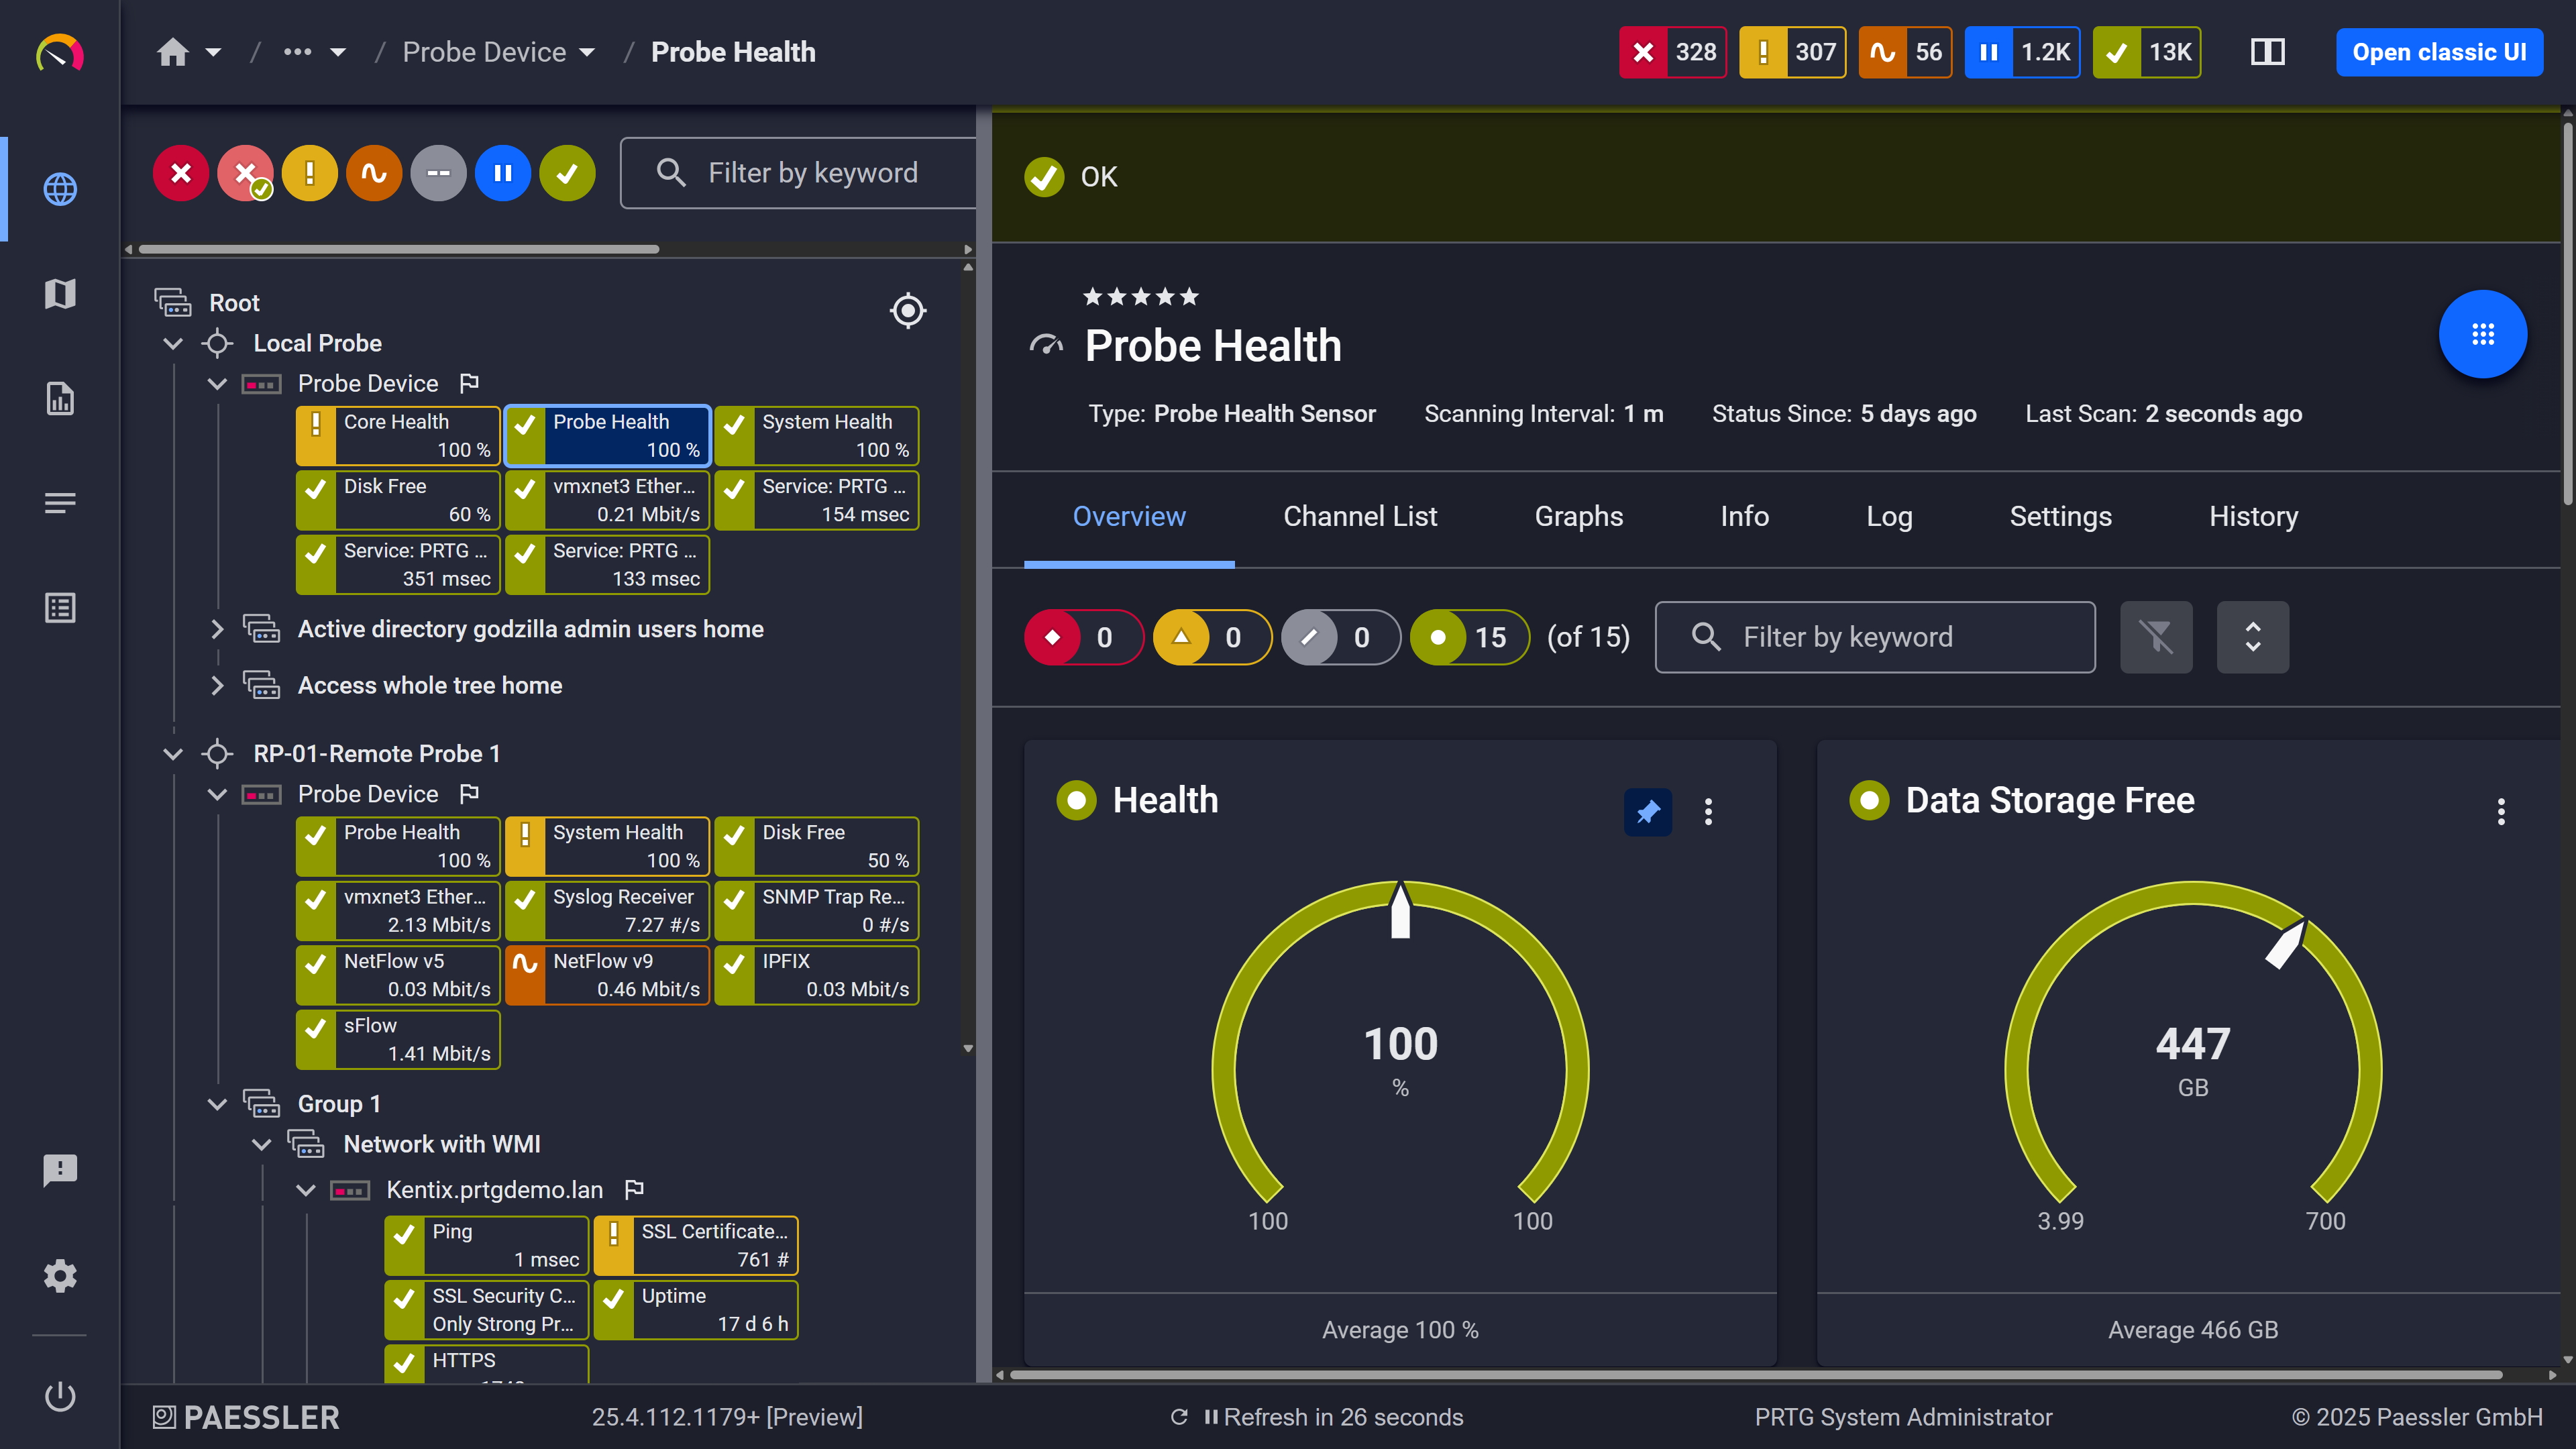
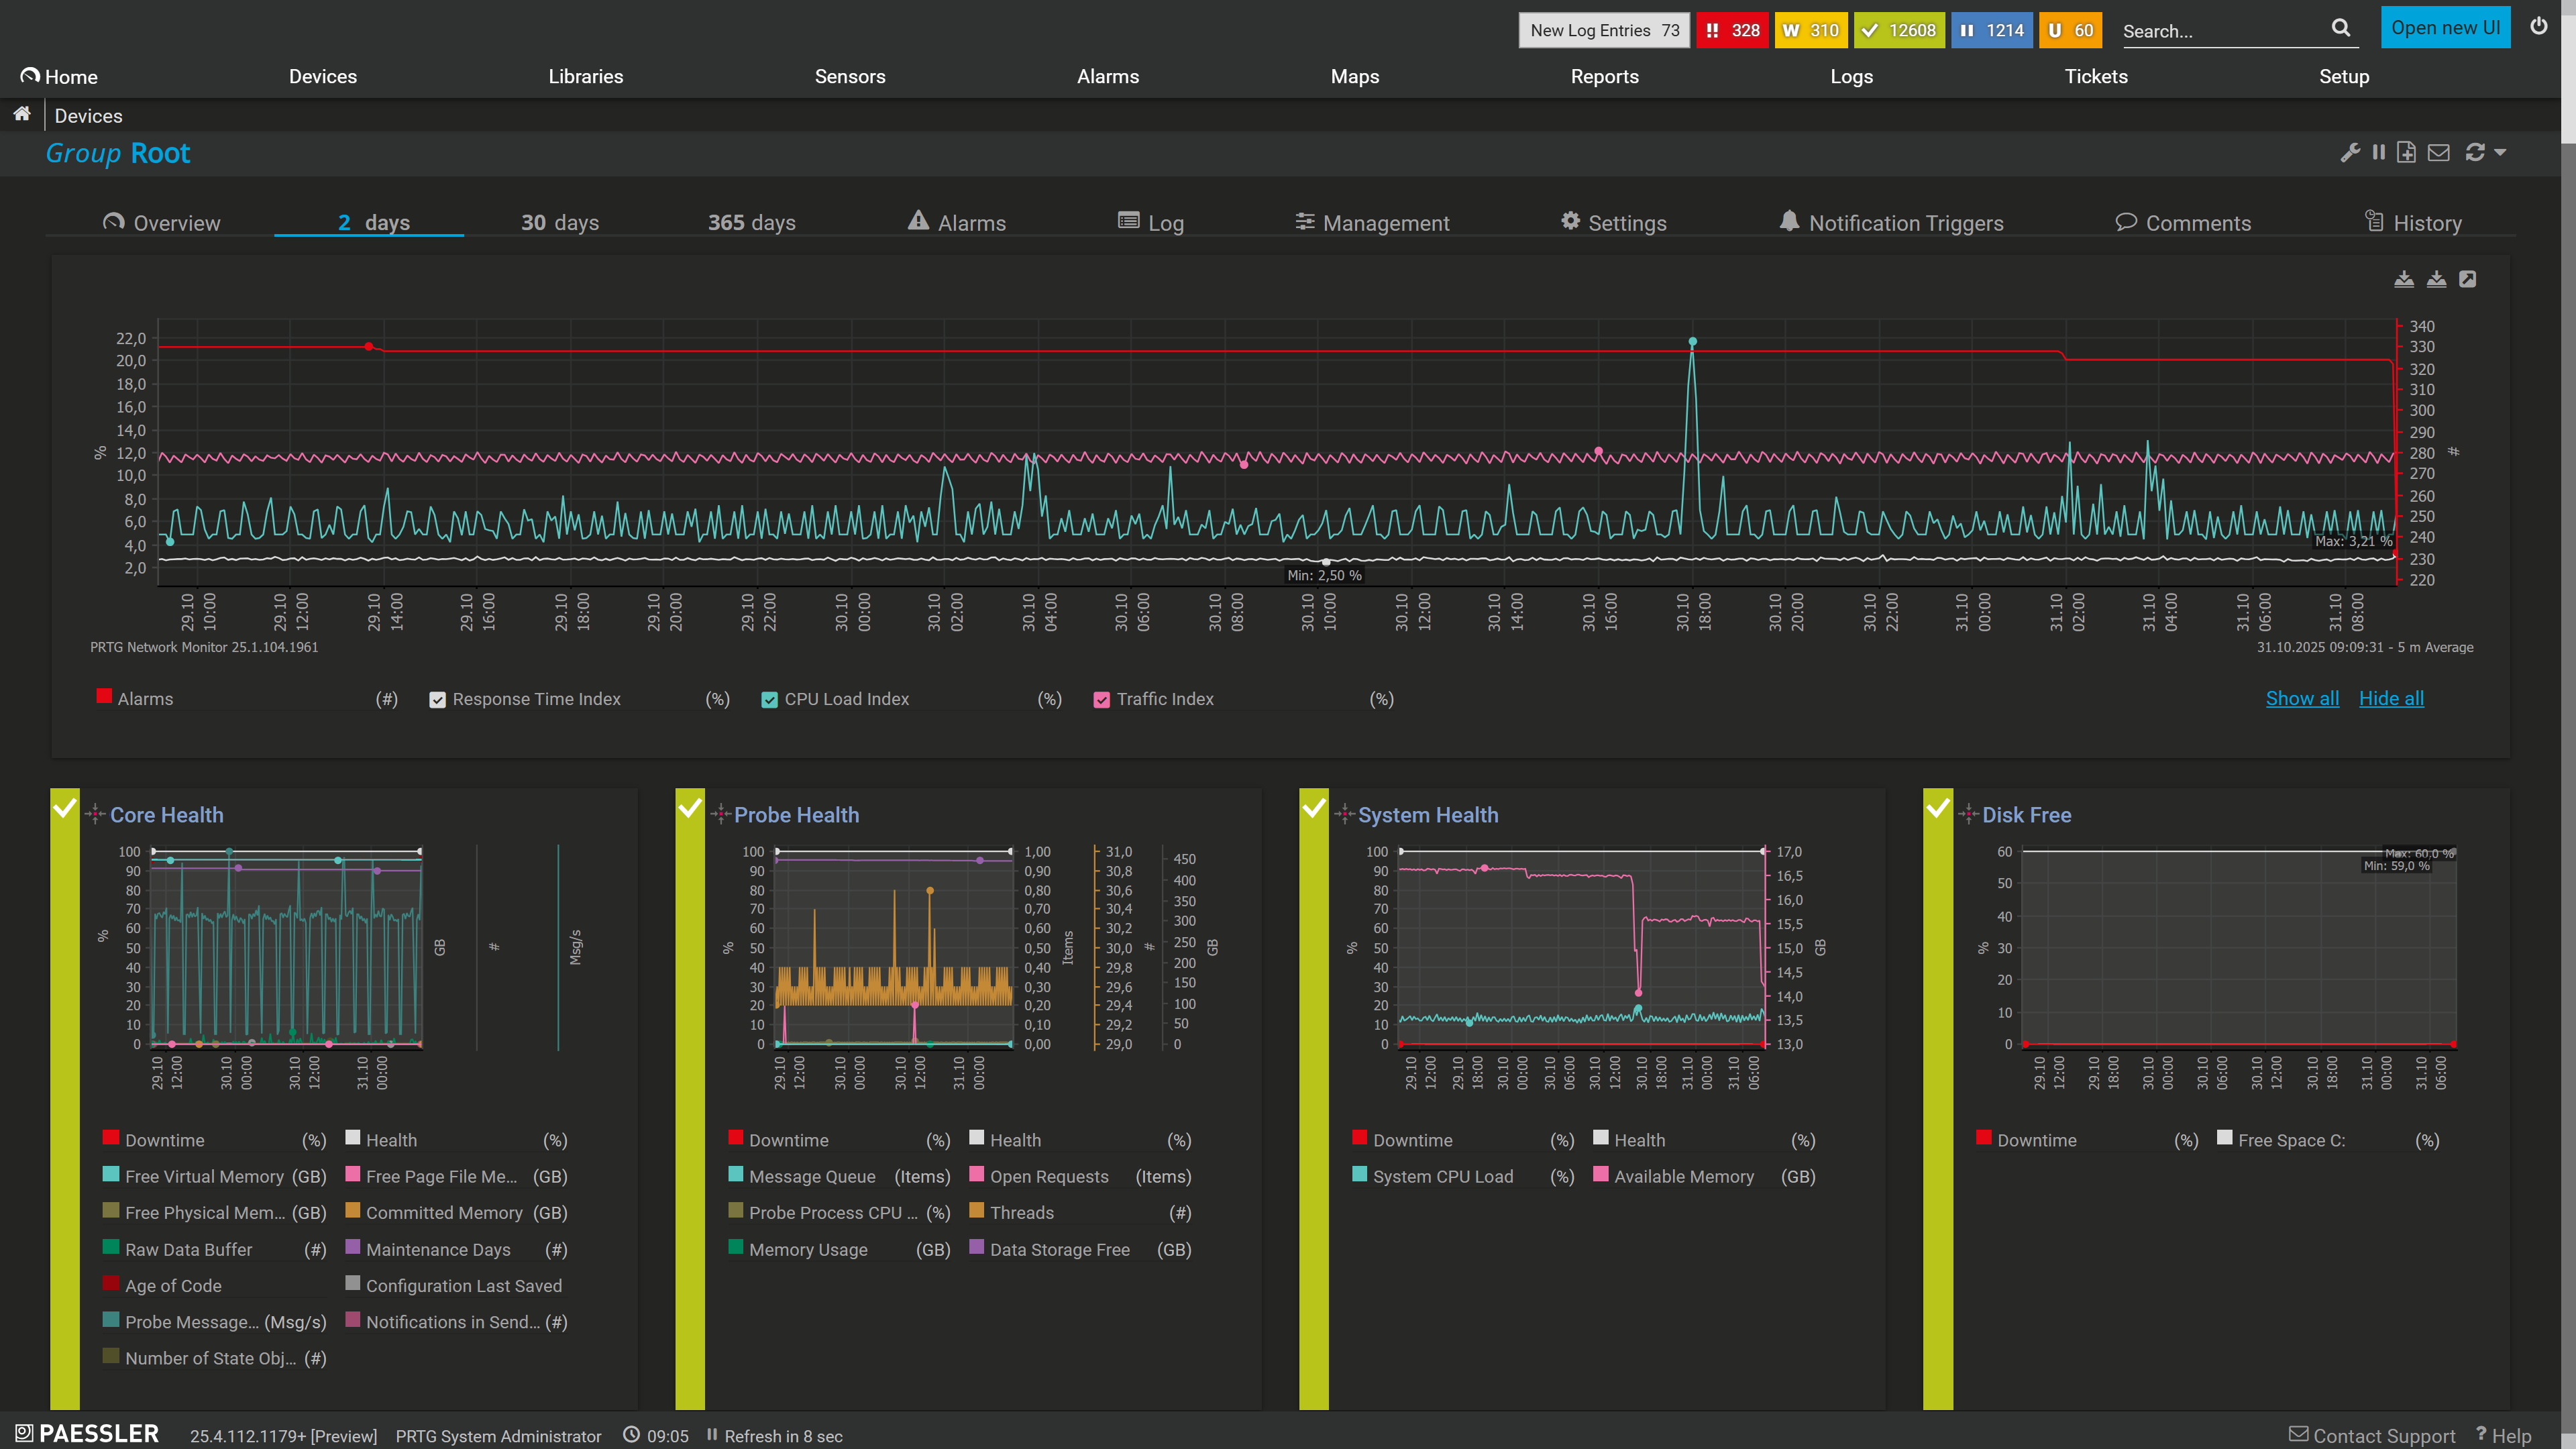
See your whole infrastructure, in one dashboard 

PRTG’s dashboards and maps consolidate monitoring data from all your sites and systems into a single view. IT leadership gets operational visibility without needing to read technical reports. Your team gets the detail they need to diagnose and resolve issues fast. 
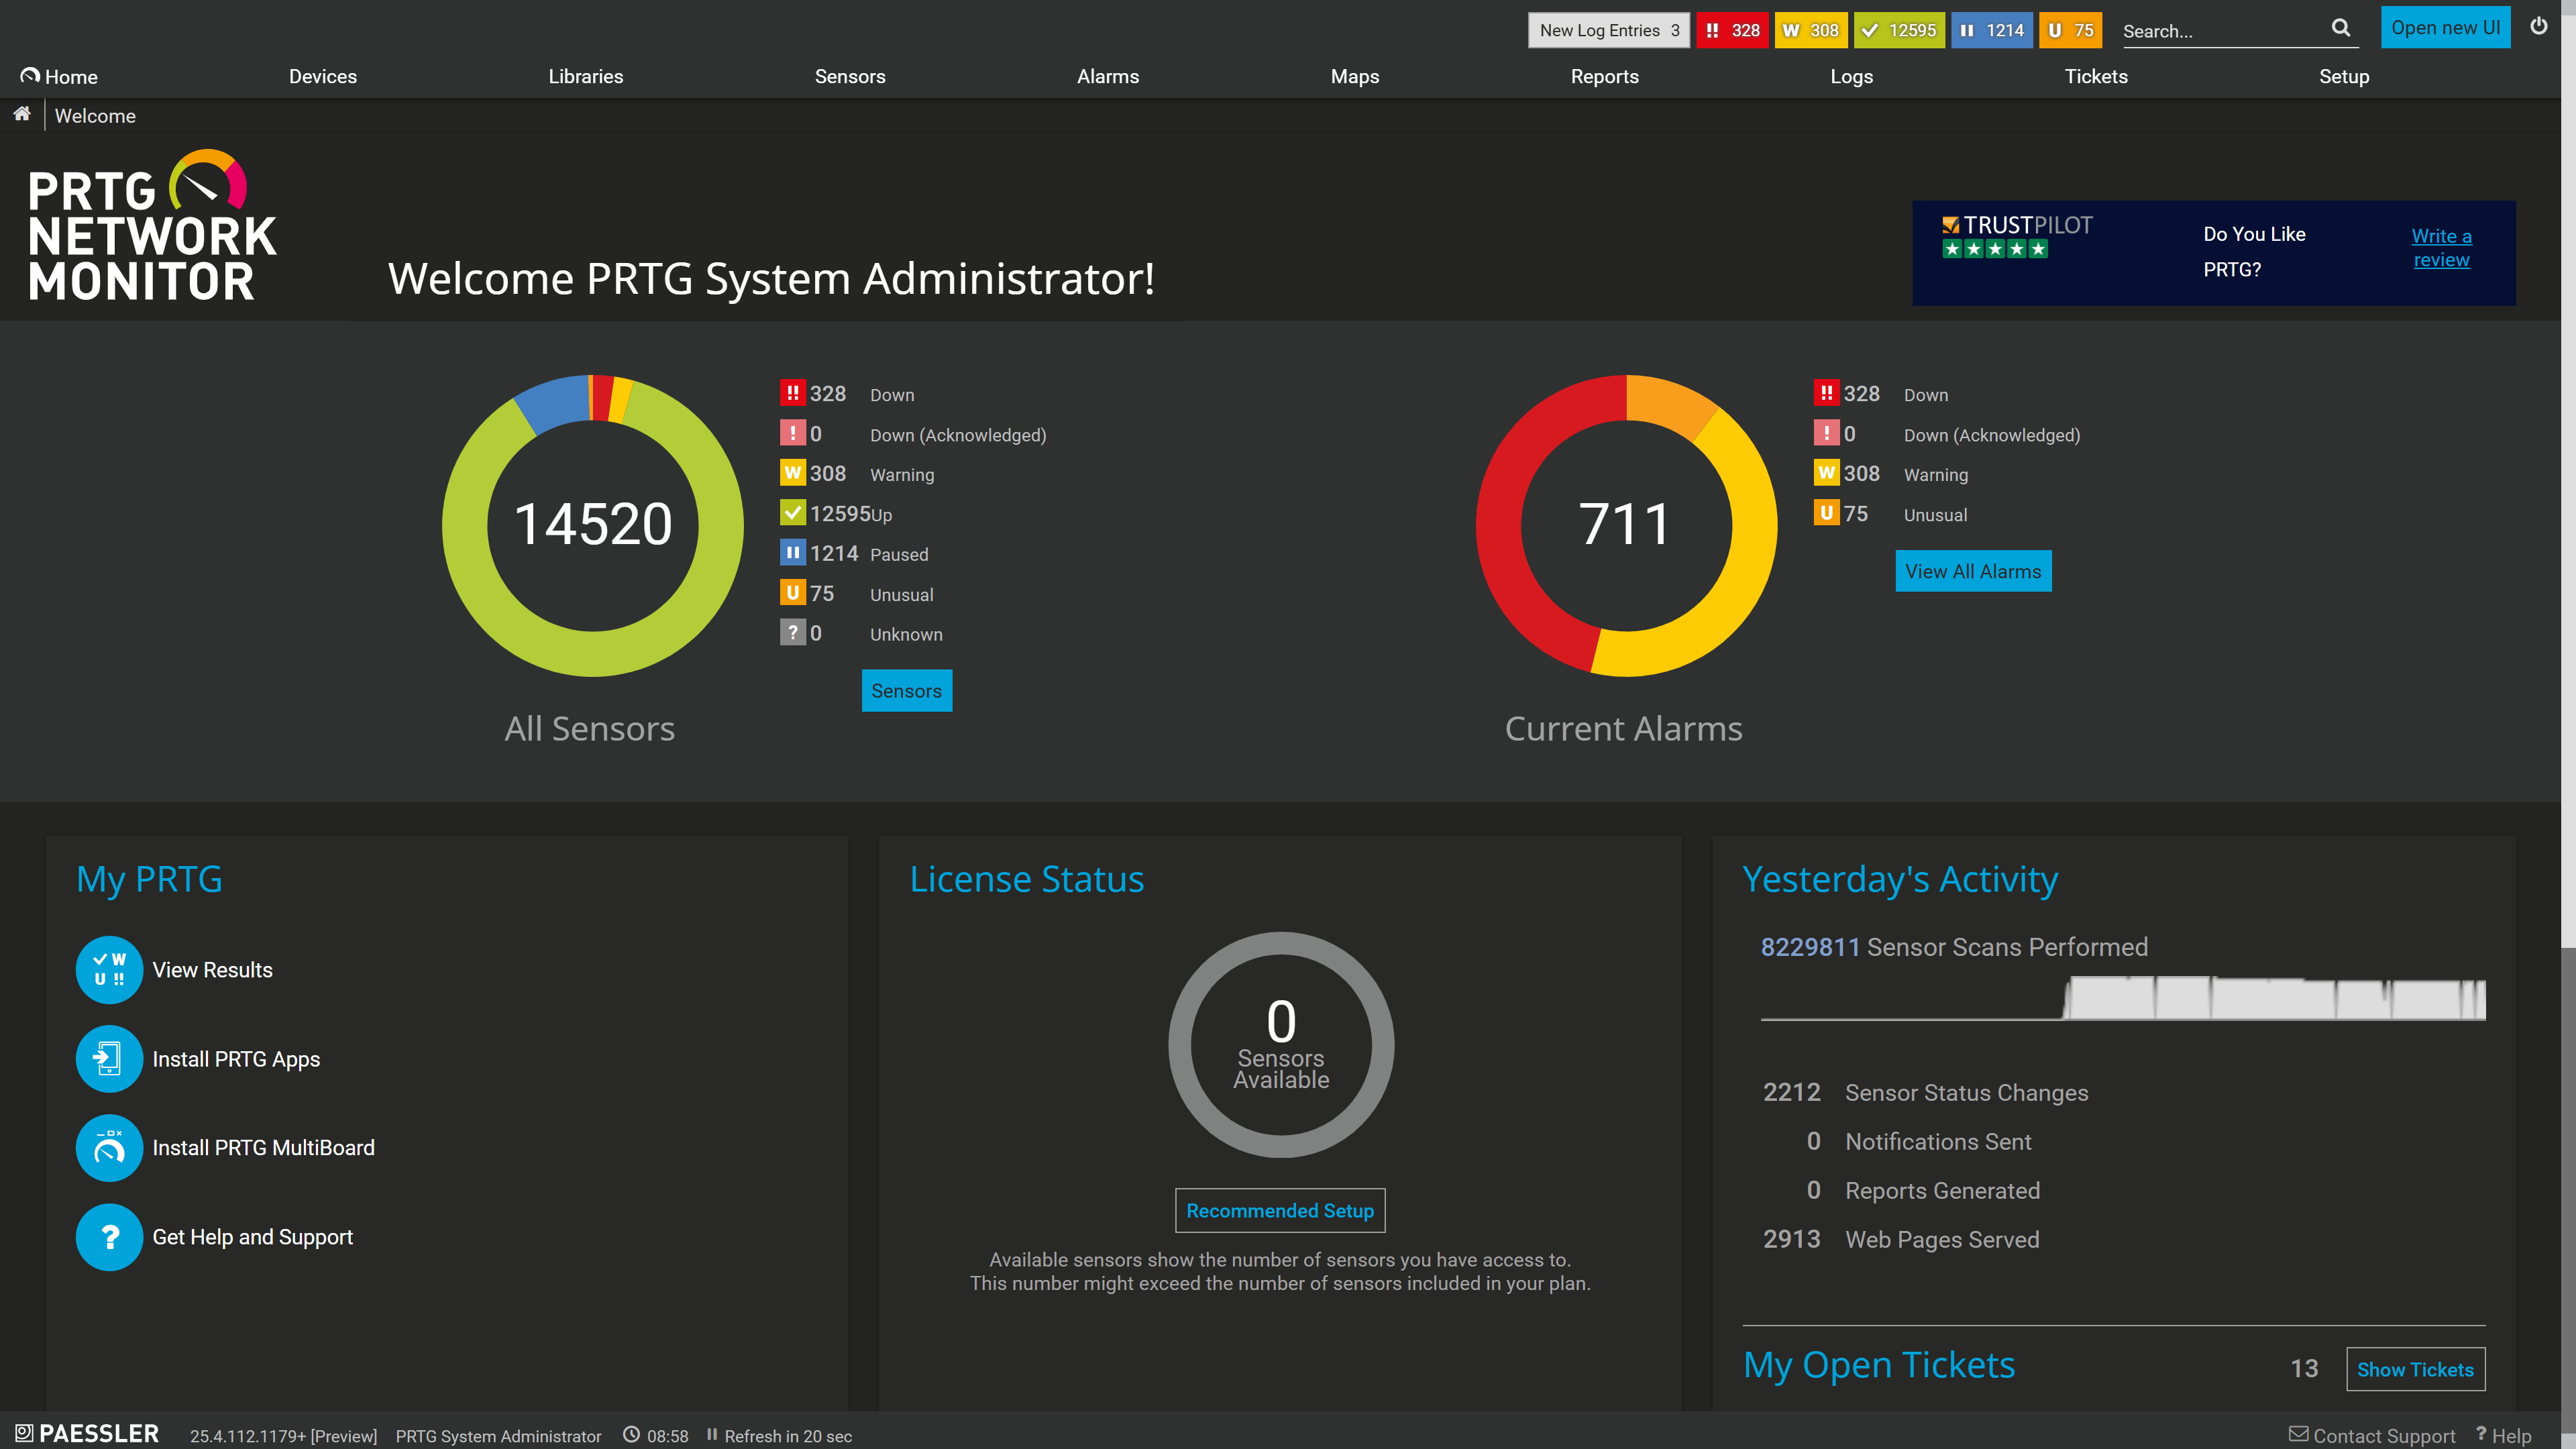
Home/Welcome Page Paessler PRTG Software
probe-health-lori
probe-health-graphs-lori
2daygraph-classic

Stop finding out about problems from your users. Start catching them yourself. 

PRTG gives your team visibility before things break.

Contact Sales

Pre-configured sensors for the infrastructure you actually run 

Here are some of the most commonly used sensor types in mid-market environments. PRTG ships with 250+ in total – covering network, server, cloud, virtualization, application, and more.

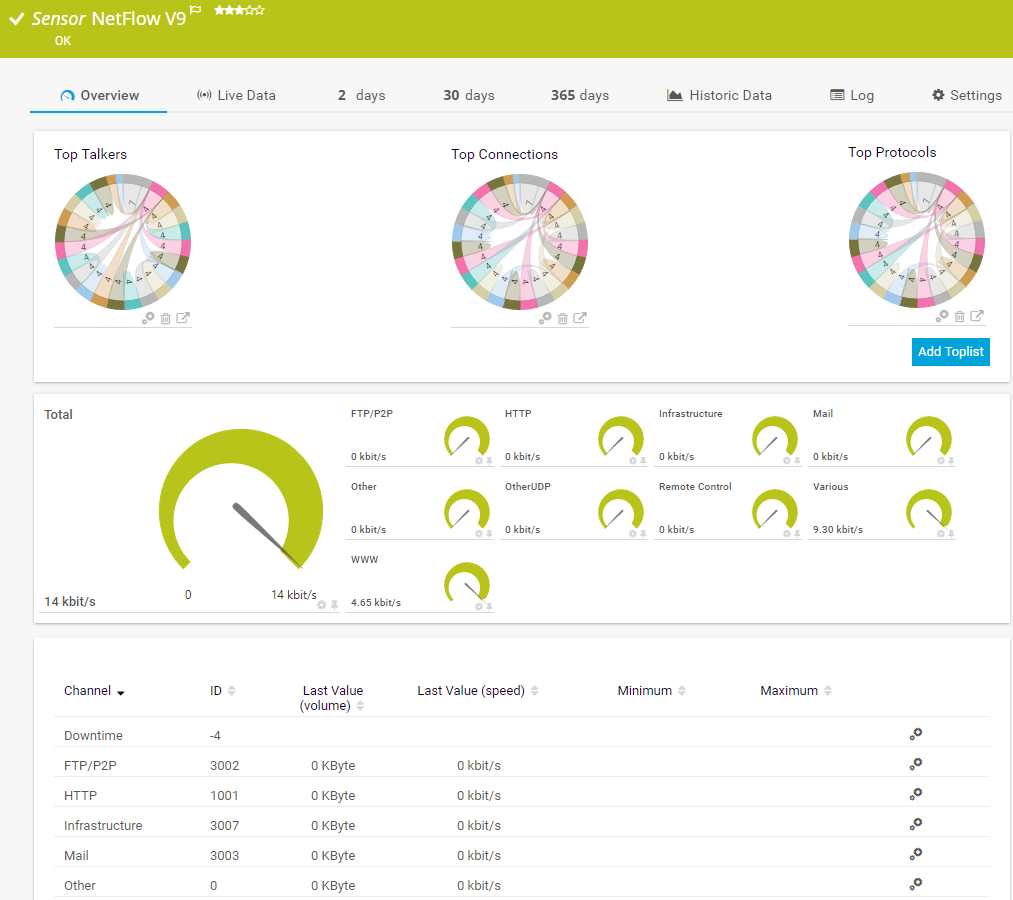
NetFlow v9

The NetFlow v9 sensor receives traffic data from a NetFlow v9-compatible device and shows the traffic by type. This sensor has several filter options to divide traffic into different channels. It can show the following and more:

  • Traffic from Citrix applications
  • Traffic from file transfer (FTP/P2P) and various other protocols (UDP, TCP)
  • Traffic from network services (DHCP, DNS, Ident, ICMP, SNMP)
  • Internet mail traffic (IMAP, POP3, SMTP)
  • Traffic from remote control applications (RDP, SSH, Telnet, Virtual Network Computing (VNC))
NetFlow v9
NetFlow v9

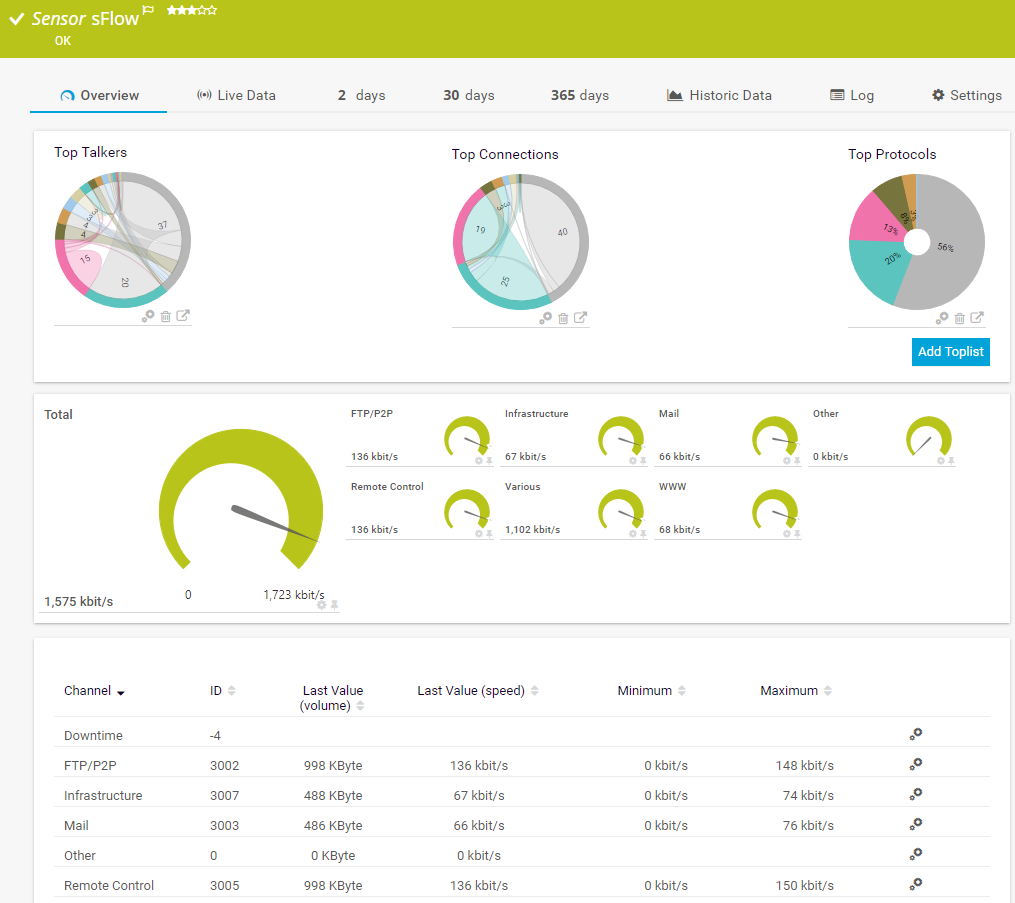
sFlow

The sFlow sensor receives traffic data from an sFlow v5-compatible device and shows the traffic by type. This sensor has several filter options to divide traffic into different channels. It can show the following and more:

  • Traffic from Citrix applications
  • Traffic from file transfer (FTP/P2P) and various other protocols (UDP, TCP)
  • Traffic from network services (DHCP, DNS, Ident, ICMP, SNMP)
  • Internet mail traffic (IMAP, POP3, SMTP)
  • Traffic from remote control applications (RDP, SSH, Telnet, Virtual Network Computing (VNC))
sFlow
sFlow

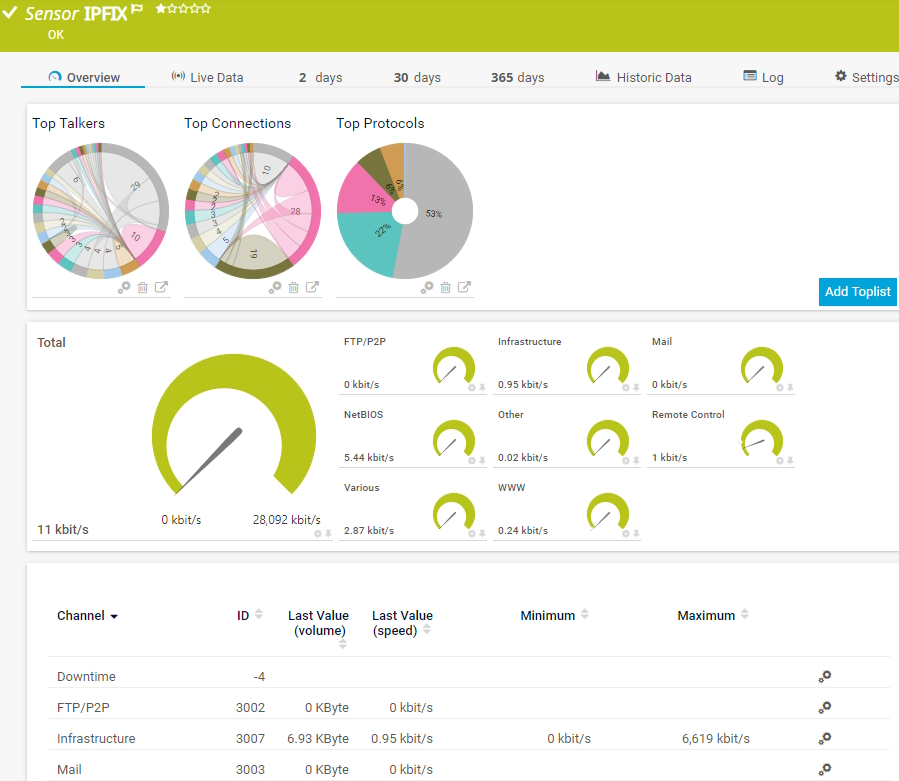
IPFIX

The IPFIX sensor receives traffic data from an Internet Protocol Flow Information Export (IPFIX) compatible device and shows traffic by type. It can show the following and more:

  • Traffic from Citrix applications
  • Traffic from file transfer (FTP/P2P) and various other protocols (UDP, TCP)
  • Traffic from network services (DHCP, DNS, Ident, ICMP, SNMP)
  • Internet mail traffic (IMAP, POP3, SMTP)
  • Traffic from remote control applications (RDP, SSH, Telnet, Virtual Network Computing (VNC))
PFIX
PFIX

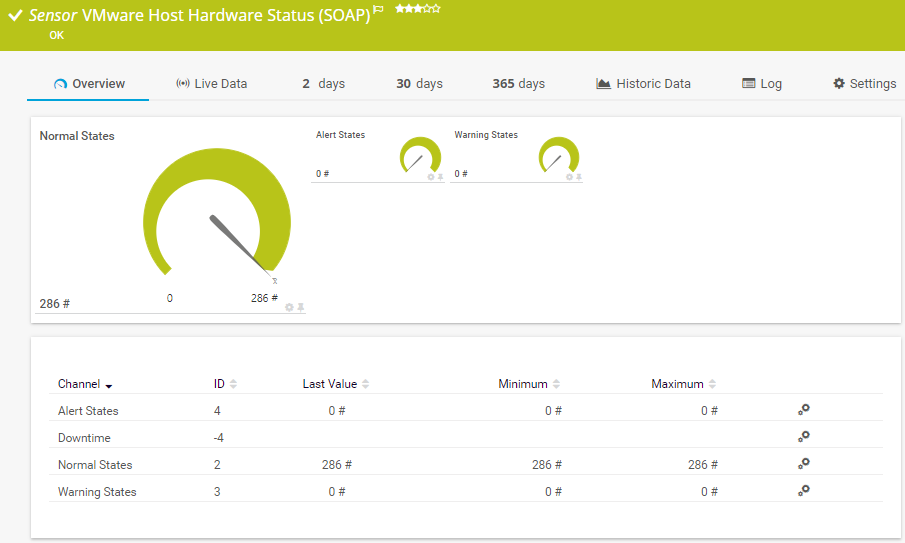
VMware Host Hardware Status (SOAP)

The VMware Host Hardware Status (SOAP) sensor monitors the hardware status of a VMware host server using the Simple Object Access Protocol (SOAP). It gives you a general status overview of the host. It can show the following:

  • Downtime
  • Total number of items in the alert, warning, normal, and unknown status as the vSphere client reports
VMware Host Hardware Status (SOAP)

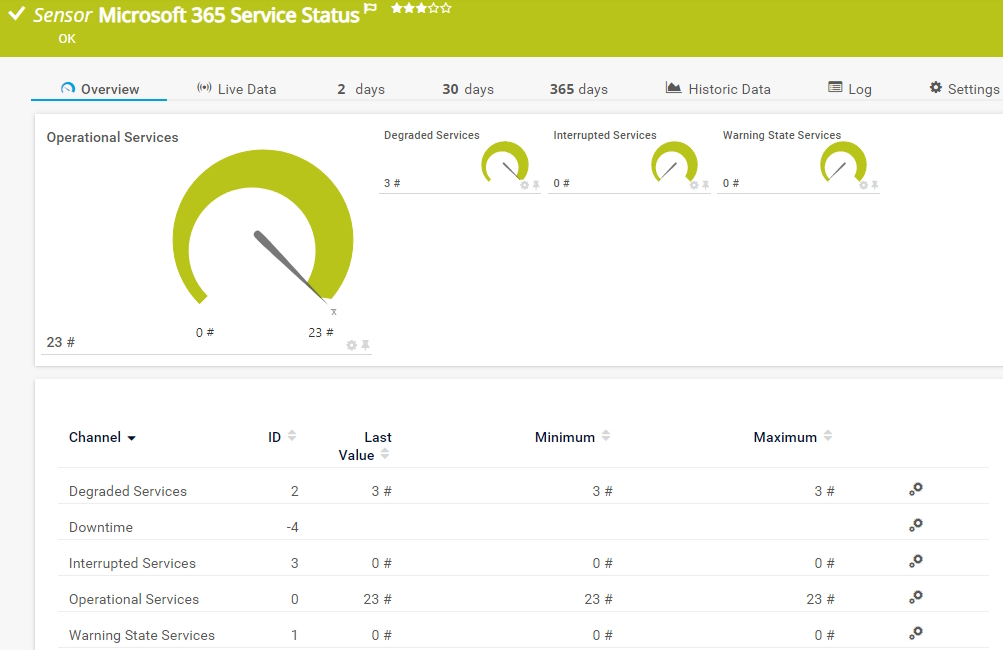
Microsoft 365 Service Status

The Microsoft 365 Service Status sensor accesses the Microsoft API to monitor the overall status of all services of a Microsoft 365 subscription. It can show the following:

  • Number of degraded services
  • Number of interrupted services
  • Number of operation services
  • Number of services in the warning status
Microsoft 365 Service Status

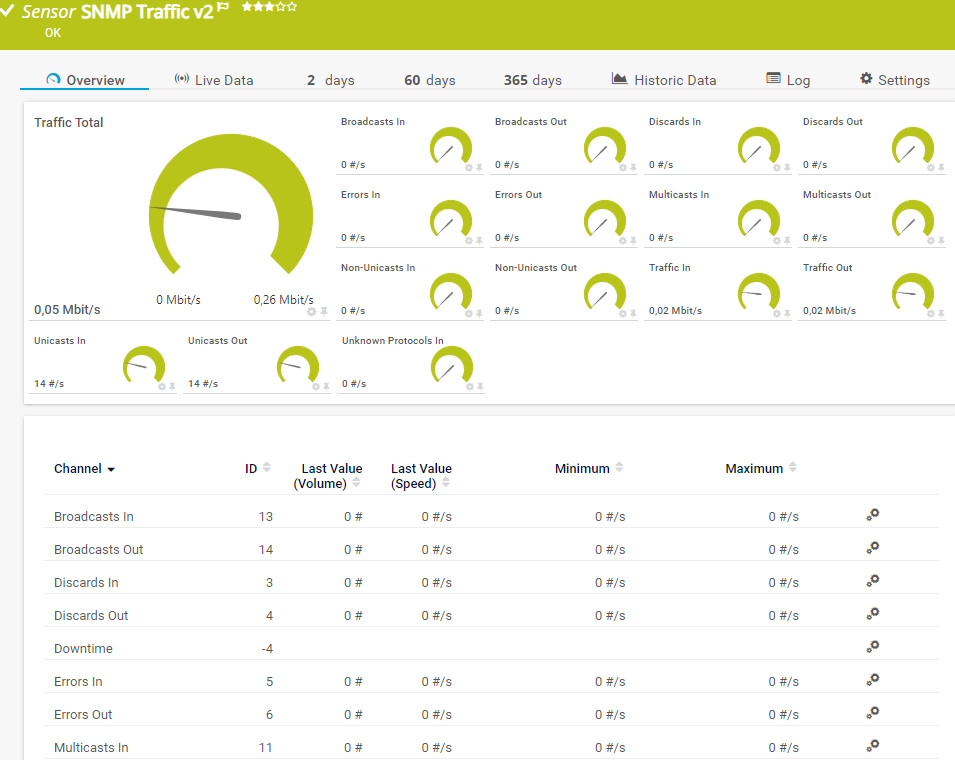
SNMP Traffic v2

The SNMP Traffic v2 sensor monitors bandwidth and traffic on a device. It can show the following:

  • Number of incoming and outgoing broadcast, multicast, unicast, and non-unicast packets
  • Number of incoming and outgoing discards and errors
  • Total, incoming, and outgoing traffic
  • Number of incoming, unknown protocols
SNMP Traffic v2
SNMP Traffic v2

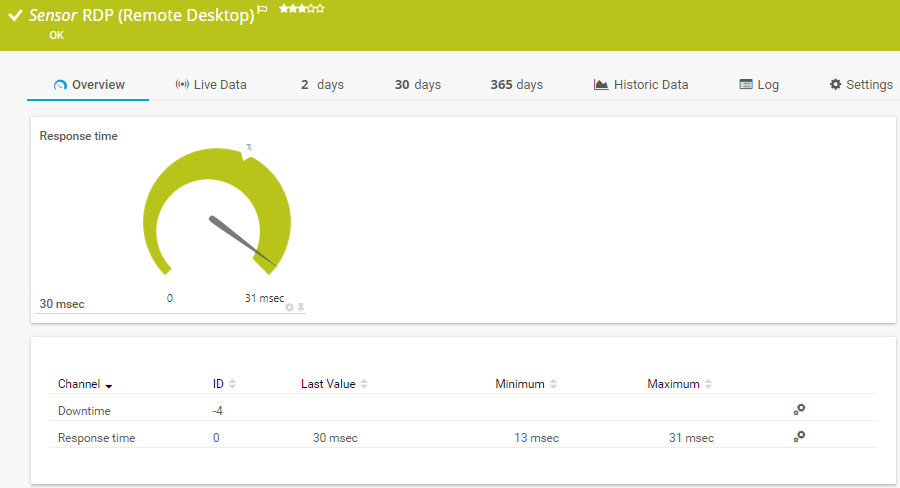
RDP (Remote Desktop)

The RDP (Remote Desktop) sensor monitors remote desktop services such as Remote Desktop Protocol (RDP) or Terminal Services Client. It can show the following:

  • Downtime
  • Response time
RDP (Remote Desktop)

See all 250+ sensor types in the PRTG Sensor Manual

What mid-market IT teams monitor with PRTG  

PRTG is flexible enough to cover the monitoring scenarios that matter most to growing IT teams.

Multi-site network monitoring

Monitor all your offices and remote sites from a central PRTG installation. Remote probes extend coverage to branch locations without deploying additional servers. 

Hybrid cloud & on-premises visibility 

Bring AWS, Azure, and Microsoft 365 monitoring into the same dashboard as your on-premises servers and network devices — one tool, full picture. 

Server & virtualization monitoring

Track CPU, memory, disk, and service status on physical and virtual servers (VMware, Hyper-V). Spot resource contention before it impacts application performance.

Uptime reporting for leadership 

Generate uptime and availability reports across your environment. Historical data and trend views let your IT leadership demonstrate performance and identify improvement areas.

Mid-market IT teams that trust PRTG

See how organizations similar to yours use PRTG to keep their infrastructure running and their leadership informed. 

Hume Bank

From ATMs to Online Banking — One Dashboard, Full Visibility

Hume Bank uses PRTG to keep watch over its entire branch network — servers, switches, routers, applications, and even ATMs and Eftpos terminals — from a single dashboard. If an ATM goes down in one branch, the team knows immediately and can act before it affects customers.

Read full case study

Fulham FC

Premier League Ambitions, Lean-Team IT

Fulham Football Club runs a surprisingly complex IT setup behind the scenes — three sites and two data centers running VMware, EMC storage, and Juniper switches — all kept running smoothly with PRTG. Proof that a small IT team can support a big operation without needing big-enterprise headcount.

Read full case study

Centroflora Group

From 6 Hours to Minutes, Diagnosing Factory Floor Issues Fast

Centroflora, a Brazilian manufacturer of botanical extracts, used to send technicians out to physically inspect Siemens PLCs every time something went wrong — a process that could take 6 or 7 hours to diagnose an error. With PRTG unifying factory-floor and IT monitoring on one dashboard, that dropped to minutes — and cut power costs by 3–4% along the way.

Read full case study

Gartner peer insights

“Excellent tool for detailed monitoring. Alarms and notifications work greatly. Equipment addition is straight forward and server initial setup is very easy. ...feel safe to purchase it if you intend to monitor a large networking landscape.”

Read the complete review at Gartner Peer Insights

See it work for a team like yours

Want proof before you roll this out to the whole team? These resources show you what to expect.

Resources Solution

Product Demo

See PRTG in a scenario that mirrors a lean IT team — one dashboard, fast setup, no dedicated monitoring staff needed.

Watch now

Resources Content

Getting Started Guide 

Step-by-step guide for deploying PRTG in your environment — including auto-discovery and first sensor setup. 

Read the guide

Resources Solutions

Talk to an Expert

Talk to a Paessler monitoring expert who understands growing IT environments — and can help you make the case to leadership. 

Get in touch

Frequently Asked Questions

Can PRTG monitor infrastructure across multiple office locations?

Yes. PRTG supports distributed monitoring through Remote Probes — lightweight agents you install at each site that report back to your central PRTG core installation. This means you can monitor all your offices, data centers, and remote sites from one place, without deploying a full PRTG server at each location.  

How does PRTG handle hybrid cloud and on-premises environments?

PRTG monitors both from the same interface. It includes native sensors for AWS CloudWatch, Microsoft Azure, and Microsoft 365 alongside SNMP, WMI, and SSH sensors for your on-premises network devices and servers. Your team gets a unified view of the whole environment — cloud and on-prem — without switching between tools. 

Does PRTG provide reports and dashboards that I can share with leadership?

Yes. PRTG includes built-in reporting that generates uptime, availability, and performance reports in PDF or CSV format. Operational dashboards can be customized to show the metrics most relevant to your stakeholders. For senior leadership, PRTG’s maps and dashboards provide a real-time, color-coded overview of infrastructure health. 

What does it take to deploy PRTG across a mid-market environment?

Most mid-market teams have PRTG up and running within a day. Auto-discovery handles device detection automatically. Remote Probes can be deployed to branch locations in minutes. No consultants or specialist engineers are required — PRTG is designed to be installed, configured, and managed by your own IT team. 

How does PRTG integrate with our existing helpdesk and ITSM tools?

PRTG sends alerts via email, SMS, HTTP actions, and webhooks, making it compatible with most ITSM and ticketing platforms. It works alongside tools like ServiceNow, Jira Service Management, PagerDuty, OpsGenie, Slack, and Microsoft Teams. PRTG can also send syslog and SNMP trap data to SIEM systems for security monitoring workflows. 

Will PRTG keep up as our infrastructure grows?

PRTG scales on a sensor-based model — you add sensors as you add infrastructure, without architectural changes or added management complexity. Many customers start with a few hundred sensors and grow to thousands across multiple sites and cloud environments, using the same PRTG installation throughout. 

See it all today. Scale it without the headaches tomorrow.

Deploy in hours across servers, cloud, and network. Scale up without switching tools. 
Contact Sales

Products

  • Paessler PRTG
    Paessler PRTGMonitor your whole IT infrastructure
    • PRTG Network Monitor
    • PRTG Enterprise Monitor
    • PRTG Hosted Monitor
    • PRTG UVexplorer
    • PRTG extensions
      Extensions for Paessler PRTGExtend your monitoring to a new level
  • Icon Features
    FeaturesExplore all monitoring features

Monitoring with PRTG

  • Network monitoring
  • Bandwidth monitoring
  • SNMP monitoring
  • Network mapping
  • Wi-Fi monitoring
  • Server monitoring
  • Network traffic analyzer
  • NetFlow monitoring
  • Syslog server

Useful Links

  • PRTG Manual
  • Knowledge Base
  • Customer Success Stories
  • About Paessler
  • Subscribe to newsletter
  • PRTG Support
  • PRTG Consulting
  • PRTG Feedback & Roadmap

Contact

Paessler GmbH
Thurn-und-Taxis-Str. 14, 
90411 Nuremberg 
Germany

[email protected]

+49 911 93775-0

  • Contact us
©2026 Paessler GmbHTerms & ConditionsPrivacy PolicyImprintReport VulnerabilityDownload & InstallSitemap
Network Fault Management Network Fault Management Network Fault Management