• Company
    • About Us
    • Case Studies
    • Press Center
    • Careers
    • Blog
    • Contact us
  • Contact us
  • Login
 
  • English
    • Deutsch
    • Español
    • Français
    • Italiano
    • Português
Paessler
                    - The Monitoring Experts
  • Products
    • Paessler PRTG
      Paessler PRTGMonitor your whole IT infrastructure
      • PRTG Network Monitor
      • PRTG Enterprise Monitor
      • PRTG Hosted Monitor
      • PRTG UVexplorer
      • PRTG extensionsExtensions for Paessler PRTGExtend your monitoring to a new level
    • Icon Features
      FeaturesExplore all monitoring features
      • Maps & dashboards
      • Alerts & notifications
      • Multiple user interfaces
      • Distributed monitoring
      • Customizable reporting
  • Solutions
    • By TeamFor your organization size
      • Small Business IT
      • Mid-Market IT
      • Enterprise IT
      • MSP Network Monitoring
    • Industries
      By IndustryFor your business sector
      • Industrial
      • Healthcare
      • Government
      • Education
      • Data Center
      • Finance
    • IT Topics
      By Use CaseFor every technical scenario
      • Network Monitoring
      • Server Monitoring
      • OT Monitoring
      • Distributed Monitoring
      • Network Topology Mapping
      • SNMP Monitoring
      • Bandwidth Monitoring
  • Pricing
  • Resources
    • Getting Started
      Getting StartedModules for self-paced learning
    • How-to Guides
      How-to GuidesGet the most out of PRTG
    • Videos & Webinars
      Videos & WebinarsLearn from Paessler experts
    • IT  Knowledge
      IT KnowledgeExpand your IT knowledge
    • PRTG Manual
      PRTG ManualFull documentation
    • Knowledge Base
      Knowledge BaseShare community knowledge
    • PRTG Sensor Hub
      PRTG Sensor HubGet sensors, scripts & templates
    • Trainings
      PRTG TrainingLearn how to work with PRTG
  • Partners
    • Icon Handshake
      Become a PartnerFor resellers and channel partners
    • Icon MSP
      Become an MSPDeliver monitoring as a managed service
    • icon partner
      Partner PortalLog in to your partner account
    • Deal Registration
      Deal RegistrationRegister your sales opportunities
    • icon search
      Find a PartnerFind partners selling Paessler products
    • icon technology
      Technology AlliancesSee Paessler technology partnerships
    • Partner HubTools for Your Success
  • Company
    • About Us
    • Case Studies
    • Press Center
    • Careers
    • Blog
    • Contact us
  • Contact us
  • Login
  • English
    • Deutsch
    • Español
    • Français
    • Italiano
    • Português
  • Get a quote
  • Free trial
  1. Home>
  2. By Team>
  3. Small Business IT

Complete IT monitoring for lean teams

  • Single dashboard for your entire hybrid environment – on-premises, cloud, and remote sites 
  • Hundreds of pre-configured sensors detect issues automatically, no scripting required to get started 
  • Deploy in hours, not weeks – no consultants, no complex onboarding, no specialist training needed 
free download

Trusted by regional and site-based IT teams at manufacturers, hospitals, universities, retailers, and more - worldwide. 

customer success stories

What customers say about us

Why lean IT teams choose PRTG 

Managing IT with a small team means wearing a lot of hats. You’re responsible for everything – the network, the servers, the cloud stack, the help desk – and you probably don't have a dedicated monitoring person. Most tools assume you do. PRTG doesn't. 

Small IT Team
  1. Get up and running fast – auto-discovery finds your devices and pre-configured sensors start collecting data immediately
  2. Monitor everything in one place – network, servers, cloud, applications, and more from a single pane of glass
  3. Catch problems before users do – threshold-based alerts notify your team via email, SMS, or push before issues escalate
  4. No specialist required – the interface is intuitive enough for any IT generalist, yet powerful enough for experienced engineers
  5. Scales with your business – start small, add sensors and sites as you grow, without adding management overhead

The reality of managing IT with a lean team 

You’re accountable for uptime, performance, and security across your entire organization – often with a team of one to five people. The right monitoring tool doesn’t just help you react faster. It gives a small team the kind of visibility that used to require a much bigger one. 

Icon Lightning

Too many tools, not enough time 

Juggling separate tools for servers, network, cloud, and applications means your team wastes hours switching between consoles - and still misses things. You need unified visibility, not more dashboards to manage. 

Icon Lightning

Reactive firefighting instead of proactive control 

When you find out about a problem from a user complaint, it’s already too late. Lean teams can’t afford to chase issues after the fact. You need alerts that give you the heads-up before the outage hits. 

Icon Lightning

Monitoring tools built for teams you’re not 

Enterprise monitoring platforms assume you have a dedicated monitoring team, weeks for deployment, and a budget to match. They’re overkill for your environment — and yet the infrastructure you're protecting is just as critical. 

Why PRTG is the right fit for your business

Six capabilities that make a real difference when you’re running IT for your whole company.

Monitor in minutes, not months 

  • Auto-discovery scans your network and adds devices automatically 
  • Hundreds of pre-configured sensors for servers, switches, cloud platforms, and more 
  • No professional services needed — your team is in control from day one

One dashboard for everything 

  • Unified visibility across on-premises, cloud, and hybrid infrastructure 
  • Customizable maps and dashboards tailored to how your team works 
  • Drill down from high-level health overview to individual device metrics 

Alerts that actually help 

  • Threshold-based alerts via email, SMS, push notification, or third-party tools 
  • Customizable alert thresholds so your team only gets notified for what matters 
  • Dependency-aware alerting reduces alert noise during infrastructure outages 

Monitors your entire stack 

  • Supports SNMP, WMI, SSH, REST API, NetFlow, sFlow, and more out of the box 
  • Cloud monitoring for AWS, Azure, and Microsoft 365 
  • Custom sensors via scripts and REST API for anything not covered natively 

Built for reliable, mission-critical environments 

  • Trusted in healthcare, manufacturing, financial services, and government 
  • Continuous monitoring with configurable notification escalations 
  • Historical data and trend visibility for informed capacity decisions 

Grows with you - without the overhead 

  • Start with a free 30-day trial - no credit card, no commitment 
  • Sensor-based licensing means you pay for what you actually monitor 
  • Lightweight architecture - no dedicated monitoring team required to maintain it

See your entire infrastructure at a glance 

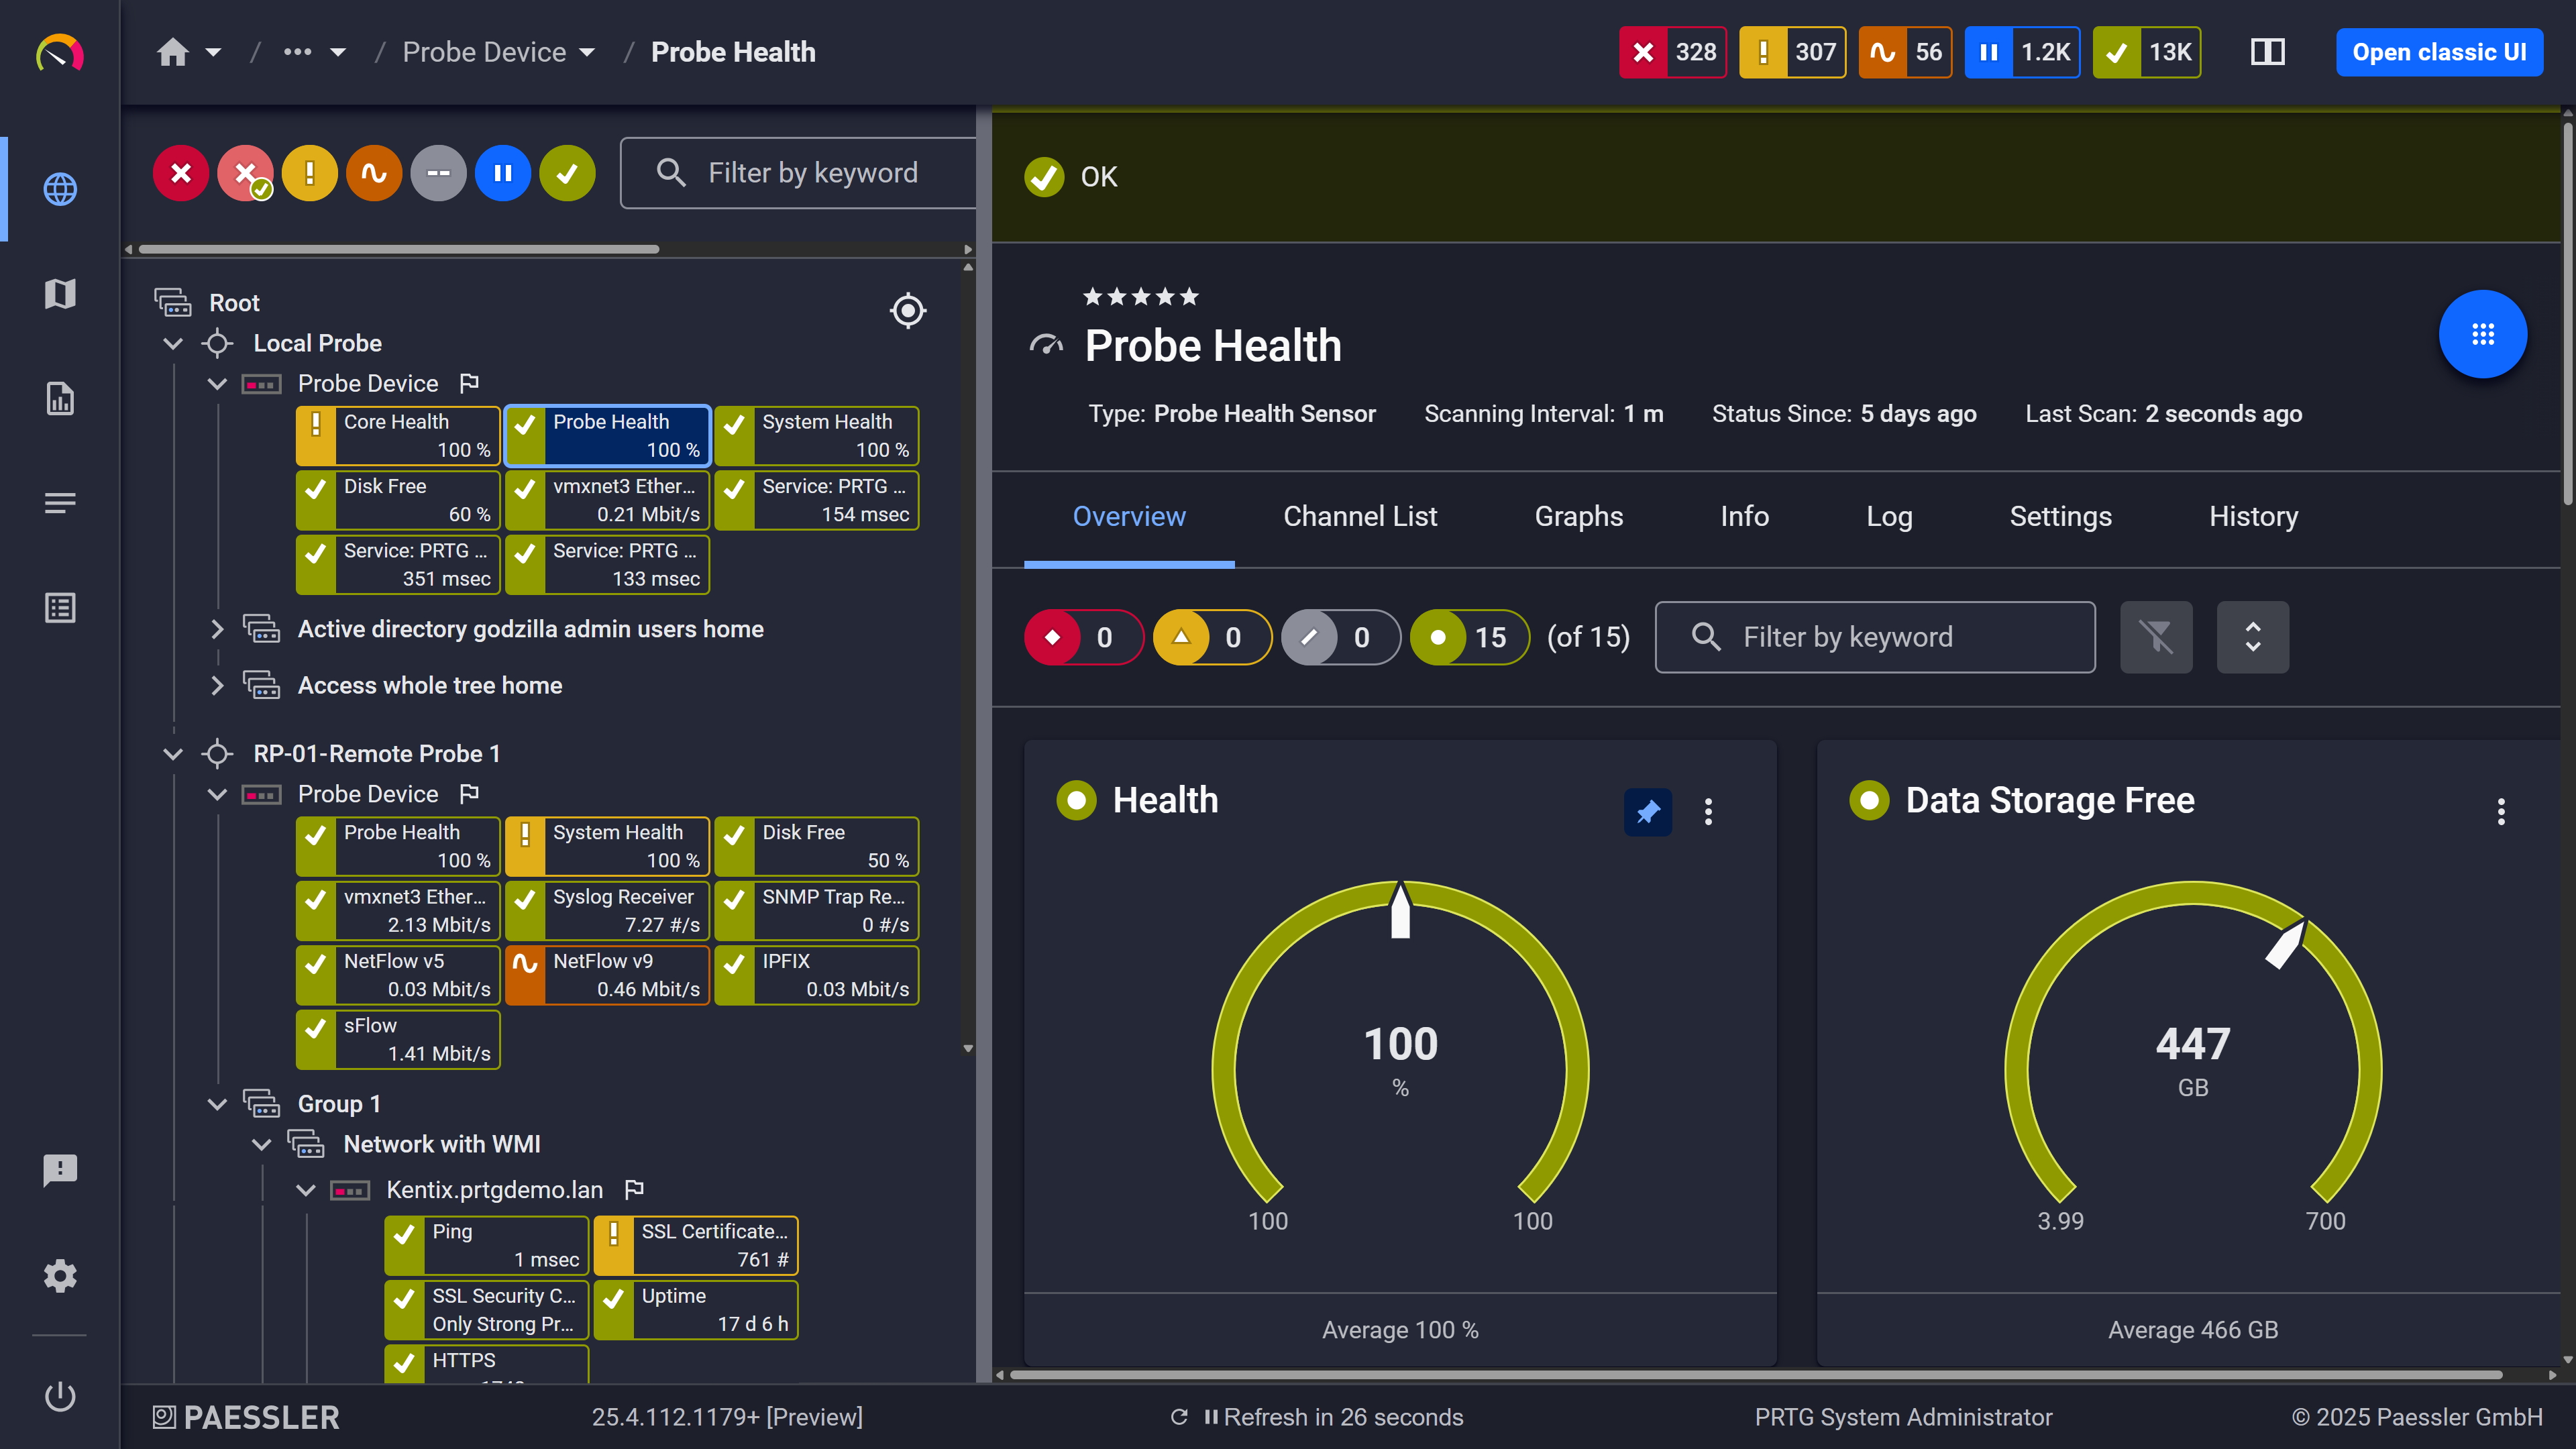
PRTG’s real-time dashboards and maps give your team instant situational awareness – from overall network health down to individual device metrics. Color-coded status indicators, historical graphs, and customizable alert views mean your team always knows what’s happening, and what needs attention first. 
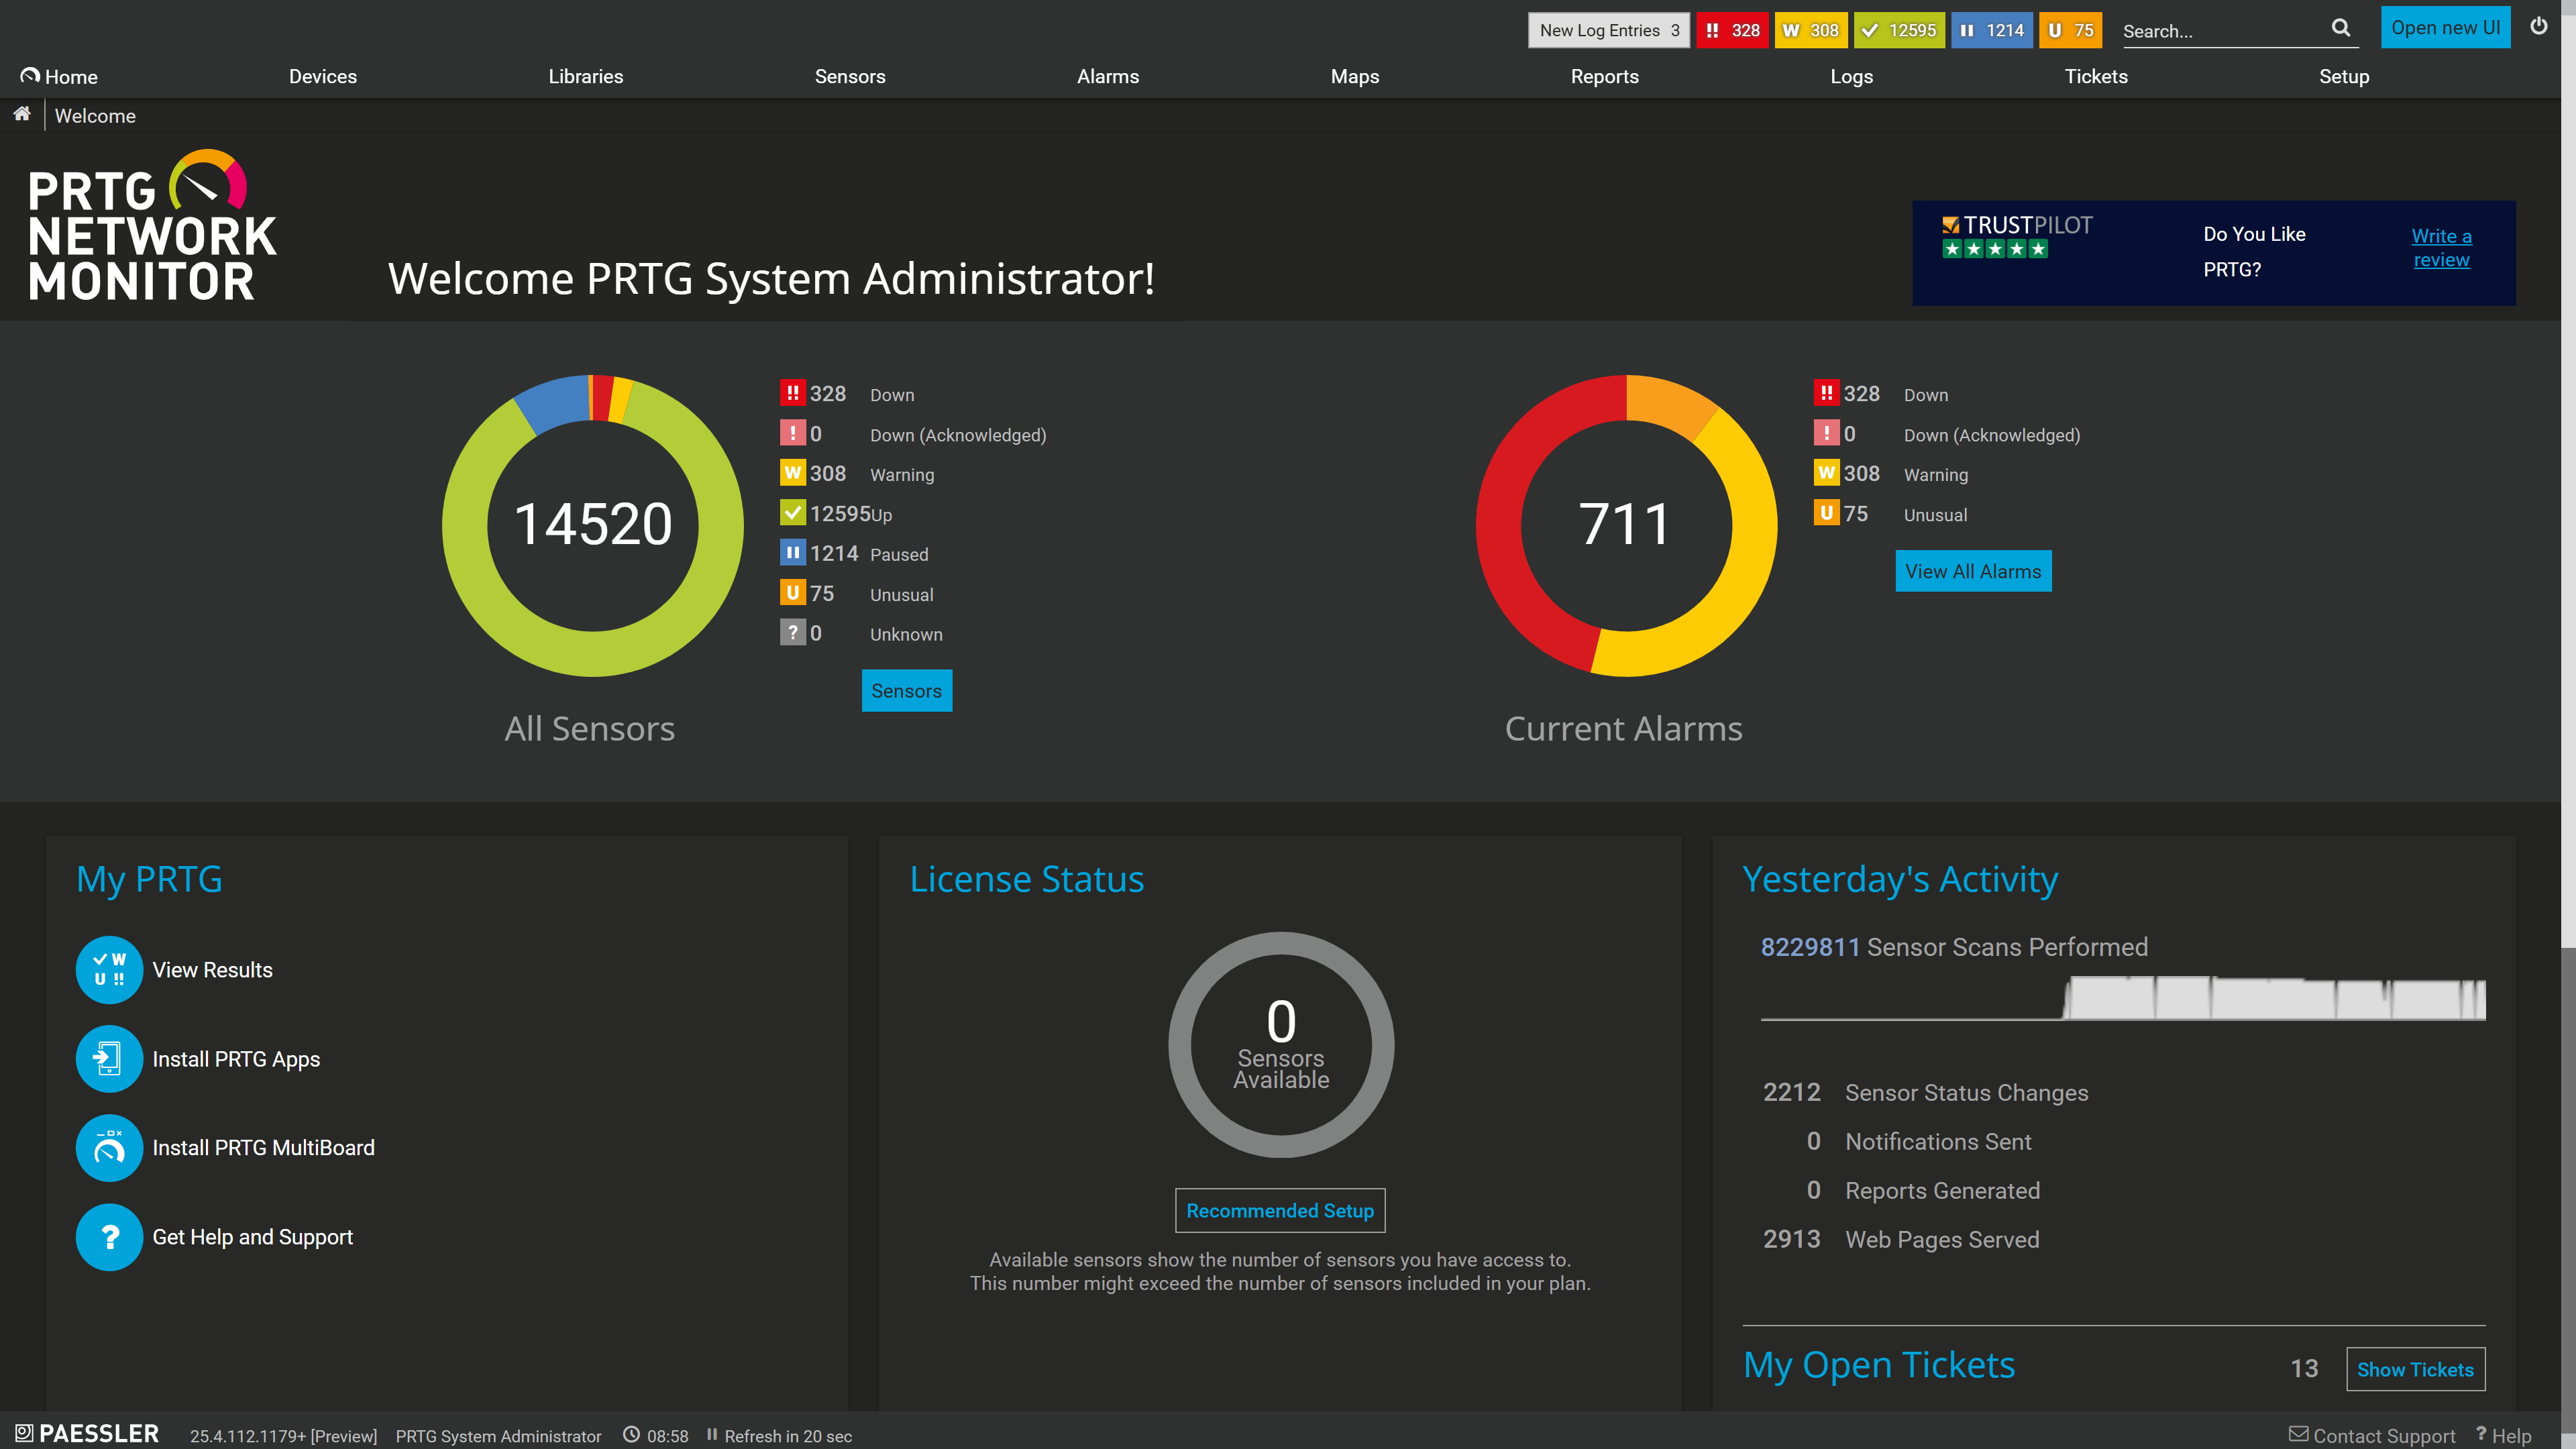
Home/Welcome Page Paessler PRTG Software
Probe Health Lori
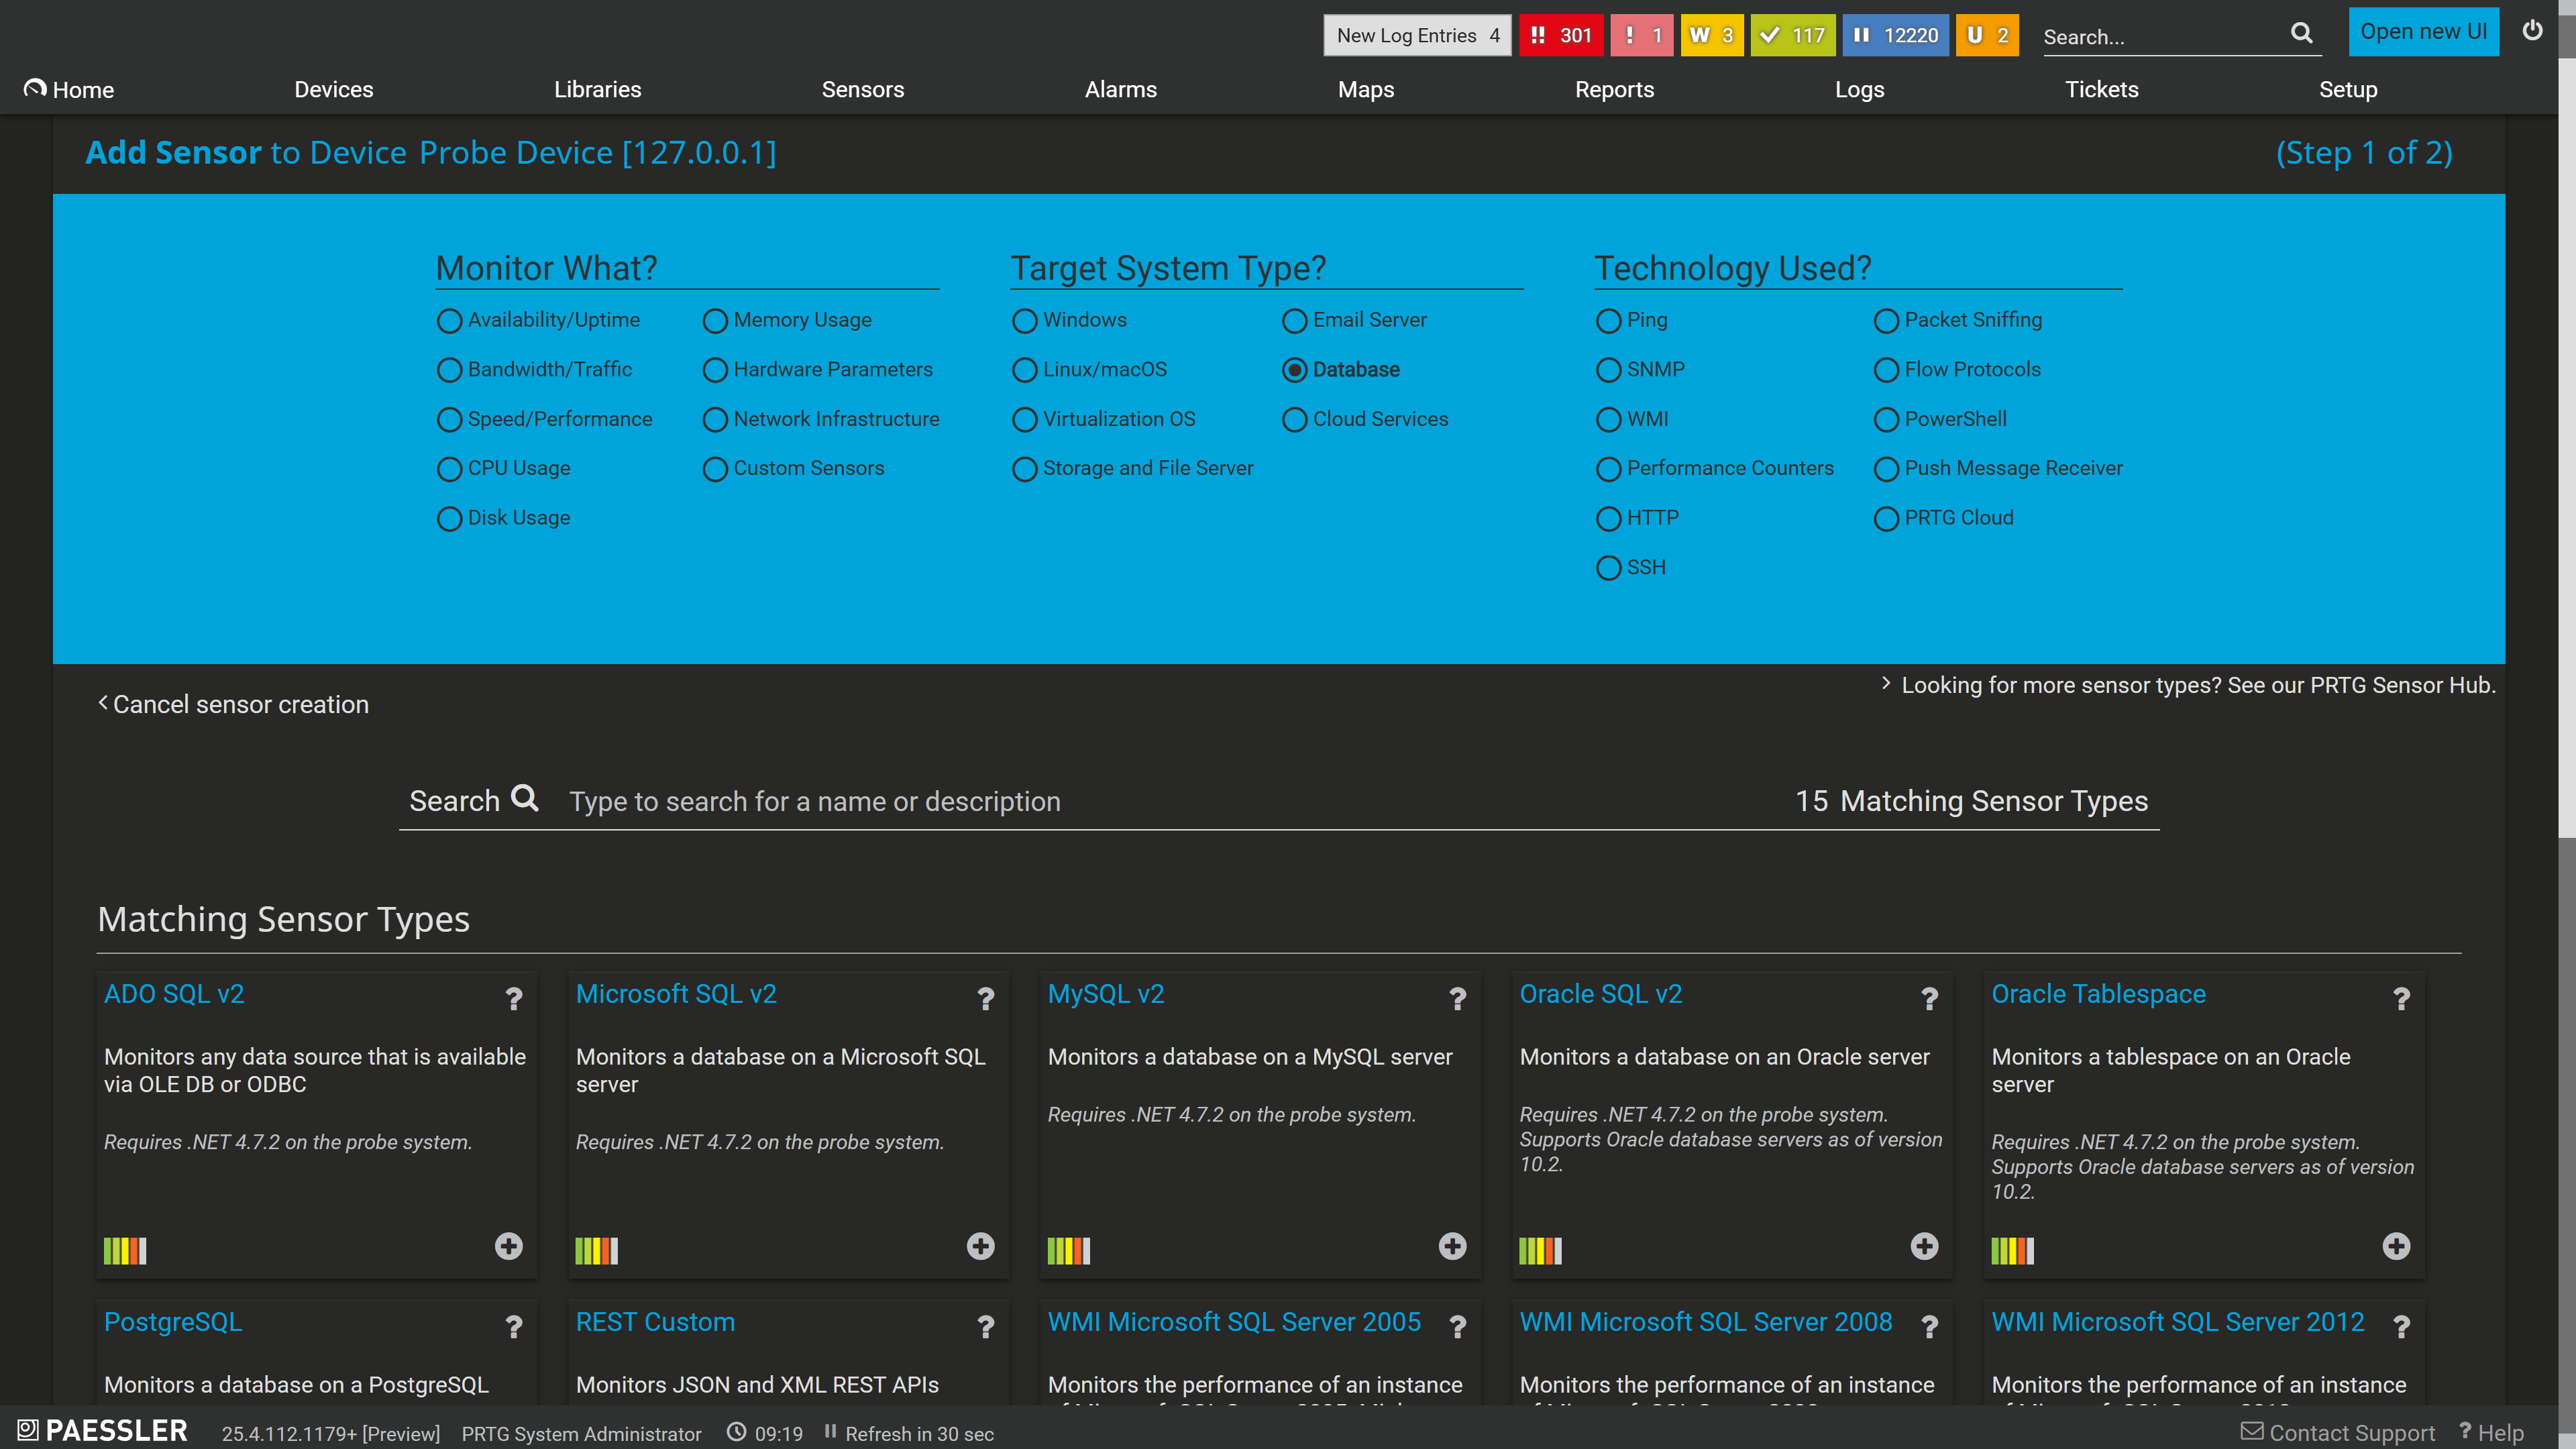
add-sensor-database-filter-classic
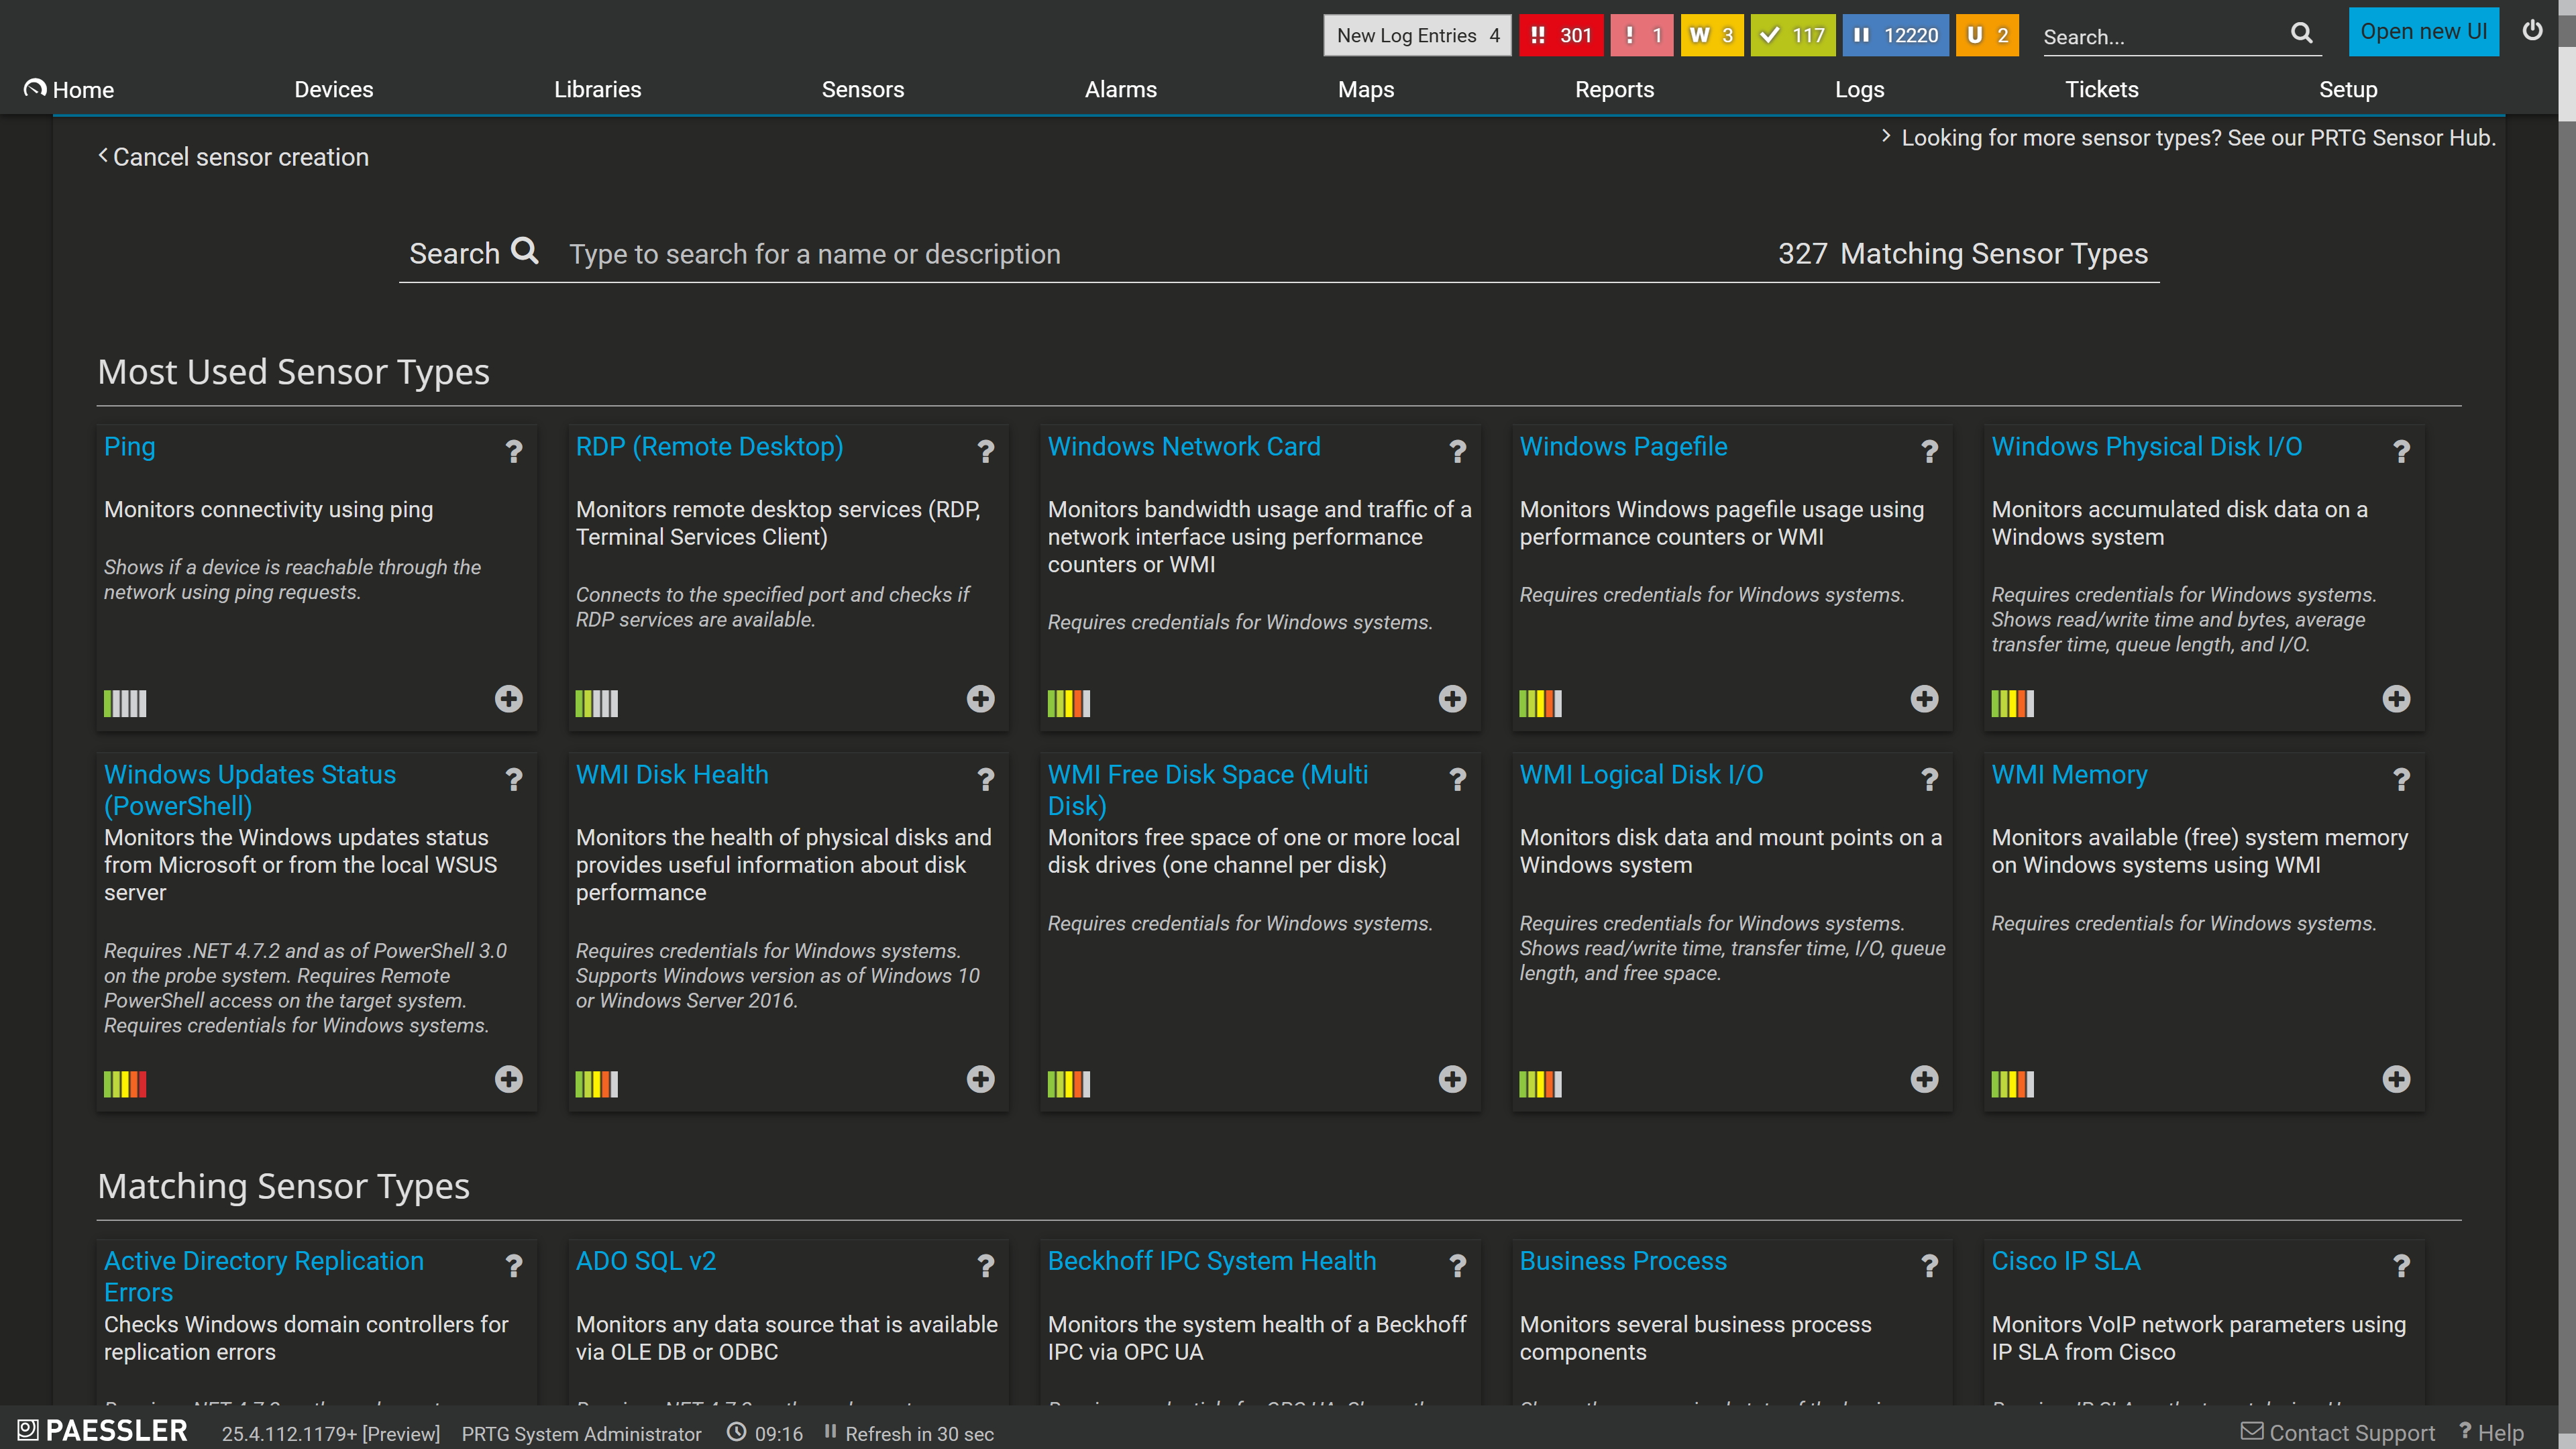
PRTG: Add Sensor, No filters Classic View

Since we started using PRTG, our DCIM has been running 100% stable. Since 2017, we have had 0% downtime with PRTG. That’s fantastic.

Ronald Kok, CEO
All IT Rooms

PRTG is a great product, which simply just works. Price and scope of features were the key drivers behind our choice of PRTG.

Brad Mennen, Systems Administrator
Hume Bank

PRTG alerts are extremely useful and give us a heads up on potential issues before they escalate. This has allowed us to be more proactive, as opposed to being reactive. I would recommend PRTG because it has helped us significantly improve service uptime by highlighting important alerts that would otherwise result in a system failure or service disruption if action was not taken. Thanks to PRTG, we can ensure that The Ritz London’s network and IT systems are five-star, just like the hotel.

Richard Isted, IT Manager
The Ritz London

Ready to stop firefighting and start monitoring proactively? 

PRTG deploys in hours. Start your free 30-day trial - no credit card required

free downLoad

Pre-configured sensors for the infrastructure you actually run 

From standard IT infrastructure to industrial systems, PRTG covers the monitoring scenarios that matter most to Distributed Enterprise IT teams. Here are some of the most relevant sensor types. 

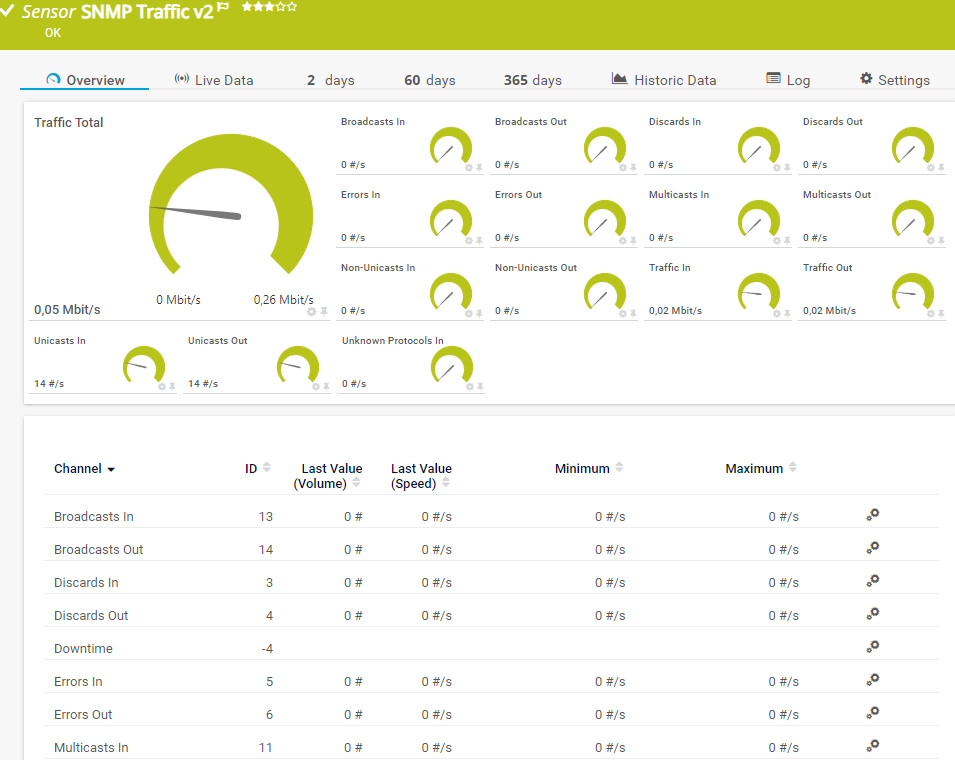
SNMP Traffic v2

The SNMP Traffic v2 sensor monitors bandwidth and traffic on a device. It can show the following:

  • Number of incoming and outgoing broadcast, multicast, unicast, and non-unicast packets
  • Number of incoming and outgoing discards and errors
  • Total, incoming, and outgoing traffic
  • Number of incoming, unknown protocols
SNMP Traffic v2
SNMP Traffic v2

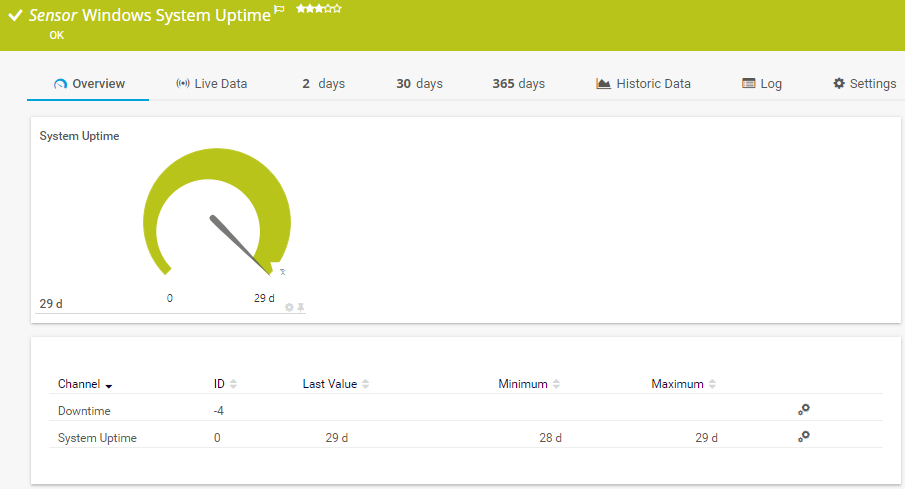
Windows System Uptime

The Windows System Uptime sensor monitors the uptime of a Windows system via Windows Management Instrumentation (WMI) or Windows performance counters. It can show the following:

  • Downtime
  • System uptime
Windows System Uptime

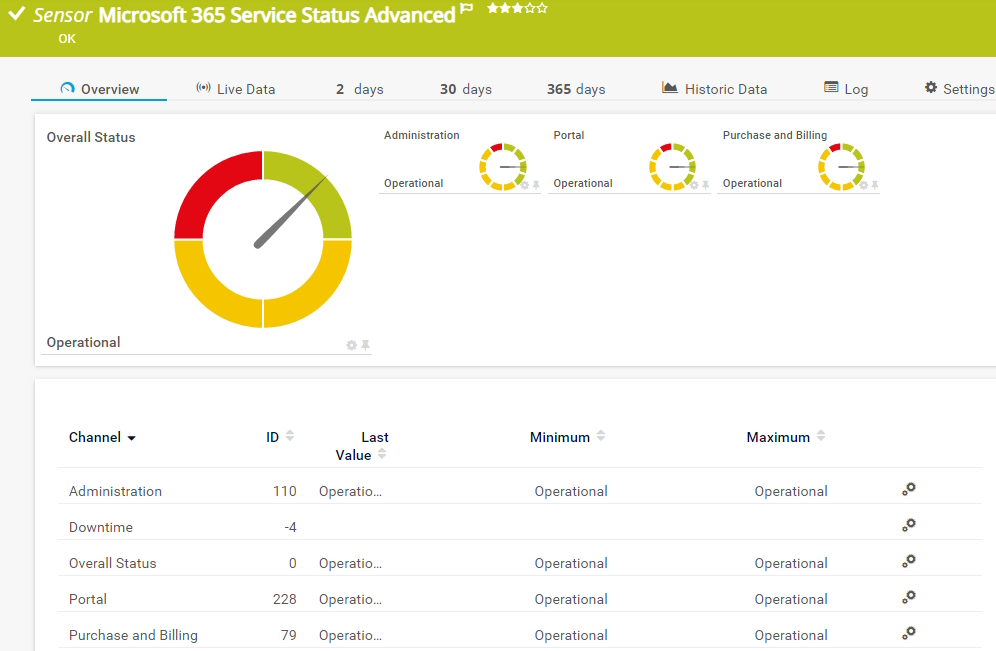
Microsoft 365 Service Status Advanced

The Microsoft 365 Service Status Advanced sensor accesses the Microsoft API to monitor the detailed status of a service of a Microsoft 365 subscription. It can show the following:

  • Overall status
  • Administration status
  • Portal status
  • Purchase and billing status
Microsoft 365 Service Status Advanced

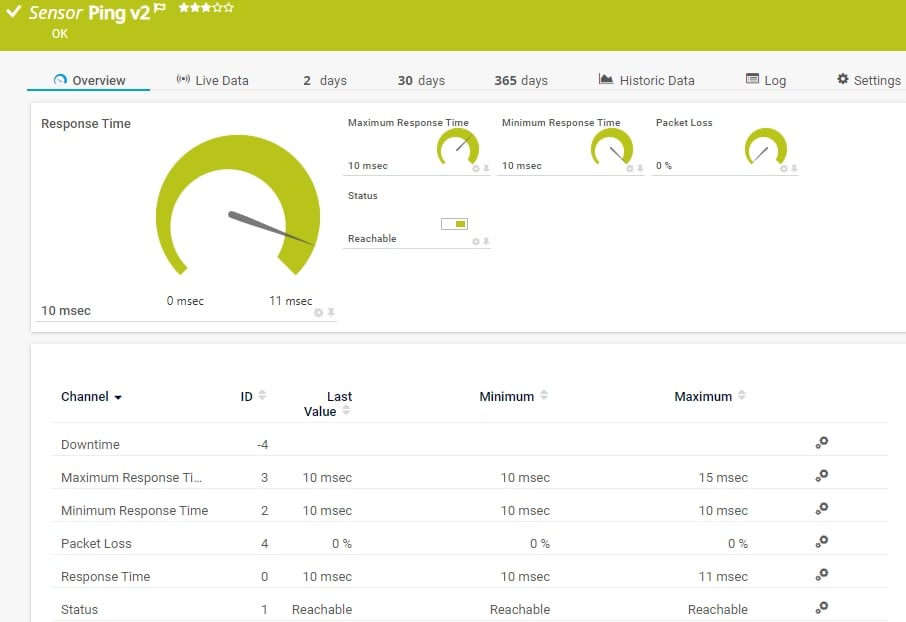
Ping v2

The Ping v2 sensor sends an Internet Control Message Protocol (ICMP) echo request ("ping") from the probe system to the parent device to monitor its availability. It can show the following:

• Response time

• Packet loss

• Target status

• Minimum and maximum ping time

Ping v2
Ping v2

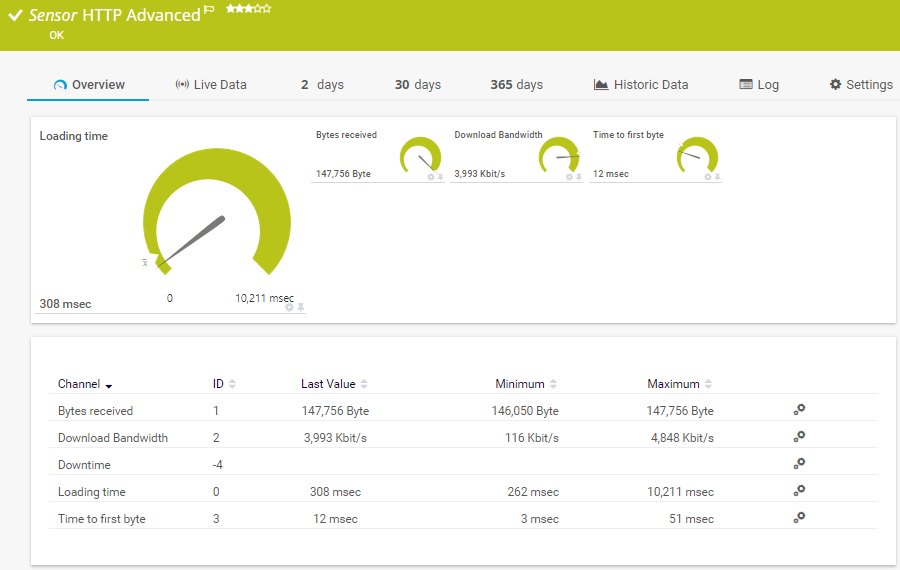
HTTP Advanced

The HTTP Advanced sensor monitors the source code of a web page using HTTP. It supports authentication, content checks, and other advanced parameters. It can show the following:

  • Number of bytes received
  • Download speed
  • Loading time
  • Time to the first byte
HTTP Advanced
HTTP Advanced

See all 250+ sensor types in the PRTG Sensor Manual

Companies like yours trust PRTG to keep IT running 

More than 500,000 users worldwide rely on PRTG - small IT teams managing 50 to thousands devices. 

Logo Cow Manager

Monitoring 20,000 Cows - no IT team required

CowManager is a small, Netherlands-based team that gives dairy farmers real-time health and fertility data via ear sensors — some for herds of over 20,000 cows. With no dedicated IT department, they rely on PRTG to keep their entire cloud infrastructure and data pipeline running, alerting the support team by text before a customer even notices a problem.

Read full case study

Logo Noris Inklusion

Too Hot to Work? PRTG Found the Fix

At Noris Inklusion, PRTG doesn't just watch servers — it tracks indoor and outdoor temperature in the workshops. When summer heat made conditions unbearable, long-term data from PRTG revealed that early-morning ventilation would cool things down for the day — a fix the team wouldn't have found without the historical trend data. A small, practical example of monitoring paying off in daily working conditions, not just uptime.

Read full case study

Logo BBS Holzminden

Three Teachers, 1,000 Sensors, Zero Dedicated IT Staff

Like most schools, BBS Holzminden has no IT department — just three teachers who double as IT administrators for 1,650 students. PRTG's auto-discovery found sensors they hadn't even thought to monitor, and now around 1,000 sensors keep watch over the school's entire network — freeing up teaching staff instead of eating their prep time.


Read full case study

Our Users Give Top Ratings for Monitoring With Paessler PRTG

Gartner peer insights
spiceworks
G2
Capterra

Not ready to trial yet? Start here.

Resources Solution

Product Demo

See PRTG in a scenario that mirrors a distributed IT deployment — dashboards, local alerts, and OT sensor examples. 

Watch now

Resources Content

Getting Started Guide 

Step-by-step guide for deploying PRTG in your environment — including auto-discovery and first sensor setup. 

Read the guide

Frequently Asked Questions

How quickly can my team get PRTG up and running?

Most customers have PRTG installed and monitoring their core infrastructure within a few hours. Auto-discovery finds your devices automatically, and pre-configured sensors start collecting data immediately – no complex configuration or consulting required. 

Do I need a dedicated monitoring expert to manage PRTG?

No. PRTG is designed for lean IT teams where one person is responsible for everything. The interface is intuitive for IT generalists, and the built-in alerting means PRTG proactively tells your team what needs attention – you don’t have to watch dashboards all day. 

What does PRTG monitor out of the box?

PRTG ships with more than 250 pre-configured sensor types covering network devices (SNMP, NetFlow, sFlow), Windows and Linux servers (WMI, SSH), cloud services (AWS, Azure, Microsoft 365), applications, databases, and more. Custom sensors via REST API and scripting extend coverage further. 

How is PRTG priced? Is it affordable for a small IT team?

PRTG uses sensor-based licensing – you pay for the number of sensors you use, not the number of users or devices. A free 30-day trial gives you access to all features with no credit card required. This makes it accessible for small and mid-sized teams who need professional-grade monitoring without enterprise pricing. 

What’s the difference between PRTG Network Monitor and PRTG Hosted Monitor?

PRTG Network Monitor is self-hosted on your own infrastructure (Windows). PRTG Hosted Monitor is a cloud-hosted version managed by Paessler – ideal if you want monitoring without maintaining the monitoring server itself. Both offer the same core monitoring capabilities. 

Can PRTG integrate with our existing helpdesk or alerting tools?

Yes. PRTG can send alerts to tools like PagerDuty, OpsGenie, Slack, Microsoft Teams, and standard ticketing systems via email, webhooks, and HTTP actions. It also sends syslog and SNMP traps to other IT tools when needed. 

Start monitoring your entire IT environment today 

Your infrastructure deserves proper monitoring – even if your team is a team of one. 
Start your free 30-day trial. No credit card, no consultants, no complexity. 
free downLoad

Products

  • Paessler PRTG
    Paessler PRTGMonitor your whole IT infrastructure
    • PRTG Network Monitor
    • PRTG Enterprise Monitor
    • PRTG Hosted Monitor
    • PRTG UVexplorer
    • PRTG extensions
      Extensions for Paessler PRTGExtend your monitoring to a new level
  • Icon Features
    FeaturesExplore all monitoring features

Monitoring with PRTG

  • Network monitoring
  • Bandwidth monitoring
  • SNMP monitoring
  • Network mapping
  • Wi-Fi monitoring
  • Server monitoring
  • Network traffic analyzer
  • NetFlow monitoring
  • Syslog server

Useful Links

  • PRTG Manual
  • Knowledge Base
  • Customer Success Stories
  • About Paessler
  • Subscribe to newsletter
  • PRTG Support
  • PRTG Consulting
  • PRTG Feedback & Roadmap

Contact

Paessler GmbH
Thurn-und-Taxis-Str. 14, 
90411 Nuremberg 
Germany

[email protected]

+49 911 93775-0

  • Contact us
©2026 Paessler GmbHTerms & ConditionsPrivacy PolicyImprintReport VulnerabilityDownload & InstallSitemap
CCTV CCTV CCTV