• Company
    • About Us
    • Press Center
    • Careers
    • Blog
    • IT Knowledge
    • Contact us
  • Contact us
  • Login
 
  • English
    • Deutsch
    • Español
    • Français
    • Italiano
    • Português
Paessler
                    - The Monitoring Experts
  • Products
    • Paessler PRTG
      Paessler PRTGMonitor your whole IT infrastructure
      • PRTG Network Monitor
      • PRTG Enterprise Monitor
      • PRTG Hosted Monitor
      • PRTG UVexplorer
      • PRTG extensionsExtensions for Paessler PRTGExtend your monitoring to a new level
    • Icon Features
      FeaturesExplore all monitoring features
      • Maps & dashboards
      • Alerts & notifications
      • Multiple user interfaces
      • Distributed monitoring
      • Customizable reporting
  • Solutions
    • By TeamFor your organization size
      • Small Business IT
      • Mid-Market IT
      • Enterprise IT
      • MSP Network Monitoring
    • Industries
      By IndustryFor your business sector
      • Industrial
      • Healthcare
      • Energy
      • Government
      • Education
      • Data Center
      • Finance
    • IT Topics
      By Use CaseFor every technical scenario
      • Network Monitoring
      • Server Monitoring
      • OT Monitoring
      • Distributed Monitoring
      • Network Topology Mapping
      • SNMP Monitoring
      • Bandwidth Monitoring
  • Pricing
  • Resources
    • Getting Started
      Getting StartedModules for self-paced learning
    • How-to Guides
      How-to GuidesGet the most out of PRTG
    • Videos & Webinars
      Videos & WebinarsLearn from Paessler experts
    • Case StudiesProven results across industries
    • PRTG Manual
      PRTG ManualFull documentation
    • Knowledge Base
      Knowledge BaseShare community knowledge
    • PRTG Sensor Hub
      PRTG Sensor HubGet sensors, scripts & templates
    • Trainings
      PRTG TrainingLearn how to work with PRTG
  • Partners
    • Icon Handshake
      Become a PartnerFor resellers and channel partners
    • Icon MSP
      Become an MSPDeliver monitoring as a managed service
    • icon partner
      Partner PortalLog in to your partner account
    • Deal Registration
      Deal RegistrationRegister your sales opportunities
    • icon search
      Find a PartnerFind partners selling Paessler products
    • icon technology
      Technology AlliancesSee Paessler technology partnerships
    • Partner HubTools for Your Success
  • Company
    • About Us
    • Press Center
    • Careers
    • Blog
    • IT Knowledge
    • Contact us
  • Contact us
  • Login
  • English
    • Deutsch
    • Español
    • Français
    • Italiano
    • Português
  • Get a quote
  • Free trial
  1. Home>
  2. Company>
  3. Case Studies>
  4. CowManager

Eyes on every cow: how CowManager keeps its global livestock monitoring platform running with PRTG 

Challenge: Cloud infrastructure behind a global livestock IoT platform must be reliable 24/7 for farmers worldwide

download PDF
Logo CowManager

COMPANY
CowManager

INDUSTRY
IT & Telecommunication

COMPANY SIZE
SMB

COUNTRY
Netherlands

SCALE
Cloud-native, global farm network, PRTG Hosted Monitor

Icon watch

Cloud infrastructure and Azure processes monitored 24/7 via PRTG Hosted Monitor

Icon Notifications

SMS alerts reach the team before farmers notice any disruption to their monitoring service

Icon monitoring dashboard

PowerShell integration enables a single dashboard for all operational processes and data sources

The problem

CowManager is a Dutch AgriTech company providing dairy farmers with real-time IoT monitoring via ear sensors. The system tracks fertility, health, nutrition, and location for herds ranging from 20 to more than 20,000 cows worldwide, delivering insights via mobile app and web dashboard. 

Farmers depend on CowManager around the clock. If the cloud infrastructure fails or data is not collected correctly, farmers miss critical alerts: cows in heat, sick animals, and feeding anomalies go undetected, with direct consequences for milk production and animal welfare. 

CowManager needed infrastructure monitoring as reliable as the service it promises to farmers. 

What changed with PRTG

CowManager runs entirely in the cloud, with PRTG Hosted Monitor tracking network connections, stored data, analysis processes, and Azure infrastructure in real time. The support team receives SMS alerts for critical sensors before customers report any issue. 

PowerShell integration feeds Azure data directly into PRTG, giving the DevOps team a single system to monitor all operational processes. When migrating from on-premises PRTG to PRTG Hosted Monitor, a PowerShell script using the open-source 'prtgapi' module recreated the entire sensor configuration automatically. 

PRTG runs continuously alongside the platform. If anything goes wrong, the team receives an alert immediately, regardless of the time of day.

For certain PRTG sensors, the support team will receive a text message if something is happening. They must be kept abreast of any problems before they get any questions about them from customers. We have become truly proactive thanks to PRTG.


Gert-Jan Hiddink, DevOps Engineer
CowManager
PRTG Logo

PRTG Hosted Monitor gives AgriTech and IoT companies the cloud visibility to keep data flowing for customers who depend on it 24/7.

free TRIAL
case study cowmanager
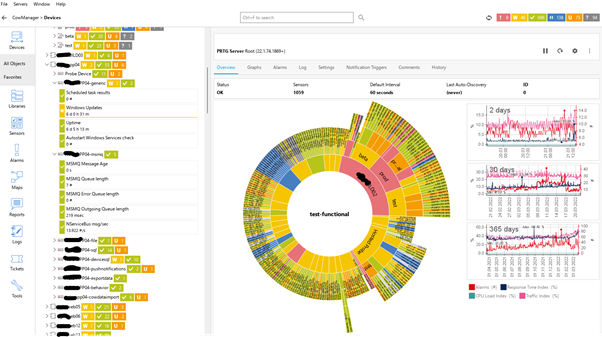
case study cowmanager screenshot subburst view
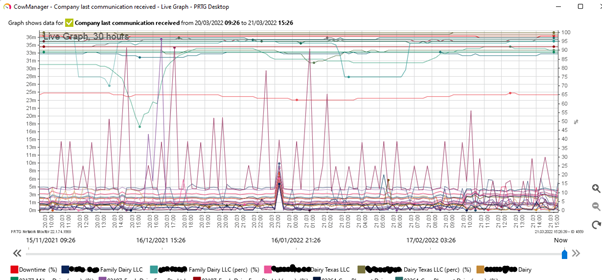
case study cowmanager screenshot live graph
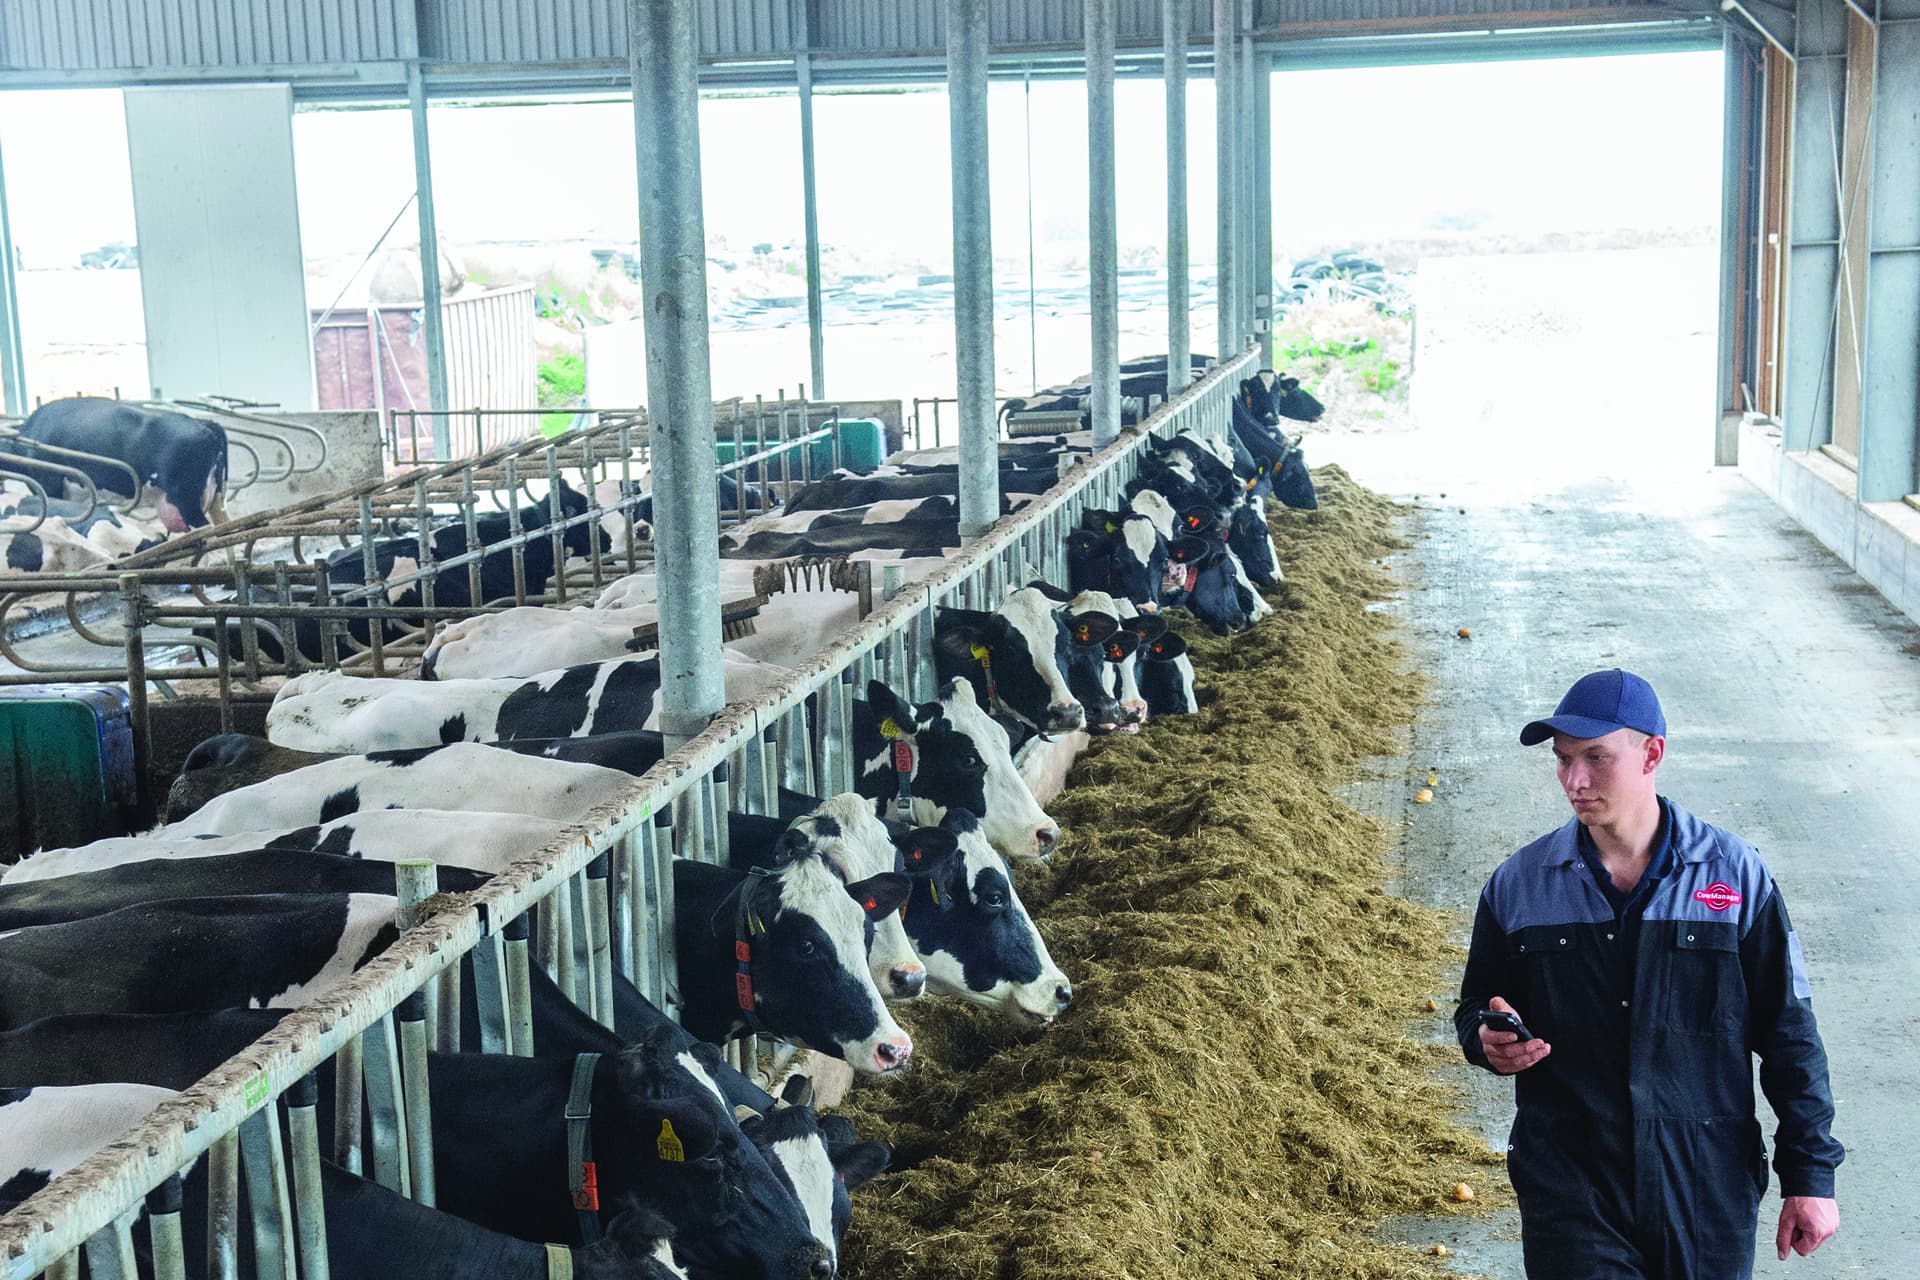
case study cowmanager cow stable
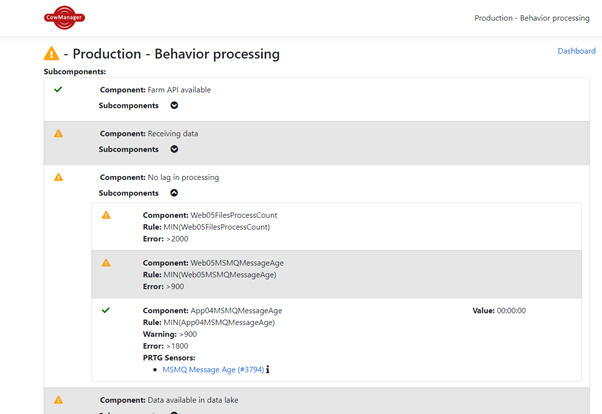
case study cowmanager screenshot application dashboard

Discover more monitoring insights and stories

Solution illustration

Solutions for all your monitoring needs

  • SaaS Monitoring
  • Cloud Performance Monitoring
  • Hybrid Cloud Monitoring
Content illustration

Powerful stories from the monitoring world

  • Customer success stories - Paessler
  • Paessler contributes to greater efficiency and better welfare for cows ...
  • Customer success story: Riverford & PRTG
Support illustration

Resources to master your monitoring challenges

  • How can I speed up PRTG—especially for large installations?
  • How can I propose new features or sensors for PRTG?
  • How can I use the PRTG Application Programming Interface (API)?
Explore All Case Studies

Products

  • Paessler PRTG
    Paessler PRTGMonitor your whole IT infrastructure
    • PRTG Network Monitor
    • PRTG Enterprise Monitor
    • PRTG Hosted Monitor
    • PRTG UVexplorer
    • PRTG extensions
      Extensions for Paessler PRTGExtend your monitoring to a new level
  • Icon Features
    FeaturesExplore all monitoring features

Monitoring with PRTG

  • Network monitoring
  • Bandwidth monitoring
  • SNMP monitoring
  • Network mapping
  • Wi-Fi monitoring
  • Server monitoring
  • Network traffic analyzer
  • NetFlow monitoring
  • Syslog server

Useful Links

  • PRTG Manual
  • Knowledge Base
  • Customer Success Stories
  • About Paessler
  • Subscribe to newsletter
  • PRTG Support
  • PRTG Consulting
  • PRTG Feedback & Roadmap

Contact

Paessler GmbH
Thurn-und-Taxis-Str. 14, 
90411 Nuremberg 
Germany

[email protected]

+49 911 93775-0

  • Contact us
©2026 Paessler GmbHTerms & ConditionsPrivacy PolicyImprintTrust CenterDownload & InstallSitemap
Contact Contact Contact