COMPANY
GRUPOTEC
INDUSTRY
Energy & Utilities
COMPANY SIZE
Midsized Company
COUNTRY
Spain
SCALE
20 solar parks, global sites, SCADA and IT infrastructure
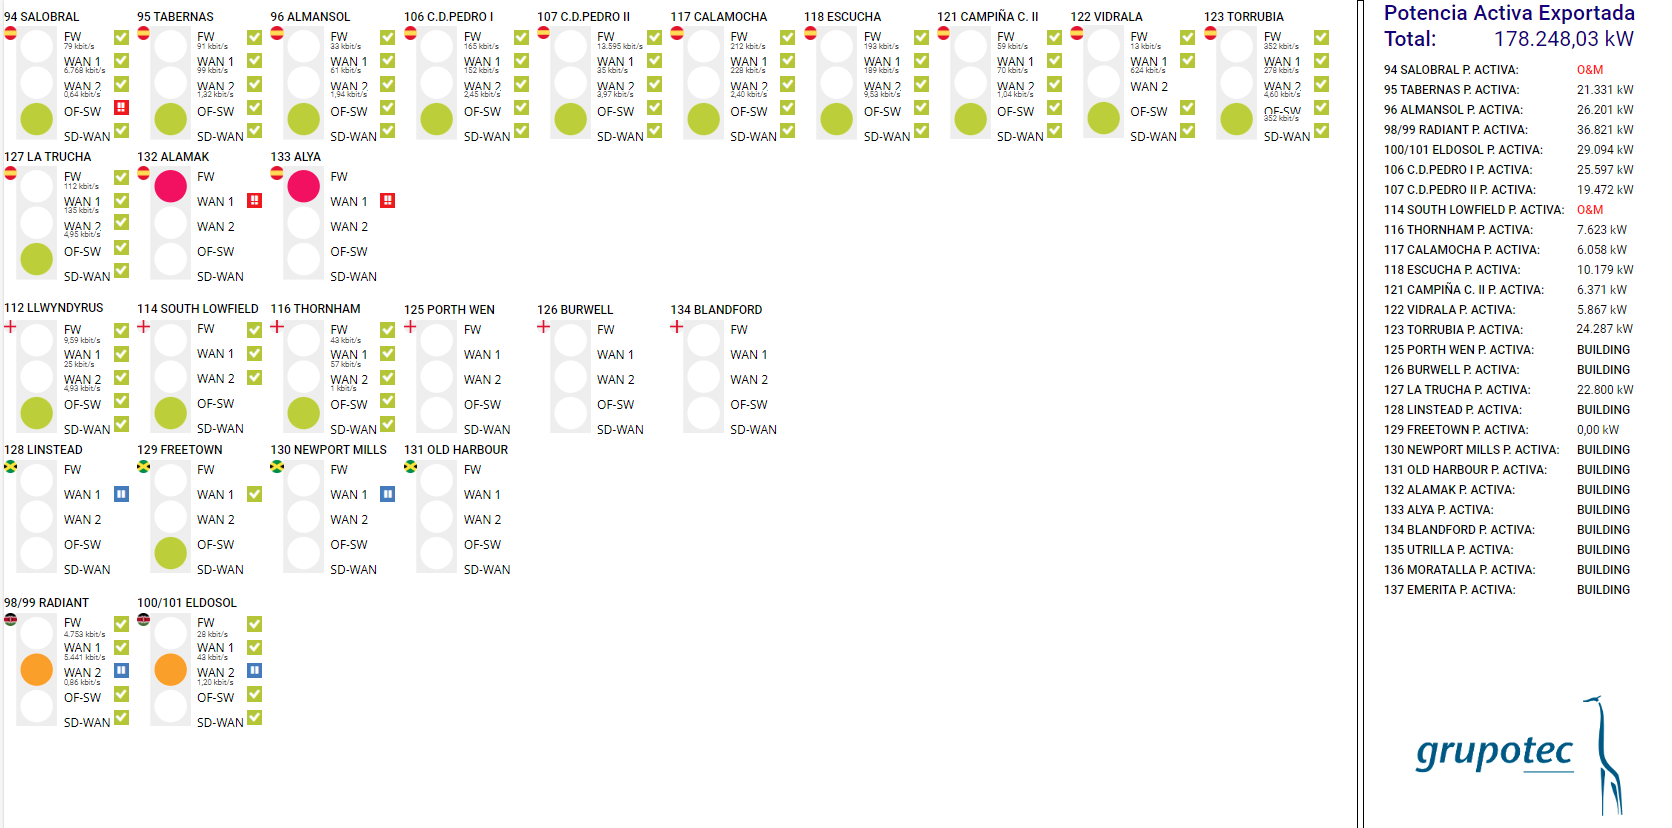
GRUPOTEC operates 20 solar parks across Spain, the UK, France, Kenya, and the Caribbean. As operator, GRUPOTEC is responsible for all IT networks, communications, and plant equipment, under strict SLAs demanding 99% communications availability. Outages trigger penalties.
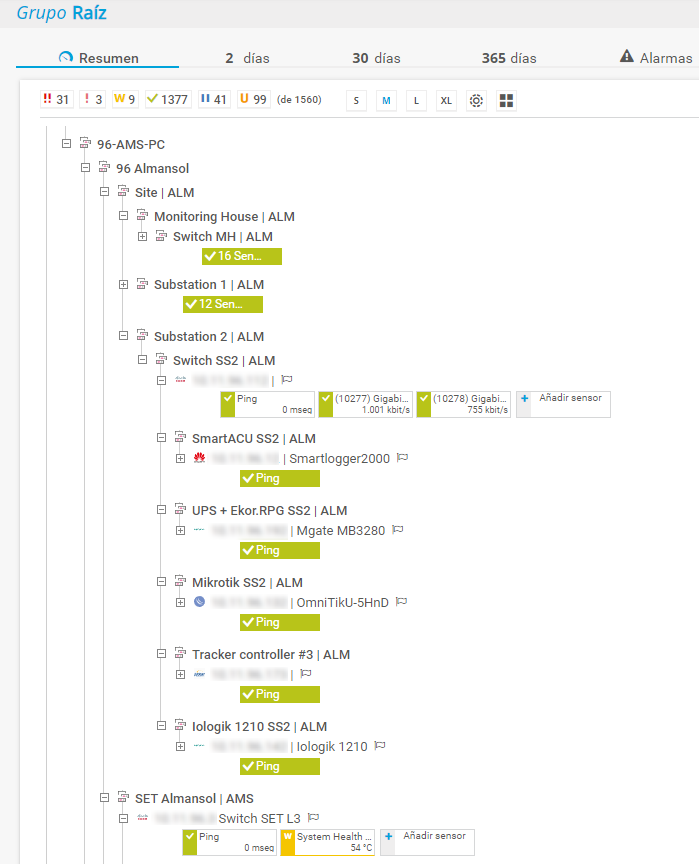
Each park runs a local SCADA system. Faults must be immediately reported to the control center in Spain. GRUPOTEC's home-built Nagios solution became too complex and costly.
A commercial solution was needed to unify SCADA and IT monitoring from one platform.
On a partner recommendation, GRUPOTEC deployed PRTG. All solar parks were integrated into central monitoring within days, with most of the Nagios migration completed during the free trial.
Every park has redundant fiber optic infrastructure and VPN back to headquarters. PRTG monitors switches, firewalls, and bandwidth via SNMP across 2 to 20 devices per plant.
The Business Process sensor combines data from multiple sensors using custom formulas, instantly showing whether a fiber fault needs immediate intervention or whether the backup link is holding.
Modbus TCP sensors extend visibility to solar controllers, giving the control center live power generation data regardless of which local SCADA system is in use.
At the beginning of the 30-day free trial period, we had already done much of the migration from Nagios to PRTG and implemented many new and useful features. After purchasing the license, we then only had to enter the license key and could continue working without interruption. In my opinion, this is how a migration should work: without any risk and with minimal effort.