Custom alerts and data visualization let you quickly identify and prevent industrial IT and OT network issues.
SCADA systems play a crucial role in OT networks that rely heavily on industrial automation. If they go down, the results will be costly.
However, while SCADA systems provide data about OT and production systems, this is only part of the picture. What about the hardware that supports the SCADA system? Or the status of Industrial PCs that are used in the industrial environment?
Paessler PRTG is comprehensive monitoring software that provides a holistic overview of your IT and OT – all in one place. Use it alongside control and execution systems (MES, DCS, Historian, BMS) to provide even more value for operators, engineers, and technicians.

In addition to OT metrics collected by SCADA systems, there are many other data points that are important for understanding an industrial environment.
PRTG collects real-time data from many areas of your infrastructure, for example:
PIt’s also vital that you keep an eye on the availability and health of the hardware that your SCADA system runs on to make sure it works smoothly and efficiently.
PRTG lets you monitor SCADA data such as the CPU load, memory, storage space, performance, related databases and other metrics from the environment that your SCADA runs in.
Using SNMP, PRTG can also ensure that the systems themselves are up and running and provide alerts in the case of issues.
While a SCADA system already provides you with alarms when things go wrong in your OT network, PRTG can add a different level of alerting to ensure that nothing gets missed – such as warnings about the servers that the SCADA system runs on.
With PRTG, you can set thresholds so you’re alerted when conditions deviate from what is considered “normal”.
PRTG can also notify the right teams with targeted escalation notifications using various methods such as SMS, email, in-app push messages, and more.
Diagnose network issues by continuously tracking your IT and OT networks. Show SCADA system status, health, and performance in real time. Visualize monitoring data in clear graphs and dashboards to identify problems more easily. Gain the overview you need to troubleshoot issues on the production floor.
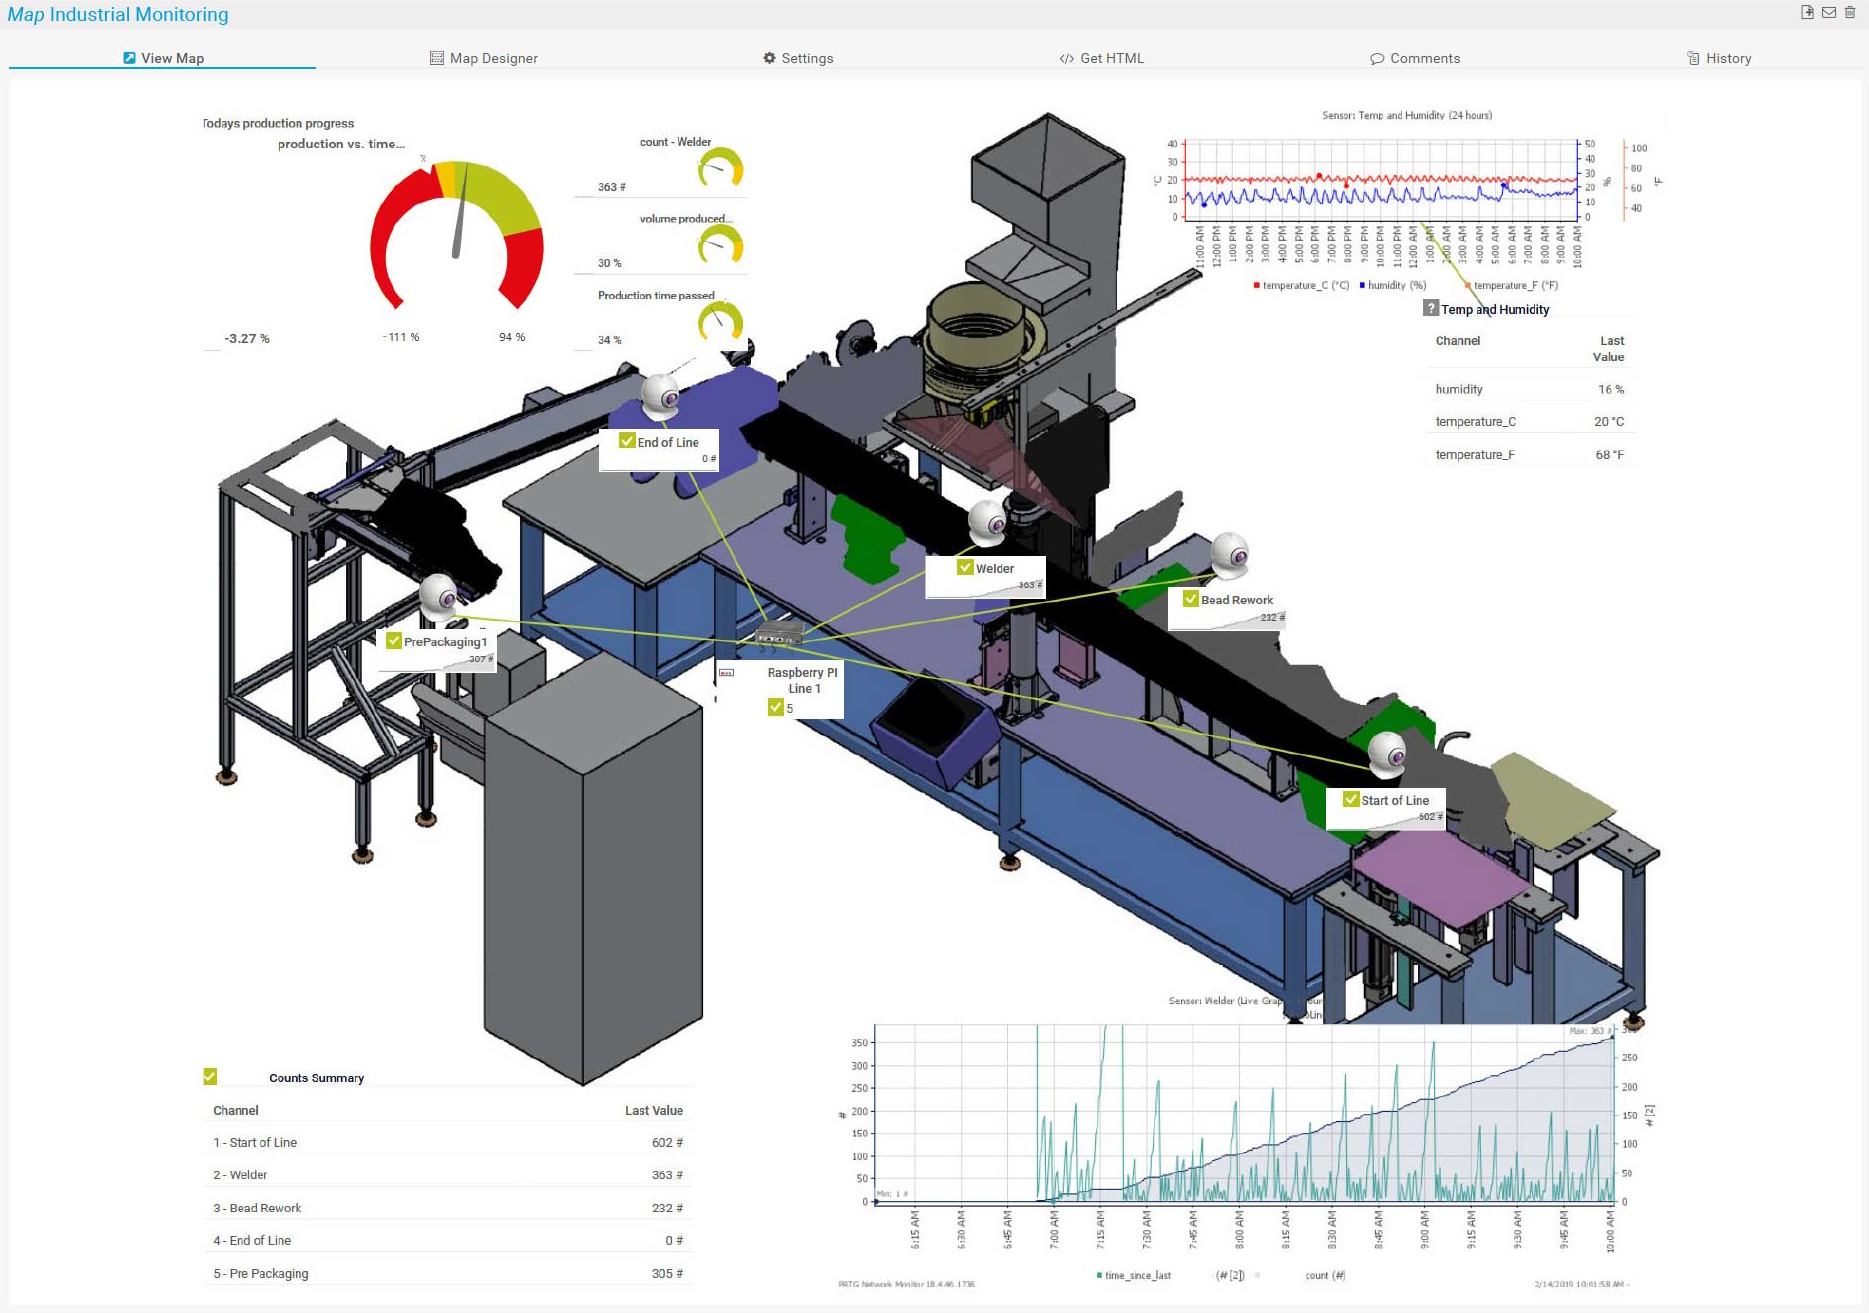
Map industrial monitoring in PRTG
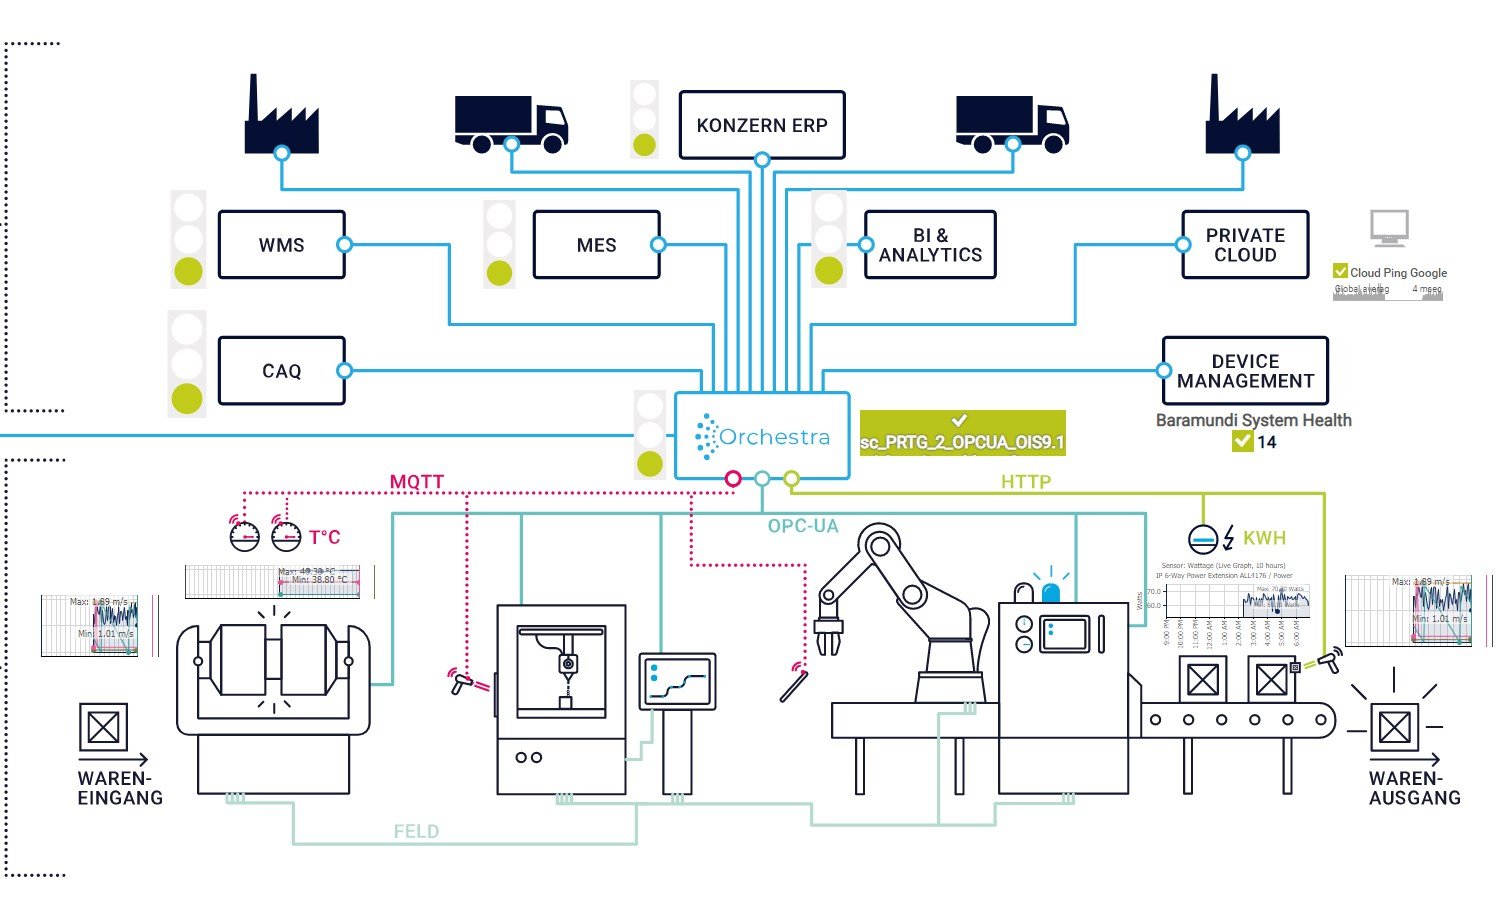
Map industrial Orchestra in PRTG

Device tree view of the complete monitoring setup

Custom PRTG dashboard for keeping an eye on the entire IT infrastructure

Live traffic data graph in PRTG
Awarded 3rd place in the
Software & IT category
Winner in the Software &
Computers category
PRTG comes with more than 250 native sensor types for monitoring your entire on-premises, cloud, and hybrid cloud environment out of the box. Check out some examples below!
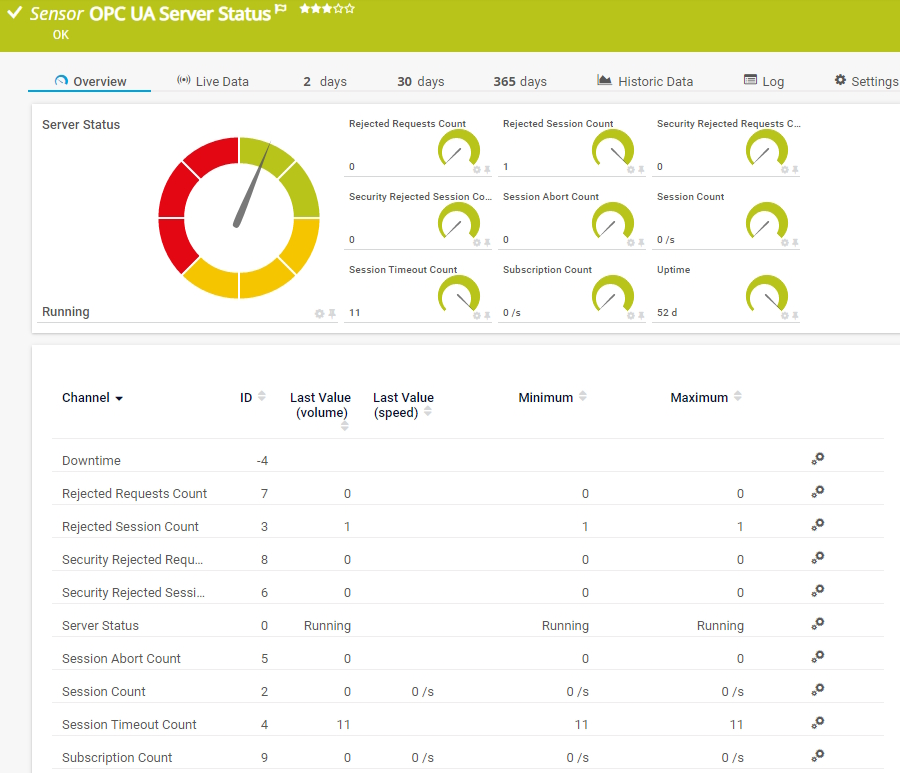
The OPC UA Server Status sensor monitors the server status, uptime, and diagnostic information of an OPC Unified Architecture (OPC UA) server. It can show the following:
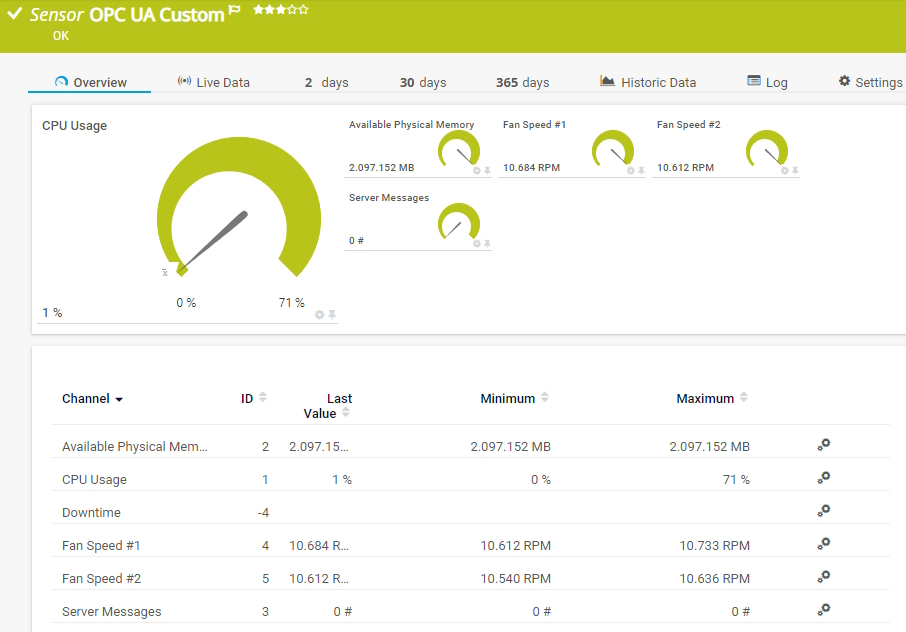
The OPC UA Custom sensor monitors up to ten numeric values returned by specific OPC Unified Architecture (OPC UA) NodeIDs. It can show the following:
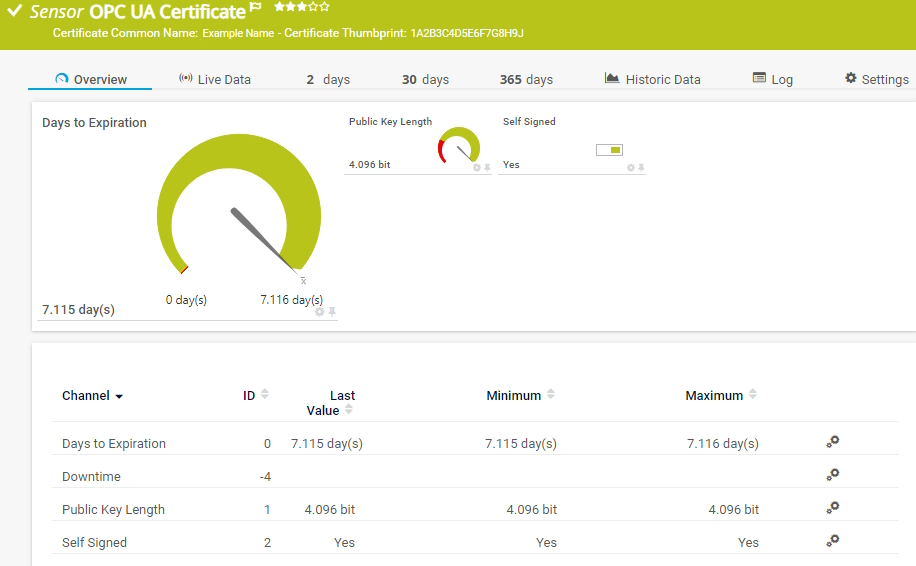
The OPC UA Certificate sensor monitors the certificate of an OPC Unified Architecture (OPC UA) server. It can show the following:
See the PRTG Manual for a list of all available sensor types.

Custom alerts and data visualization let you quickly identify and prevent industrial IT and OT network issues.
PRTG is set up in a matter of minutes and can be used on a wide variety of mobile devices.


“Excellent tool for detailed monitoring. Alarms and notifications work greatly. Equipment addition is straight forward and server initial setup is very easy. ...feel safe to purchase it if you intend to monitor a large networking landscape.”
Partnering with innovative IT vendors, Paessler unleashes synergies to create
new and additional benefits for joined customers.
Integrating monitoring results from PRTG into NetBrain maps makes the foundation for network automation.
IT that works constitutes a business-critical basis for a company's success. Availability and security must be defined for the respective purpose and closely monitored – by OT and IT alike.
With ScriptRunner Paessler integrates a powerful event automation platform into PRTG Network Monitor.
Real-time notifications mean faster troubleshooting so that you can act before more serious issues occur.
Network Monitoring Software – Version 26.1.116.1532 (February 9th, 2026)
Download for Windows and cloud-based version PRTG Hosted Monitor available
English, German, Spanish, French, Portuguese, Dutch, Russian, Japanese, and Simplified Chinese
Network devices, bandwidth, servers, applications, virtual environments, remote systems, IoT, and more
Choose the PRTG Network Monitor subscription that's best for you


Supervisory Control and Data Acquisition (SCADA) systems are made up of SCADA software and hardware components that are used to supervise and control industrial processes.
SCADA systems monitor data in real time and give users a human-machine interface (HMI) for providing process commands to components such as control valves, actuators, motors, and more.
They are crucial for industrial organizations since they help to maintain efficiency, process data for smarter decisions, and communicate system issues to help mitigate downtime.
SCADA systems are connected to Programmable Logic Controllers (PLCs) and Remote Terminal Units (RTUs), which in turn gather data from sensors and devices in a plant.
This gathered data can be used for automated responses (such as reducing pressure in a system when it gets too high), insights into the production process, and for triggering alarms when there is a failure.
SCADA systems are used by a wide variety of companies and organizations. They can be implemented to monitor and control power grids, water treatment plants, processes on a production floor, and more. Metrics that are monitored include everything from pressure, power utilization and production time, ,to facility processes heating, ventilation, and HVAC systems of buildings.
With PRTG, you can monitor every SCADA system itself that supports OPC UA.
To bring PRTG alarms and metrics directly into your SCADA system, you need our product extension Paessler PRTG OPC UA Server. The following integrations have already been tested:
In PRTG, “sensors” are the basic monitoring elements. One sensor usually monitors one measured value in your network, for example the traffic of a switch port, the CPU load of a server, or the free space on a disk drive. On average, you need about 5-10 sensors per device or one sensor per switch port.
Paessler conducted trials in over 600 IT departments worldwide to tune its network monitoring software closer to the needs of sysadmins. The result of the survey: over 95% of the participants would recommend PRTG – or already have.

Paessler PRTG is used by companies of all sizes. Sysadmins love PRTG because it makes their job a whole lot easier.
Bandwidth, servers, virtual environments, websites, VoIP services – PRTG keeps an eye on your entire network.
Everyone has different monitoring needs. That’s why we let you try PRTG for free.