• Company
    • About Us
    • Case Studies
    • Press Center
    • Careers
    • Blog
    • Contact us
  • Contact us
  • Login
 
  • English
    • Deutsch
    • Español
    • Français
    • Italiano
    • Português
Paessler
                    - The Monitoring Experts
  • Products
    • Paessler PRTG
      Paessler PRTGMonitor your whole IT infrastructure
      • PRTG Network Monitor
      • PRTG Enterprise Monitor
      • PRTG Hosted Monitor
      • PRTG UVexplorer
      • PRTG extensionsExtensions for Paessler PRTGExtend your monitoring to a new level
    • Icon Features
      FeaturesExplore all monitoring features
      • Maps & dashboards
      • Alerts & notifications
      • Multiple user interfaces
      • Distributed monitoring
      • Customizable reporting
  • Solutions
    • By TeamFor your organization size
      • Small Business IT
      • Mid-Market IT
      • Enterprise IT
      • MSP Network Monitoring
    • Industries
      By IndustryFor your business sector
      • Industrial
      • Healthcare
      • Government
      • Education
      • Data Center
      • Finance
    • IT Topics
      By Use CaseFor every technical scenario
      • Network Monitoring
      • Server Monitoring
      • OT Monitoring
      • Distributed Monitoring
      • Network Topology Mapping
      • SNMP Monitoring
      • Bandwidth Monitoring
  • Pricing
  • Resources
    • Getting Started
      Getting StartedModules for self-paced learning
    • How-to Guides
      How-to GuidesGet the most out of PRTG
    • Videos & Webinars
      Videos & WebinarsLearn from Paessler experts
    • IT  Knowledge
      IT KnowledgeExpand your IT knowledge
    • PRTG Manual
      PRTG ManualFull documentation
    • Knowledge Base
      Knowledge BaseShare community knowledge
    • PRTG Sensor Hub
      PRTG Sensor HubGet sensors, scripts & templates
    • Trainings
      PRTG TrainingLearn how to work with PRTG
  • Partners
    • Icon Handshake
      Become a PartnerFor resellers and channel partners
    • Icon MSP
      Become an MSPDeliver monitoring as a managed service
    • icon partner
      Partner PortalLog in to your partner account
    • Deal Registration
      Deal RegistrationRegister your sales opportunities
    • icon search
      Find a PartnerFind partners selling Paessler products
    • icon technology
      Technology AlliancesSee Paessler technology partnerships
    • Partner HubTools for Your Success
  • Company
    • About Us
    • Case Studies
    • Press Center
    • Careers
    • Blog
    • Contact us
  • Contact us
  • Login
  • English
    • Deutsch
    • Español
    • Français
    • Italiano
    • Português
  • Get a quote
  • Free trial
  1. Home>
  2. Company>
  3. Case Studies>
  4. Siemens

One Platform for the Industrial Data Center: How Siemens Monitors the IADC with PRTG

Challenge: Monitoring a complex, virtualized industrial data center with IT and OT components from a single platform

download PDF
Logo Company Siemens

COMPANY
Siemens

INDUSTRY
Manufacturing

COMPANY SIZE
Enterprise

COUNTRY
Germany

SCALE
Small to mid-sized installation, on-site industrial data center

Icon Maps

Real-time overview maps provide live status across IT and OT infrastructure

Icon Probe

Remote probes extend monitoring across multiple networks and locations

Icon Alarm

Alerts delivered via email, push notification, SMS, and HTTP with no additional tooling required

The problem

Manufacturing environments have unique IT demands. An industrial data center running production-critical applications such as SIMATIC PCS 7, WinCC, TIA Portal, and COMOS cannot afford blind spots. If a component fails and nobody knows, production stops.

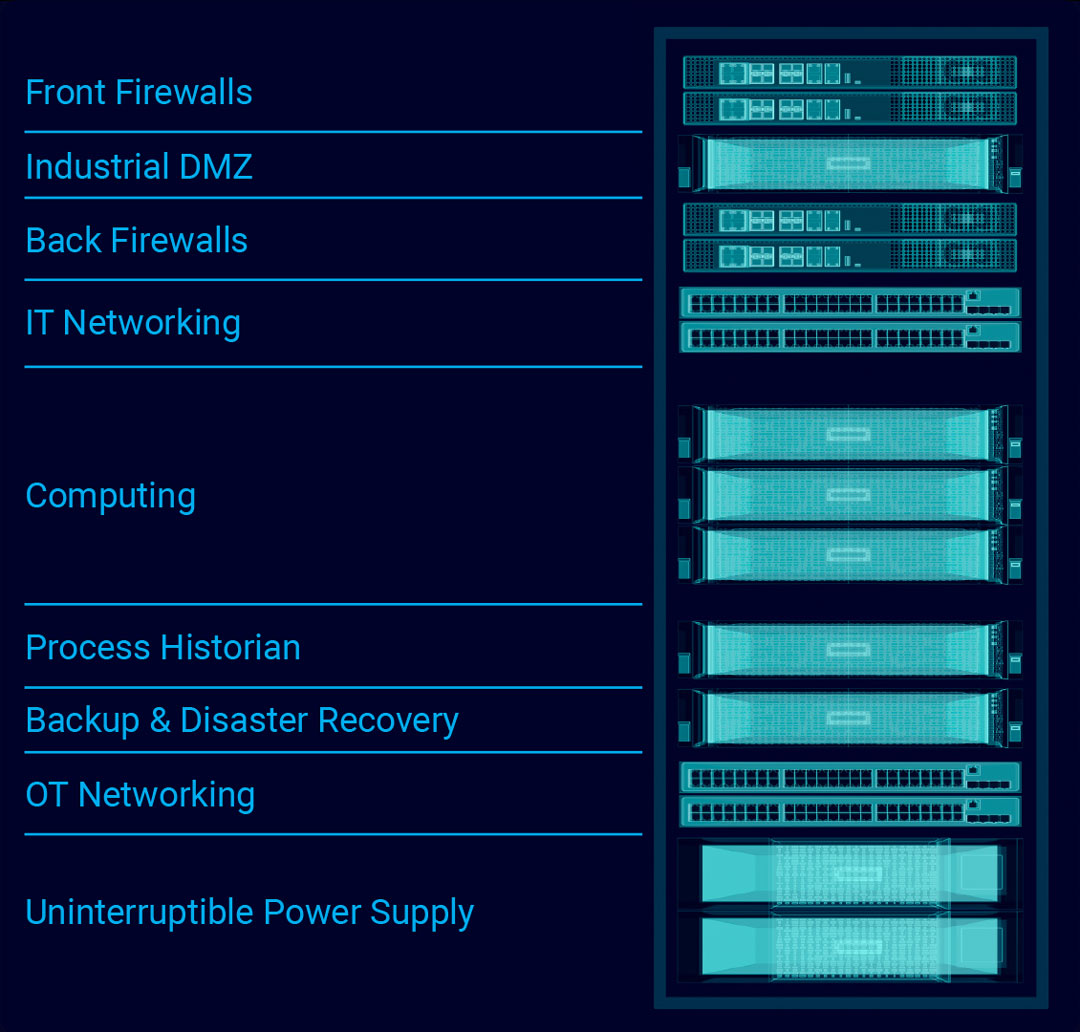
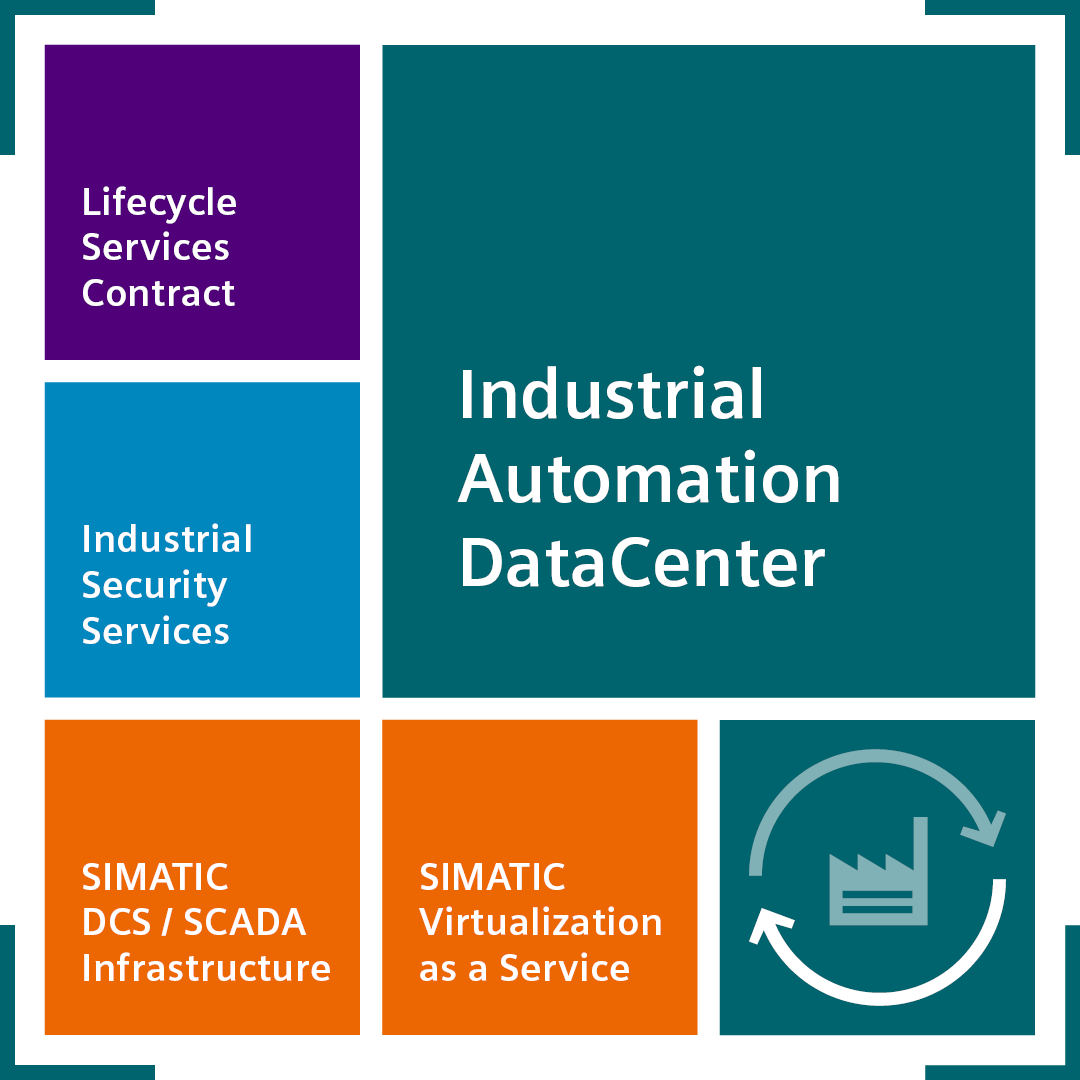
The Siemens Industrial Automation DataCenter (IADC) is a fully configured, on-site data center designed specifically for manufacturing environments. It integrates high-performance computing, IT and OT networks, backup and disaster recovery, process data archiving, uninterruptible power supply, and IEC 62443 compliant security architecture on a single hardware platform. Different hardware variants allow individual scaling across the full system lifecycle.

Monitoring such an environment requires a tool that can cover all of these components in one view, send alerts when something goes wrong, and work across multiple networks and locations without requiring a separate solution for each one.

What changed with PRTG

Siemens selected PRTG to monitor all components of the IADC from a single platform. More than 250 predefined native sensors cover the full range of data center monitoring needs out of the box.

PRTG remote probes extend monitoring across multiple networks at different locations and standalone networks within the enterprise, without requiring separate installations. Real-time overview maps give operators live status information across all components so they can act immediately when something changes.

The reporting feature provides historical monitoring data for any time period or system configuration. Reports can be scoped to all sensors or filtered to specific ones. Alerts are delivered via email, push notification, SMS, or HTTP request, with free PRTG apps for Android and iOS already included.

PRTG is an easy-to-use and comprehensive solution to monitor our Industrial Automation DataCenter (IADC).

Benjamin Lauterlein, Product Manager
Siemens AG
PRTG Logo

PRTG monitors industrial data centers, OT networks, and manufacturing infrastructure from one platform.

CONTACT SALES
case study siemens iadc logo
case study siemens iadc

Discover more monitoring insights and stories

Solution illustration

Solutions for all your monitoring needs

  • OT Network Monitoring
  • PLC Monitoring
  • Industrial IT Monitoring
Content illustration

Powerful stories from the monitoring world

  • Customer success stories - Paessler
  • PRTG multi-platform probe joining the Siemens Industrial Edge ...
  • Customer success story Centroflora Group
Support illustration

Resources to master your monitoring challenges

  • PRTG Manual: SIMATIC S7-300/400 CPU Status Sensor - Paessler
  • PRTG Manual: Device Settings - Paessler
  • PRTG Manual: Add a Device - Paessler
Explore All Case Studies

Products

  • Paessler PRTG
    Paessler PRTGMonitor your whole IT infrastructure
    • PRTG Network Monitor
    • PRTG Enterprise Monitor
    • PRTG Hosted Monitor
    • PRTG UVexplorer
    • PRTG extensions
      Extensions for Paessler PRTGExtend your monitoring to a new level
  • Icon Features
    FeaturesExplore all monitoring features

Monitoring with PRTG

  • Network monitoring
  • Bandwidth monitoring
  • SNMP monitoring
  • Network mapping
  • Wi-Fi monitoring
  • Server monitoring
  • Network traffic analyzer
  • NetFlow monitoring
  • Syslog server

Useful Links

  • PRTG Manual
  • Knowledge Base
  • Customer Success Stories
  • About Paessler
  • Subscribe to newsletter
  • PRTG Support
  • PRTG Consulting
  • PRTG Feedback & Roadmap

Contact

Paessler GmbH
Thurn-und-Taxis-Str. 14, 
90411 Nuremberg 
Germany

[email protected]

+49 911 93775-0

  • Contact us
©2026 Paessler GmbHTerms & ConditionsPrivacy PolicyImprintReport VulnerabilityDownload & InstallSitemap
Paessler PRTG Paessler PRTG Paessler PRTG