• Company
    • About Us
    • Case Studies
    • Press Center
    • Careers
    • Blog
    • Contact us
  • Contact us
  • Login
 
  • English
    • Deutsch
    • Español
    • Français
    • Italiano
    • Português
Paessler
                    - The Monitoring Experts
  • Products
    • Paessler PRTG
      Paessler PRTGMonitor your whole IT infrastructure
      • PRTG Network Monitor
      • PRTG Enterprise Monitor
      • PRTG Hosted Monitor
      • PRTG UVexplorer
      • PRTG extensionsExtensions for Paessler PRTGExtend your monitoring to a new level
    • Icon Features
      FeaturesExplore all monitoring features
      • Maps & dashboards
      • Alerts & notifications
      • Multiple user interfaces
      • Distributed monitoring
      • Customizable reporting
  • Solutions
    • By TeamFor your organization size
      • Small Business IT
      • Mid-Market IT
      • Enterprise IT
      • MSP Network Monitoring
    • Industries
      By IndustryFor your business sector
      • Industrial
      • Healthcare
      • Government
      • Education
      • Data Center
      • Finance
    • IT Topics
      By Use CaseFor every technical scenario
      • Network Monitoring
      • Server Monitoring
      • OT Monitoring
      • Distributed Monitoring
      • Network Topology Mapping
      • SNMP Monitoring
      • Bandwidth Monitoring
  • Pricing
  • Resources
    • Getting Started
      Getting StartedModules for self-paced learning
    • How-to Guides
      How-to GuidesGet the most out of PRTG
    • Videos & Webinars
      Videos & WebinarsLearn from Paessler experts
    • IT  Knowledge
      IT KnowledgeExpand your IT knowledge
    • PRTG Manual
      PRTG ManualFull documentation
    • Knowledge Base
      Knowledge BaseShare community knowledge
    • PRTG Sensor Hub
      PRTG Sensor HubGet sensors, scripts & templates
    • Trainings
      PRTG TrainingLearn how to work with PRTG
  • Partners
    • Icon Handshake
      Become a PartnerFor resellers and channel partners
    • Icon MSP
      Become an MSPDeliver monitoring as a managed service
    • icon partner
      Partner PortalLog in to your partner account
    • Deal Registration
      Deal RegistrationRegister your sales opportunities
    • icon search
      Find a PartnerFind partners selling Paessler products
    • icon technology
      Technology AlliancesSee Paessler technology partnerships
    • Partner HubTools for Your Success
  • Company
    • About Us
    • Case Studies
    • Press Center
    • Careers
    • Blog
    • Contact us
  • Contact us
  • Login
  • English
    • Deutsch
    • Español
    • Français
    • Italiano
    • Português
  • Get a quote
  • Free trial
  1. Home>
  2. Company>
  3. Case Studies>
  4. windCORES

Data centers inside wind turbines: how windCORES uses PRTG to monitor the world's greenest infrastructure

Challenge: Decentralized data centers in wind turbines require centralized monitoring for availability

download PDF
Logo Company windCORES

COMPANY
windCORES

INDUSTRY
Energy & Utilities and IT & Telecommunication

COMPANY SIZE
SMB

COUNTRY
Germany

SCALE
Wind turbine data centers, cloud & colocation

Icon Data Center

Infrastructure, power, cooling, access control, and network monitored at every turbine data center

Icon Connection

Inter-site connections verified continuously to maintain redundancy across the distributed fleet

Icon Time

Customer-facing dashboard delivers real-time service visibility for cloud and colocation tenants

The problem

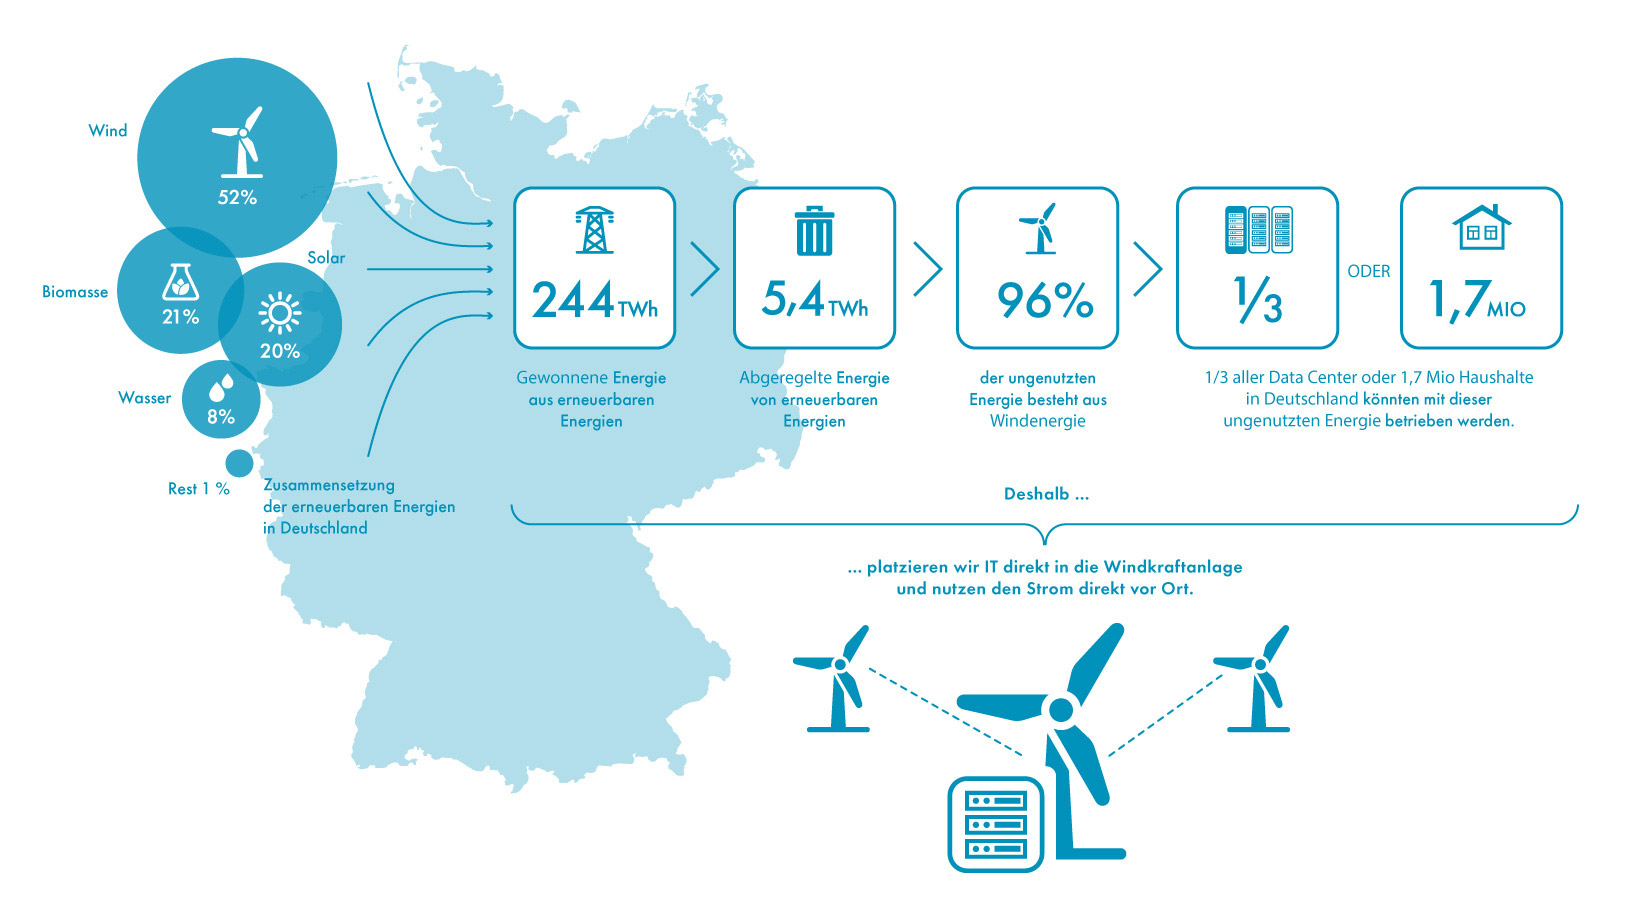
windCORES builds data centers inside wind turbines. It is a German invention and the first of its kind in the world. The WestfalenWIND Group, which operates around 180 wind turbines across Germany, identified an untapped opportunity: turbines already have the space, the power connections, and the network infrastructure in place. The processor goes directly inside the generator.

The challenge isn't building the data center. It's monitoring it. Each turbine houses an independent data center. Customers can rent cloud services or colocation space from individual turbines. Ensuring high availability and security across a geographically distributed fleet requires a centralized monitoring solution.

Without one, a fault at any turbine site would be difficult to detect and slow to resolve.

What changed with PRTG

PRTG monitors both the infrastructure of each windCORES data center and the cloud services customers run directly inside them. Every turbine site is fully covered: server rack PDUs, air-conditioning units, access control systems, cameras, inter-site connections, and network redundancy components.

The connections between individual data centers are monitored continuously to verify that redundancy remains intact across the fleet. A customer-facing dashboard delivers real-time service visibility for cloud and colocation tenants in their respective turbines.

Because windCORES runs a clean, purpose-built infrastructure, PRTG is positioned to support future expansions. Power consumption data from individual servers and racks could feed directly into billing workflows. The 5G antennas mounted on turbines are a strong candidate for integration, eventually bringing the full operational picture of each turbine into one platform.

windCORES' data centers in action

Monitoring is vital to proactively preventing errors and ensuring availability.

Daniel Peitz, Technical Sales
windCORES
PRTG Logo

PRTG gives operators of distributed green infrastructure the centralized visibility they need to guarantee availability and security across every remote site.

free TRIAL
case study windcores data center turbine
case study windcores infographic energy

Discover more monitoring insights and stories

Solution illustration

Solutions for all your monitoring needs

  • Data Center Monitoring
  • Network Mapping
  • Bandwidth Monitoring
Content illustration

Powerful stories from the monitoring world

  • Customer success stories - Paessler
  • Customer success story Bosch Energy and Building Solutions
  • Customer success story: Riverford & PRTG
Support illustration

Resources to master your monitoring challenges

  • How can I speed up PRTG—especially for large installations?
  • I run PRTG on VMware. How can I obtain best performance?
  • How can I use the PRTG Application Programming Interface (API)?
Explore All Case Studies

Products

  • Paessler PRTG
    Paessler PRTGMonitor your whole IT infrastructure
    • PRTG Network Monitor
    • PRTG Enterprise Monitor
    • PRTG Hosted Monitor
    • PRTG UVexplorer
    • PRTG extensions
      Extensions for Paessler PRTGExtend your monitoring to a new level
  • Icon Features
    FeaturesExplore all monitoring features

Monitoring with PRTG

  • Network monitoring
  • Bandwidth monitoring
  • SNMP monitoring
  • Network mapping
  • Wi-Fi monitoring
  • Server monitoring
  • Network traffic analyzer
  • NetFlow monitoring
  • Syslog server

Useful Links

  • PRTG Manual
  • Knowledge Base
  • Customer Success Stories
  • About Paessler
  • Subscribe to newsletter
  • PRTG Support
  • PRTG Consulting
  • PRTG Feedback & Roadmap

Contact

Paessler GmbH
Thurn-und-Taxis-Str. 14, 
90411 Nuremberg 
Germany

[email protected]

+49 911 93775-0

  • Contact us
©2026 Paessler GmbHTerms & ConditionsPrivacy PolicyImprintReport VulnerabilityDownload & InstallSitemap
Pricing Pricing Pricing