• Company
    • About Us
    • Case Studies
    • Press Center
    • Careers
    • Blog
    • Contact us
  • Contact us
  • Login
 
  • English
    • Deutsch
    • Español
    • Français
    • Italiano
    • Português
Paessler
                    - The Monitoring Experts
  • Products
    • Paessler PRTG
      Paessler PRTGMonitor your whole IT infrastructure
      • PRTG Network Monitor
      • PRTG Enterprise Monitor
      • PRTG Hosted Monitor
      • PRTG UVexplorer
      • PRTG extensionsExtensions for Paessler PRTGExtend your monitoring to a new level
    • Icon Features
      FeaturesExplore all monitoring features
      • Maps & dashboards
      • Alerts & notifications
      • Multiple user interfaces
      • Distributed monitoring
      • Customizable reporting
  • Solutions
    • Industries
      IndustriesMonitor various industry sectors
      • Industrial
      • Healthcare
      • Data Center
      • Education
      • Finance
      • Government
    • IT Topics
      IT TopicsMonitor all areas of IT
      • Network Monitoring
      • Bandwidth Monitoring
      • SNMP Monitor
      • Network Mapping
      • WiFi Monitoring
      • Server Monitoring
  • Pricing
  • Resources
    • Getting Started
      Getting StartedModules for self-paced learning
    • How-to Guides
      How-to GuidesGet the most out of PRTG
    • Videos & Webinars
      Videos & WebinarsLearn from Paessler experts
    • IT  Knowledge
      IT KnowledgeExpand your IT knowledge
    • PRTG Manual
      PRTG ManualFull documentation
    • Knowledge Base
      Knowledge BaseShare community knowledge
    • PRTG Sensor Hub
      PRTG Sensor HubGet sensors, scripts & templates
    • Trainings
      PRTG TrainingLearn how to work with PRTG
  • Partners
    • Icon Handshake
      Become a PartnerFor resellers and channel partners
    • Icon MSP
      Become an MSPDeliver monitoring as a managed service
    • icon partner
      Partner PortalLog in to your partner account
    • Deal Registration
      Deal RegistrationRegister your sales opportunities
    • icon search
      Find a PartnerFind partners selling Paessler products
    • icon technology
      Technology AlliancesSee Paessler technology partnerships
    • Partner HubTools for Your Success
  • Company
    • About Us
    • Case Studies
    • Press Center
    • Careers
    • Blog
    • Contact us
  • Contact us
  • Login
  • English
    • Deutsch
    • Español
    • Français
    • Italiano
    • Português
  • Get a quote
  • Free trial

Proactive Downtime Monitoring

PRTG alerts you the moment a device, service, or endpoint goes down. Not when a user does.

Free download
PRODUCT OVERVIEW

How Do You Get Notified About Downtime Before It Affects Your Users?  

Paessler PRTG monitors devices, services, ports, certificates, and remote sites using continuous polling across multiple protocols. It detects outages via Ping/ICMP, TCP port checks, HTTP/HTTPS, SNMP, WMI, DNS, and SMTP. It sends notifications the moment a sensor switches to "Down." All data flows into a central dashboard. No scripting required. Works across mixed environments out of the box.  

Supported protocols and technologies: Ping/ICMP · TCP · HTTP/HTTPS · SMTP · DNS · SSL/TLS · SNMP · WMI · NetFlow · jFlow · sFlow

Supported environments: Windows servers · Linux systems · Routers · Switches · Firewalls · Virtual environments · Cloud services · Remote sites via Remote Probes

Download PRTG Trial

What you will find on this page

  • Stay Ahead of Downtime
  • How PRTG Monitors Downtime
  • Downtime Monitoring: With PRTG vs. Without
  • FAQs

PRTG is compatible with all major vendors, products, and systems

compatible with all major vendors, products, and systems

Stay Ahead of Downtime Across Every Layer of Your Infrastructure

Know About Outages Before Your Users Do

Finding out about downtime from a user call isn't a monitoring strategy. PRTG polls your devices and services at configurable intervals and sends near real-time alerts when during scanning cycle a sensor switches to "Down." You choose the notification channel and define who gets notified for which device group. That means the right person knows before the first support ticket opens, and your team can start working the problem without waiting for someone to escalate it.

  • Near real-time alerts via email, SMS, Slack, push, and webhooks, triggered automatically on sensor status change
  • Configurable scan intervals so critical systems are polled more frequently than non-critical ones
  • Alert escalation routing per device group and team, so notifications reach the right people automatically
  • Automated uptime checks via Ping, HTTP, Port, and service sensors with no manual intervention required
  • All device and service status visible in one central dashboard

Keep Alert Noise Low During Cascade Failures

When a core switch fails, everything behind it goes unreachable. Without dependency configuration, that triggers a separate alert for every downstream device, most of which aren't actually down. PRTG's dependency system pauses child sensors when a defined parent sensor fails. You get one alert, for the actual failure point, and your team can focus on fixing the real issue instead of triaging noise.
  • Define parent-child sensor dependencies per sensor, group, or device
  • Child sensors pause automatically when the master sensor fails, eliminating false positives from cascading unreachability
  • Downtime is recorded only against the device that actually failed, not against downstream devices
  • All dependencies are viewable and manageable in PRTG's dedicated Dependencies overview
  • Test your dependency configuration with PRTG's built-in "Simulate Error Status" function before a real incident occurs
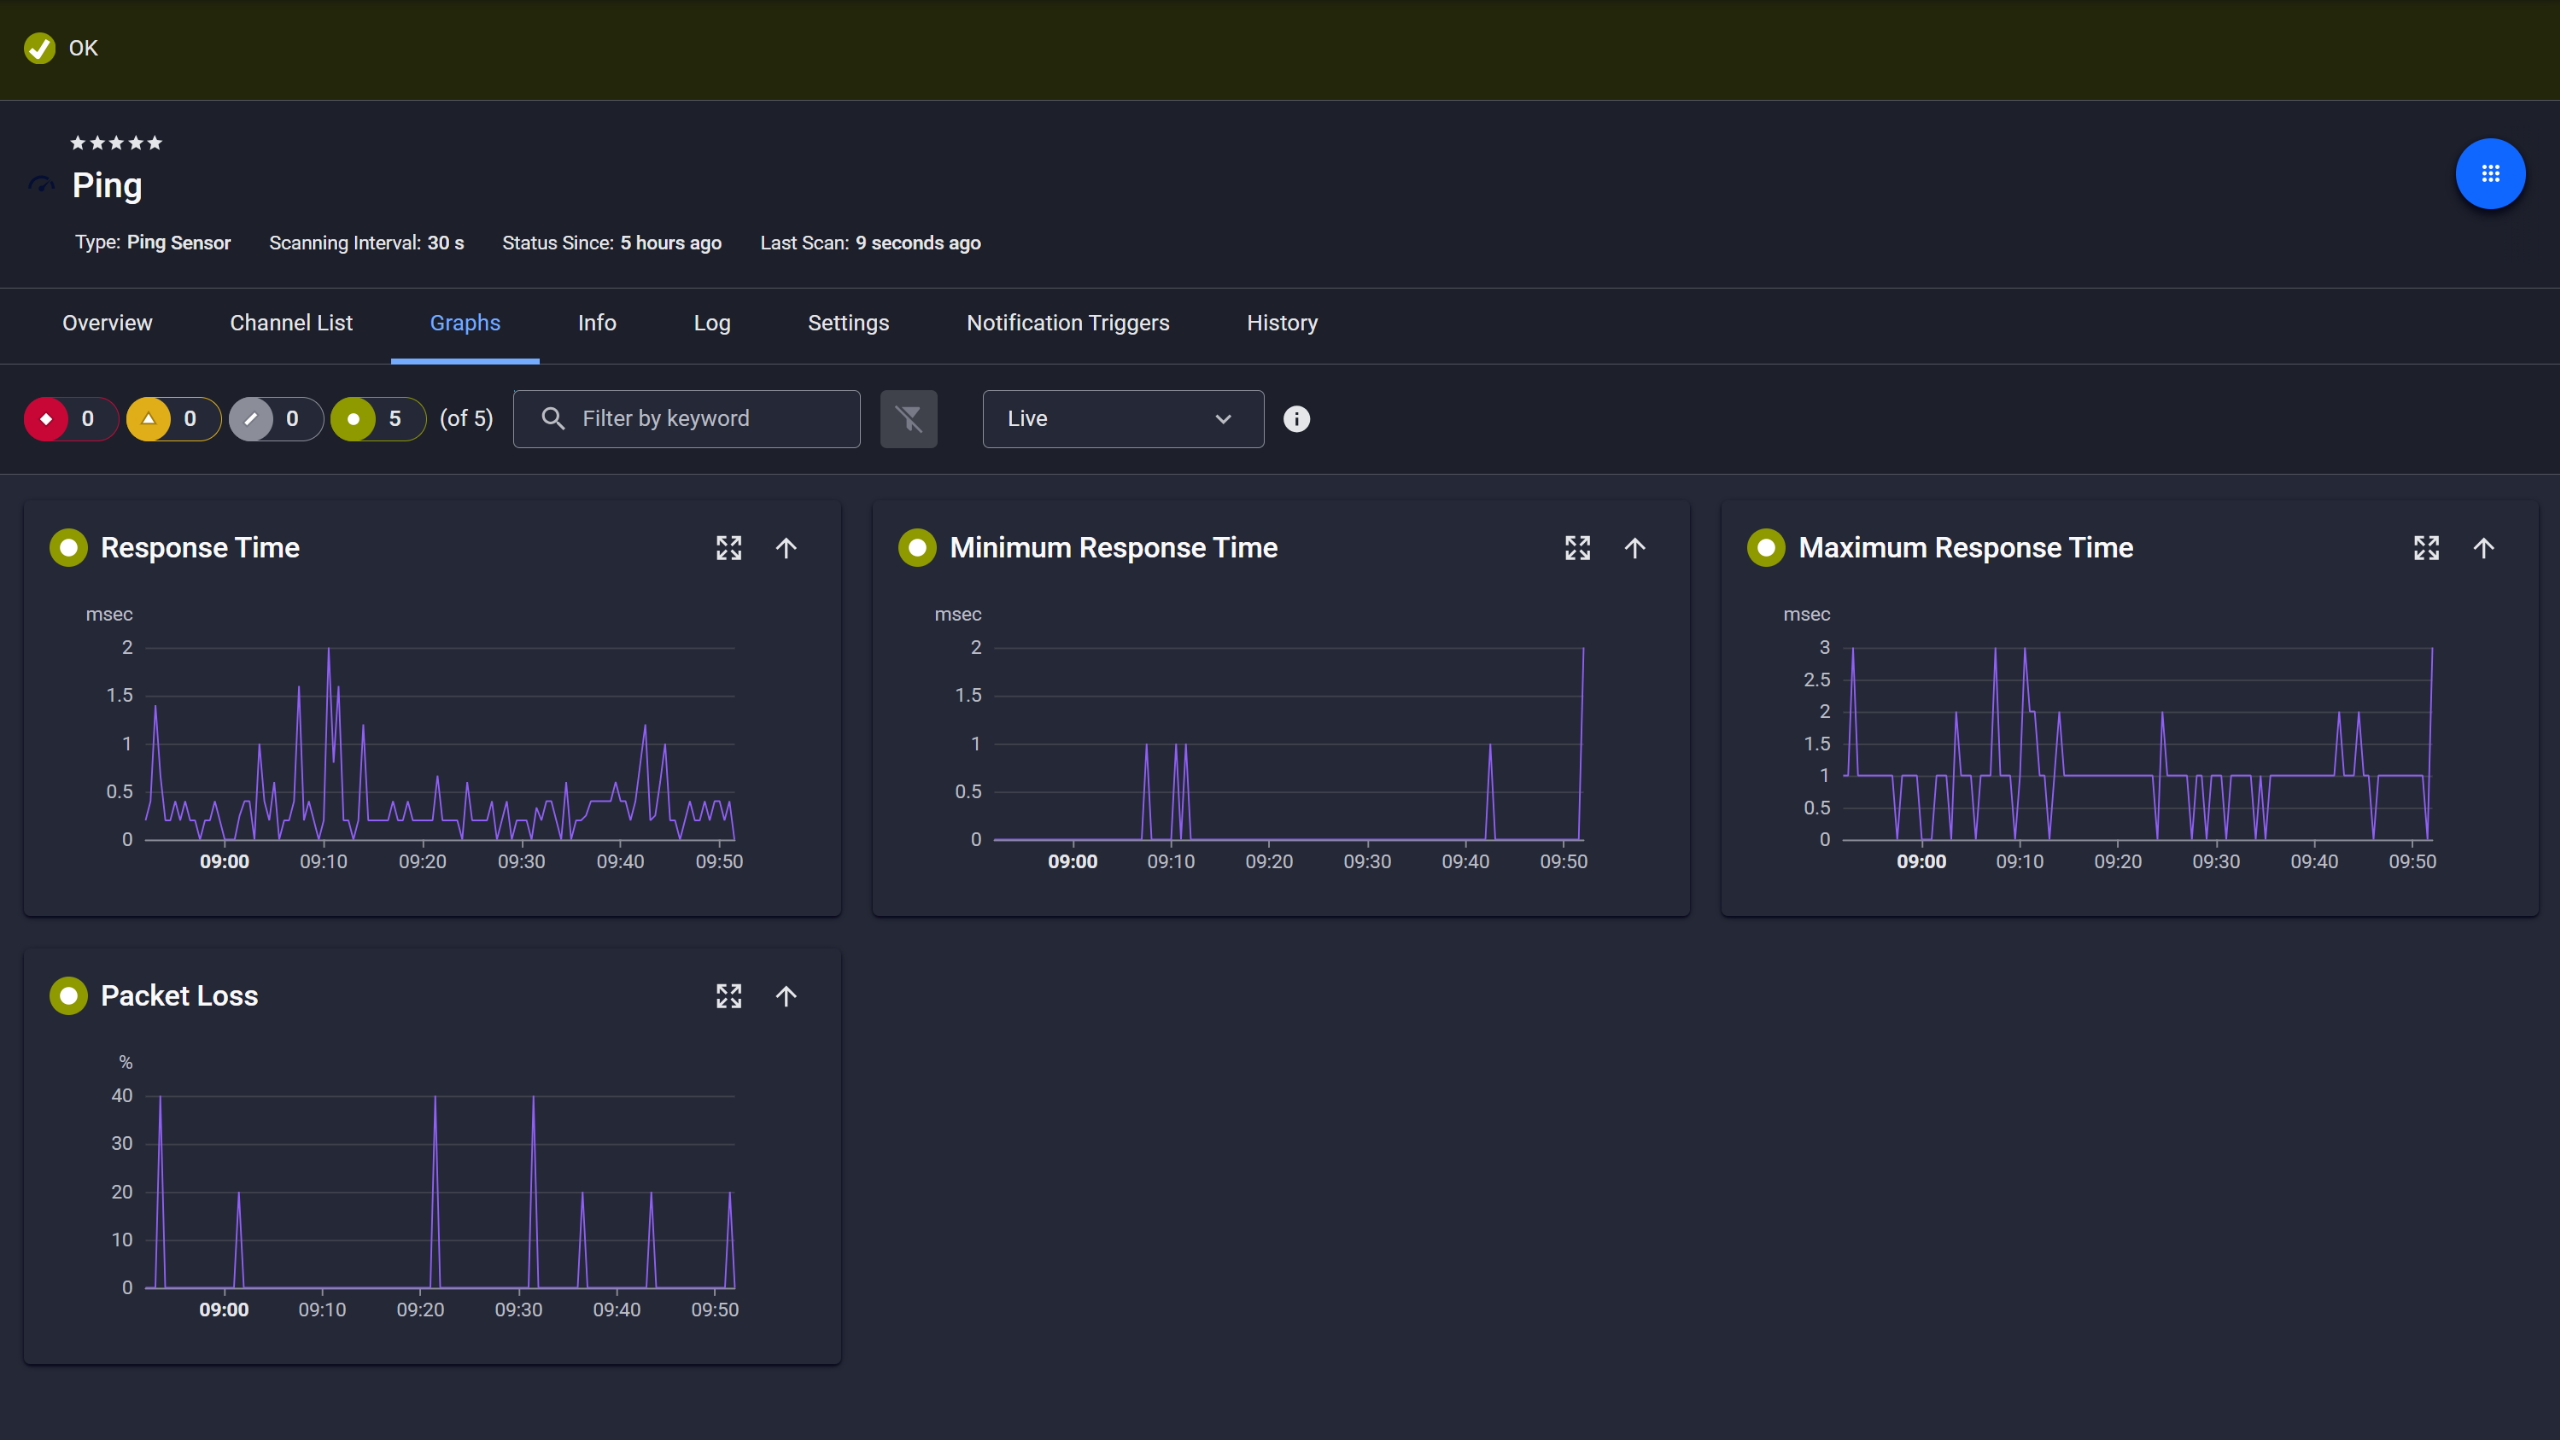
PRTG Ping sensor graphs showing response time, min, max, and packet loss over time

Ping response and packet loss

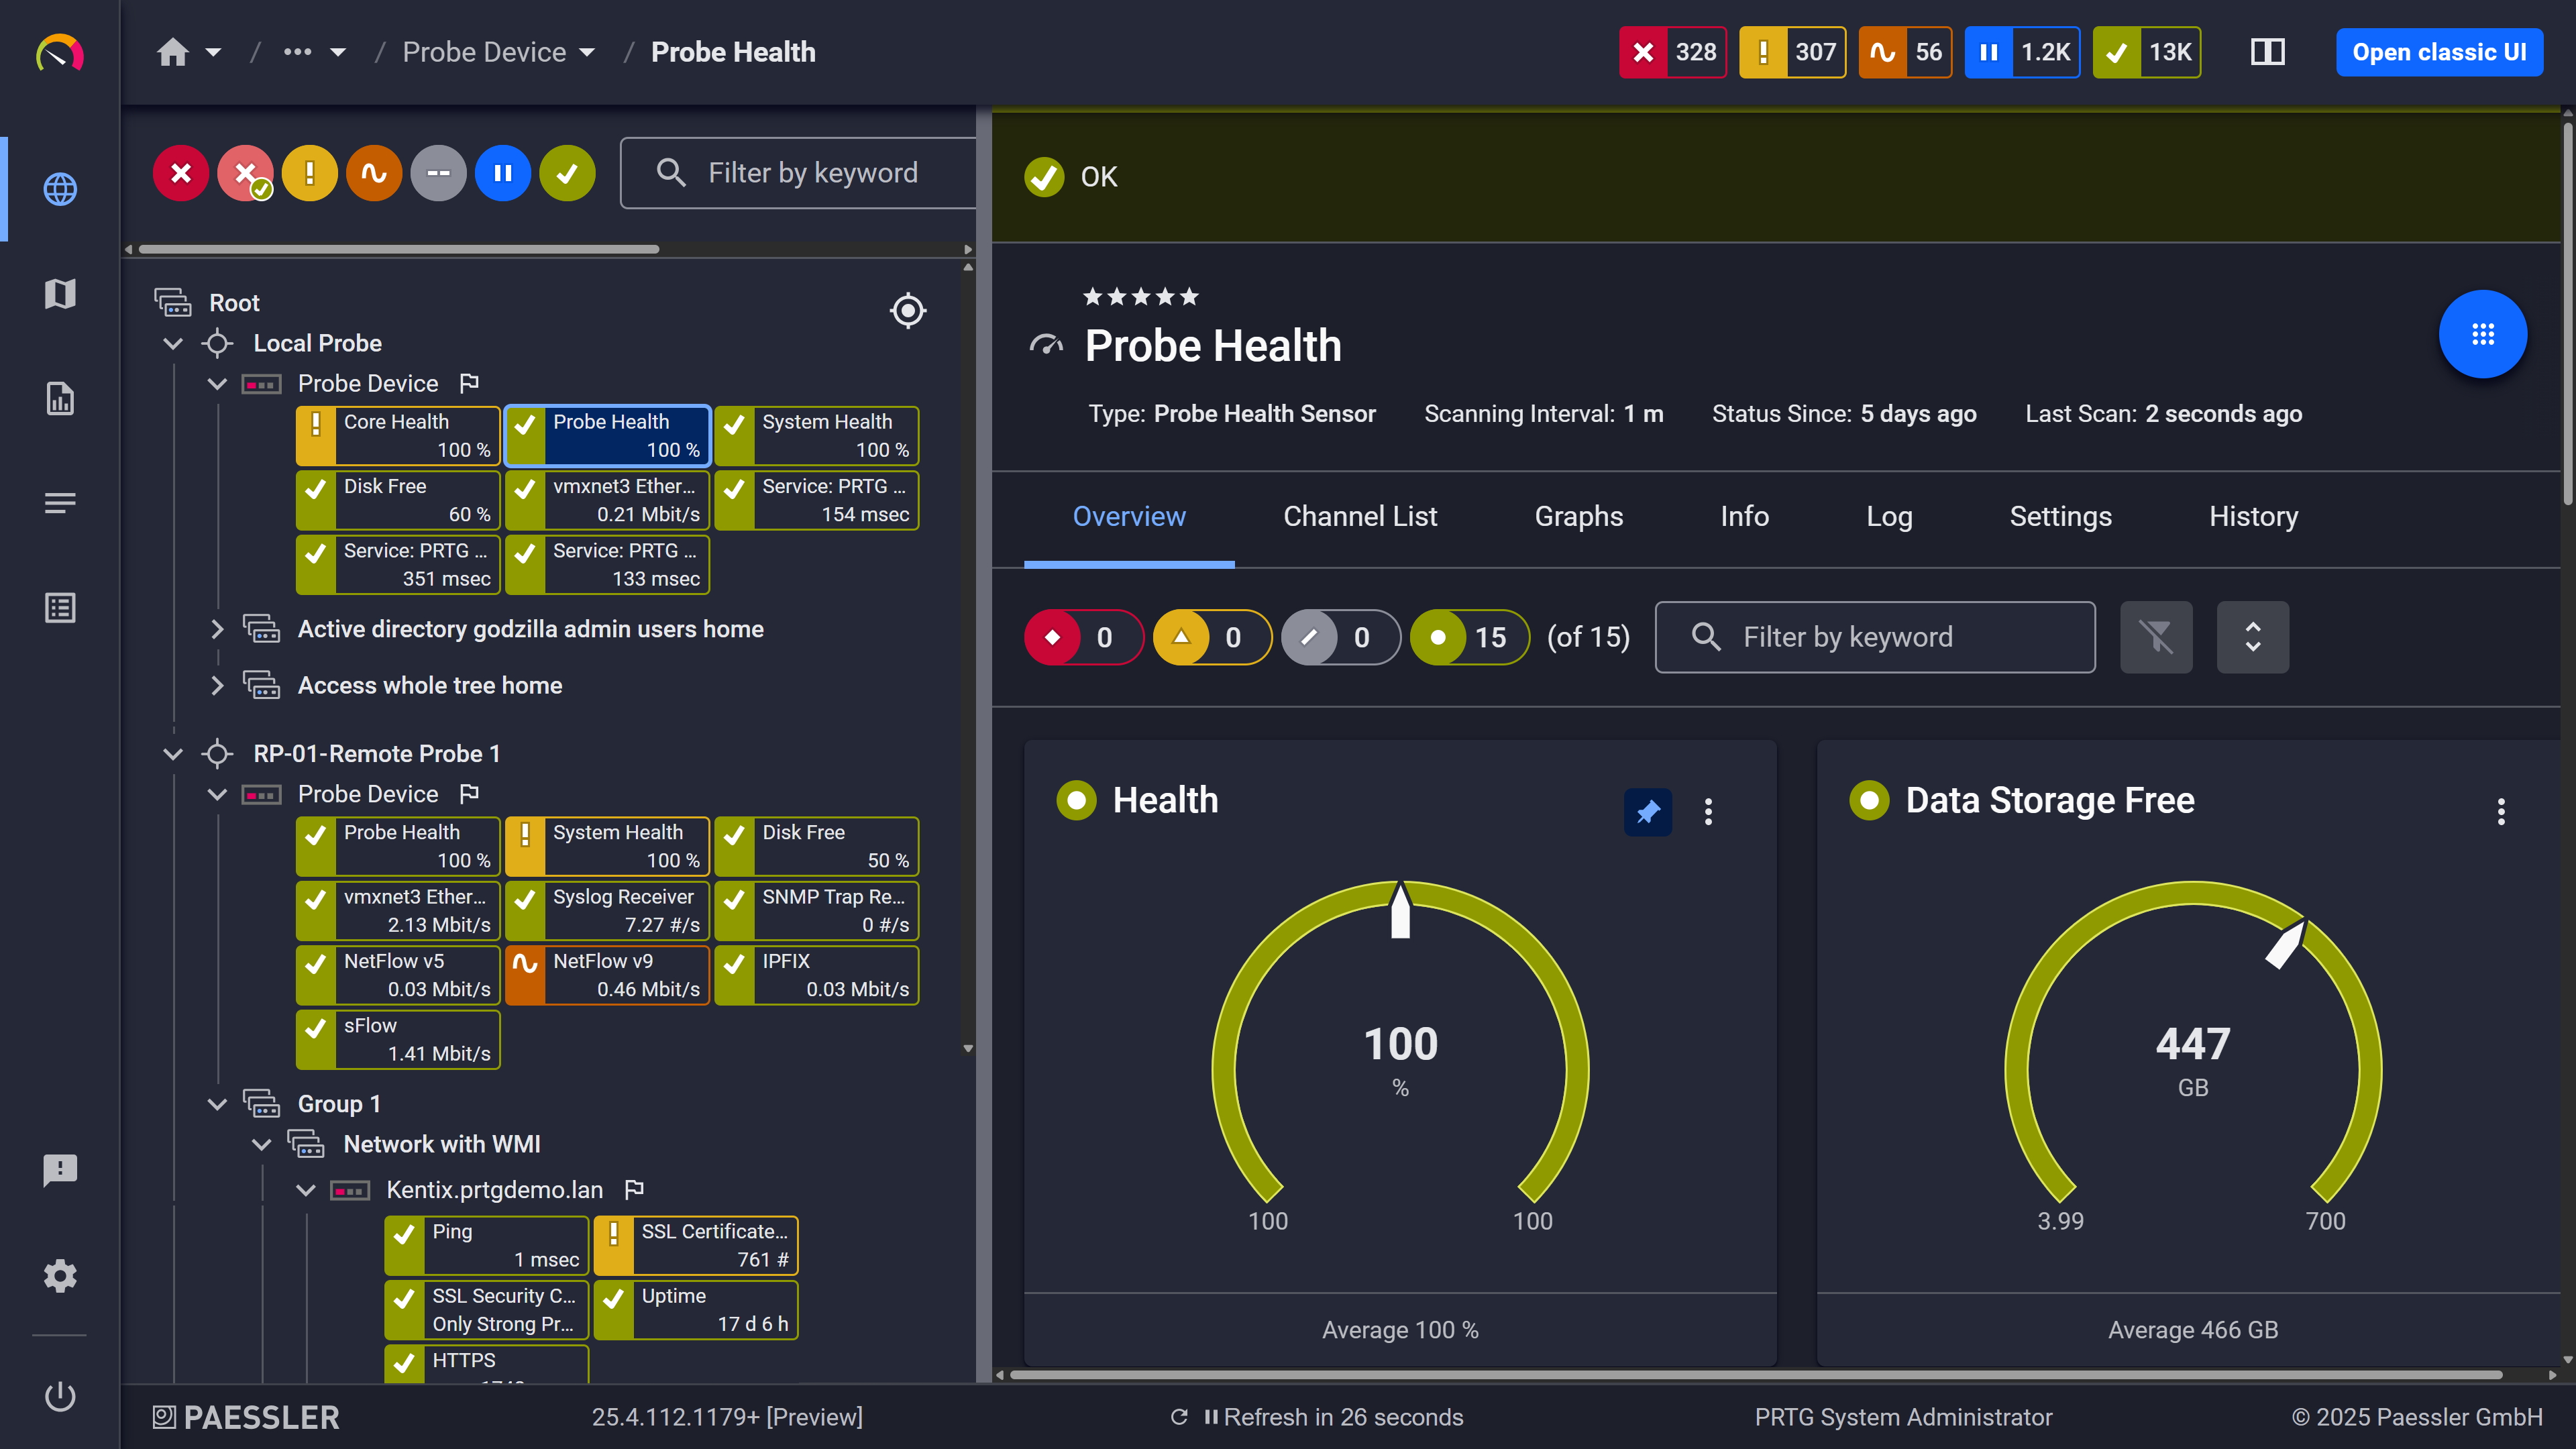
PRTG web interface showing Probe Health sensor with health and storage gauge widgets

Probe health at a glance

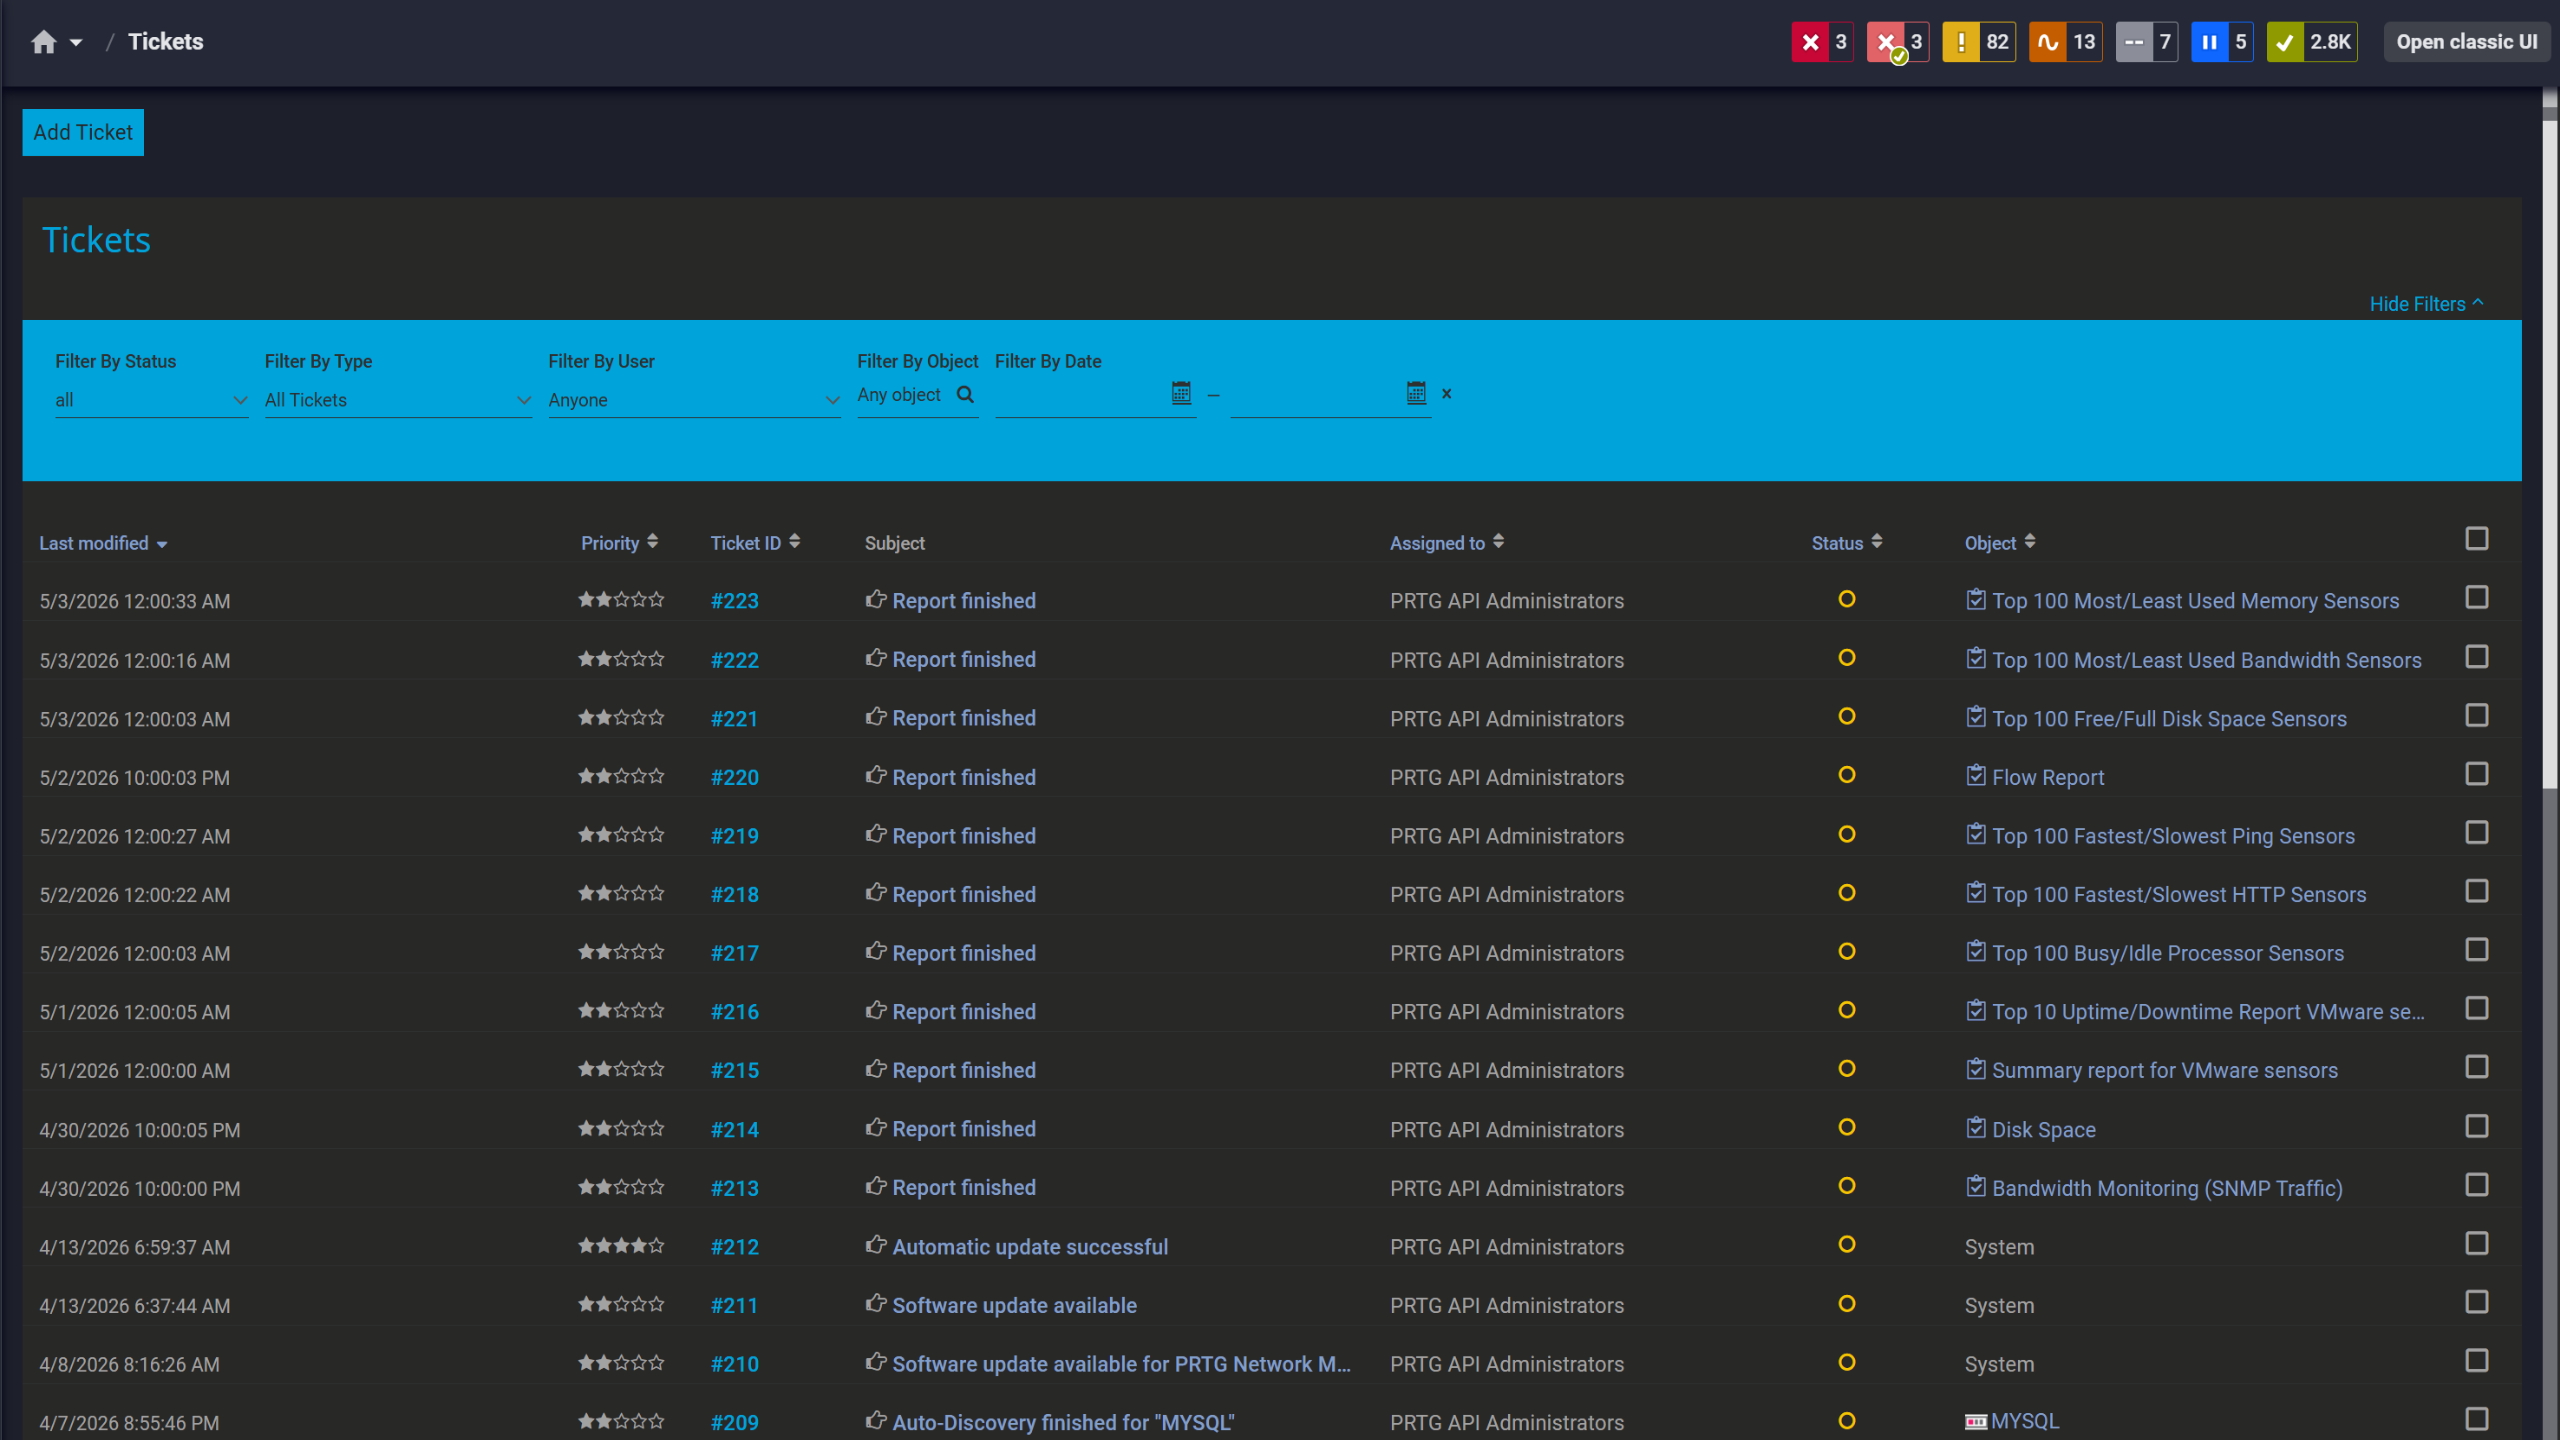
PRTG tickets list showing system notifications, report completions, and update alerts

Tickets keep your team aligned

See Why IT Professionals Trust PRTG

Start monitoring your infrastructure in minutes. No professional services, no complex configuration, no risk.

Free download
PRODUCT OVERVIEW

Monitor What Goes Silent Before It Goes Down

SSL certificates, TCP ports, and Windows services are exactly the kind of infrastructure layer where early visibility pays off. PRTG monitors all of these continuously with dedicated sensors, so you're alerted before the silent failure turns into a visible outage. That shifts the conversation from "why did this break?" to "we caught it before it did."

  • SSL certificate monitoring with validity and expiry tracking; for example: configurable warning threshold at 90 days and error threshold at 30 days
  • TCP port checks that alert when a service port closes or stops accepting connections
  • HTTP/HTTPS response monitoring that detects 500 errors and unexpected content, not just host reachability
  • WMI-based Windows service state monitoring, with stopped services flagged at the next polling cycle
  • Website availability and response time tracking for both internal and external endpoints
PRTG reports list showing scheduled monitoring reports with run times and sensor counts

Scheduled reports, always on time

PRTG web interface showing live performance graphs for a Probe Health sensor

Live graphs, real-time performance data
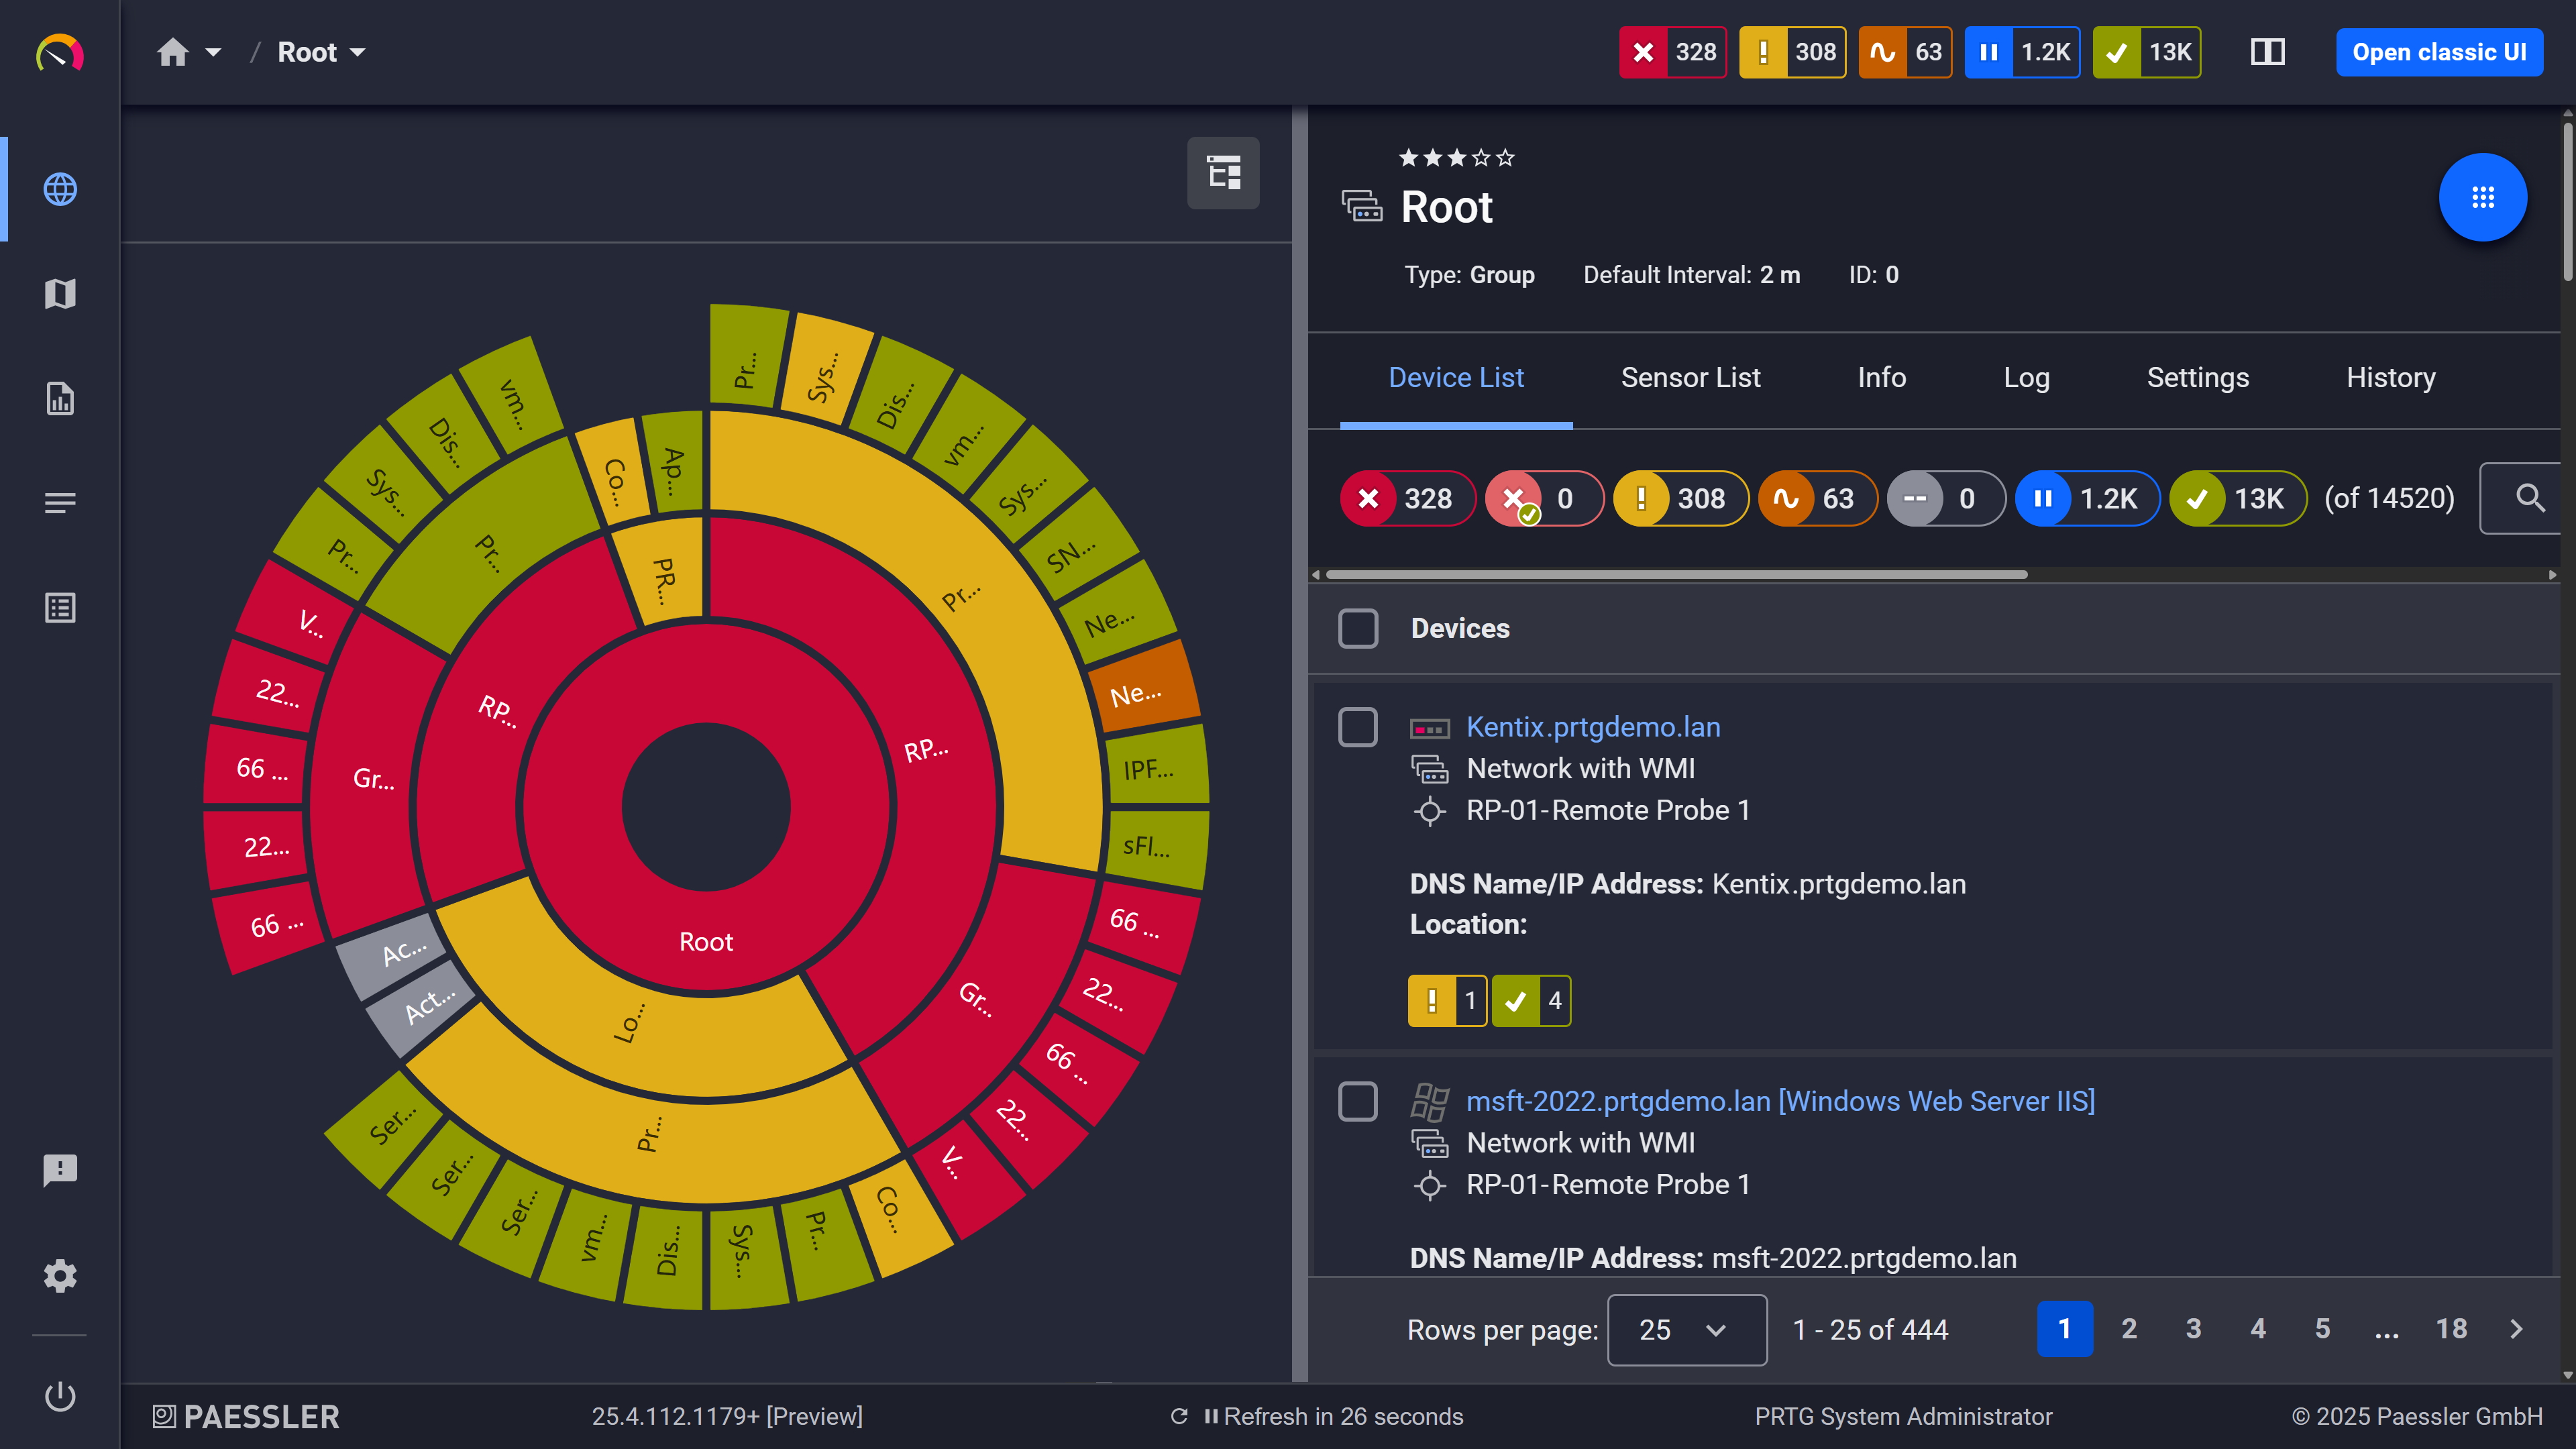
PRTG sunburst chart visualizing the full network hierarchy with color-coded sensor status

Your entire network, visualized instantly

Outage History and SLA Reports

Every "Down" event is logged automatically: start time, duration, and recovery, per device and per service, with no manual entry required. That data is available immediately after an incident for post-mortem reviews, management reports, and compliance documentation. It's also there in six months when someone asks why a service was offline last quarter.  

PRTG SLA Reporter extends this further for teams that need structured SLA reporting. It's included with PRTG Enterprise Monitor and available as a separate add-on. It separates planned maintenance windows from unplanned outages, calculates MTTR and MTBF per device, and generates SLA compliance reports ready for stakeholder review.

  • Per-sensor downtime logging with timestamps, duration, and recovery tracked continuously 
  • Distinguish scheduled maintenance from unplanned outages in your downtime records 
  • PRTG SLA Reporter tracks MTTR, MTBF, and SLA compliance per device (included with PRTG Enterprise Monitor; available separately for other editions) 
  • Export SLA compliance reports for management and stakeholder review 
  • Full downtime history per sensor across the entire monitoring period

How PRTG Monitors Downtime 

PRTG uses several  methods to detect downtime. Each targets a different layer of your infrastructure, from basic network reachability up to application-layer protocol checks.

Ping / ICMP

The Ping and Ping v2 sensors send ICMP echo requests to monitored devices at defined intervals. Response time is tracked alongside availability, so gradual degradation shows up before a full failure occurs. That distinction matters: a device can still respond to ping while its performance is already heading in the wrong direction.  

When a device stops responding the sensor switches to "Down" immediately. This is the baseline availability check for every network device in PRTG. The Ping v2 sensor is a newer engine implementation of the same core check, not a different method.

SNMP Status Monitoring

For routers, switches, firewalls, and servers PRTG queries SNMP OIDs to check interface status, hardware component health, and error counters. A ping check alone misses quite a bit here: a specific interface can go down while the device stays reachable, or a hardware component reports a fault without affecting basic connectivity. SNMP catches both.  

Vendor-specific sensors for Dell PowerEdge, HPE ProLiant, Cisco UCS, and others extend this to granular hardware health monitoring where the device supports it.

DNS Resolution Monitoring

The DNS v2 sensor queries a DNS server for a specified domain and compares the response against an expected result. If resolution fails or returns an unexpected record, the sensor triggers a Down or Warning status.  

Worth noting this catches failures a ping check never would. Your infrastructure can be running fine and users still can't reach services because DNS is broken. That gap needs its own check.

Application-Layer Protocol Checks

PRTG's SMTP sensor connects to a mail server and verifies it actively accepts connections and responds correctly. This runs independently of whether the host responds to ping, because a server can be reachable at the network layer and completely broken at the application layer. Protocol-specific sensors exist precisely to close that gap.

free downLoad

Downtime Monitoring: With PRTG vs. Without

Capability

Without PRTG

Without PRTG

With PRTG

With PRTG

Outage detection

Without PRTG
not included

Users report it

With PRTG
included

Detected automatically at the next polling cycle

Notification routing

Without PRTG
not included

Manual, after discovery

With PRTG
included

Configurable per sensor: email, SMS, Slack, or webhook

Cascade alert handling

Without PRTG
not included

Every downstream device alerts

With PRTG
included

Dependency system suppresses downstream false positives

Downtime records

Without PRTG
not included

Manual or nonexistent

With PRTG
included

Auto-logged per sensor with timestamps and duration

Remote site visibility

Without PRTG
not included

On-site staff or VPN required

With PRTG
included

Remote Probes scan locally and report centrally

Scheduled maintenance

Without PRTG
not included

Counted as downtime

With PRTG
included

Marked separately and excluded from SLA calculations (via PRTG SLA Reporter, available with PRTG Enterprise Monitor)

SSL/certificate expiry

Without PRTG
not included

Found when it expires

With PRTG
included

Tracked continuously with configurable warning and error thresholds

free downLoad

”Adopting PRTG has been like going from being in the dark to being in the light. Before, we had limited visibility into what was happening in the infrastructure and in the network. Now, however, thanks to the comprehensive dashboard and real-time notifications, we receive constant updates on the status of facilities and services, and our way of working has gone from passive to proactive.”

Luca Meneghesso, Senior IT infrastructure and Security Specialist
Banca Profilo

”GESAC increasingly focuses on innovation to improve the quality of services offered and the experience of passengers handled every day by Naples Airport. Thanks to PRTG, we finally have unified, automatic, and continuous monitoring of the airport network and can guarantee quick and timely interventions.”

Domenico Ciervo, GESAC ICT Manager
Naples International Airport

”As an international company, PRTG is ideal for us. If something went down half way across the world, we wouldn’t be woken up – we can rely on PRTG to identify the problem and alert us before it occurs – enabling the right person, in the right time zone to resolve the problem. At the end of the day, if we’re to provide an internal network experience for our employees that meets expectations, we need a tool like PRTG to be successful.”

Barry Kelly, Systems Engineer
Skyscanner

Paessler PRTG Network Monitor licenses & pricing

Choose the PRTG Network Monitor subscription that's best for you.

License NameLicense descriptionPriceLicense DetailsGet startedPricing Details
PRTG 500$200per month paid annuallyBuy nowBuy now

Enough to monitor multiple aspects of 50 devices

PRTG 1000$358per month paid annuallyBuy nowBuy now

Enough to monitor multiple aspects of 100 devices

PRTG 2500$742per month paid annuallyBuy nowBuy now

Enough to monitor multiple aspects of 250 devices

PRTG 5000$1,300per month paid annuallyBuy nowBuy now

Enough to monitor multiple aspects of 500 devices

PRTG 10000$1,642per month paid annuallyBuy nowBuy now

Enough to monitor multiple aspects of 1000 devices

Over 100,000 Customers Worldwide Love Paessler  

customer success stories

 Downtime Monitoring with PRTG: Frequently Asked Questions


How quickly does PRTG detect downtime?

Depends on your configured scan interval. Most sensors can poll as frequently as every 10 seconds, and the moment a sensor switches to "Down" notifications go out via email, SMS, Slack, push, or webhook. No fixed delay in the alert pipeline between detection and notification.  

For critical systems shorter scan intervals give you faster detection. No additional configuration complexity required to get there.

What's the difference between downtime monitoring and uptime monitoring?

Practically speaking, the same core practice. Both verify whether a device, service, or endpoint is available.  

The distinction is usually in what you're measuring. Uptime monitoring tracks availability over time and produces uptime percentages. Downtime monitoring focuses on the failure events themselves: when did it go down, how long did it stay down, when did it recover. PRTG does both from the same sensor data. Uptime checks run continuously, outages get detected the moment they occur, and the full history stays accessible per sensor.

Can PRTG monitor website availability and response times?

Yes. HTTP sensors request a URL and evaluate the response code and, optionally, the page content. A 500 error or a missing content element triggers a Down status even when the host itself is reachable at the network level. That distinction matters more than people expect.  

Response time gets tracked as a dedicated channel so you can set thresholds and catch degradation before slow response times turn into timeouts or actual user experience problems. Also covers both internal applications and external website uptime from the same platform.

How does PRTG handle false positives from cascade failures?

Through dependencies. When a parent sensor fails, say the sensor on a core router, PRTG pauses all dependent sensors below it. Downstream devices that are unreachable because of the upstream failure don't generate their own Down alerts. Downtime gets recorded only against the device that actually failed, not every device that lost connectivity as a result.  

Dependencies are defined per sensor, group, or device. And there's a built-in "Simulate Error Status" function to test them before an actual failure makes testing mandatory.

Does PRTG support alerting via Slack, SMS, or webhooks?

Email, SMS, and push come out of the box. Slack and webhook-based notifications go through PRTG's HTTP Action notification method, which sends alerts to any endpoint accepting an HTTP request. That includes Slack incoming webhooks, Microsoft Teams connectors, and custom API endpoints.  

Different notification channels can be assigned per device group or sensor type, so your on-call team doesn't have to receive everything everyone else receives.

Does PRTG monitor DNS, SMTP, and SSL endpoints?

Yes, all three, and each runs independently. The DNS v2 sensor checks server availability and resolution accuracy against an expected result. The SMTP sensor verifies mail server connectivity and application-layer response, not just whether the host is pingable. SSL/TLS certificate validity and expiry are tracked with configurable warning and error thresholds based on days remaining before expiration.  

TCP port availability is monitored separately. Any service running over a defined port gets covered without needing a protocol-specific sensor for it.

Paessler PRTG

Paessler PRTG

Network Monitoring Software – Version 26.1.116.1532 (February 9th, 2026)

Hosting icon

Hosting

Download for Windows and cloud-based version PRTG Hosted Monitor available

Languages icon

Languages

English, German, Spanish, French, Portuguese, Dutch, Russian, Japanese, and Simplified Chinese

test

Monitor everything

Network devices, bandwidth, servers, applications, virtual environments, remote systems, IoT, and more

test

Pricing

Choose the PRTG Network Monitor subscription that's best for you

Discover more monitoring insights and stories

Content illustration

Powerful stories from the monitoring world

  • How to enable SNMP on your operating system
  • Sending Notifications Via Microsoft Teams
  • Understanding MQTT architecture: a deep dive
Support illustration

Resources to master your monitoring challenges

  • The PRTG downtime basics
  • Gap in PRTG Graphs (no outage?)
  • Downtime Inquiry
Solution illustration

Solutions for all your monitoring needs

  • Database Monitoring
  • LAN Monitoring
  • Network Monitoring Tool
PRTG Logo

Start Monitoring with PRTG and see how it can make your network more reliable and your job easier.

Free download
PRODUCT OVERVIEW

Products

  • Paessler PRTG
    Paessler PRTGMonitor your whole IT infrastructure
    • PRTG Network Monitor
    • PRTG Enterprise Monitor
    • PRTG Hosted Monitor
    • PRTG UVexplorer
    • PRTG extensions
      Extensions for Paessler PRTGExtend your monitoring to a new level
  • Icon Features
    FeaturesExplore all monitoring features

Monitoring with PRTG

  • Network monitoring
  • Bandwidth monitoring
  • SNMP monitoring
  • Network mapping
  • Wi-Fi monitoring
  • Server monitoring
  • Network traffic analyzer
  • NetFlow monitoring
  • Syslog server

Useful Links

  • PRTG Manual
  • Knowledge Base
  • Customer Success Stories
  • About Paessler
  • Subscribe to newsletter
  • PRTG Support
  • PRTG Consulting
  • PRTG Feedback & Roadmap

Contact

Paessler GmbH
Thurn-und-Taxis-Str. 14, 
90411 Nuremberg 
Germany

[email protected]

+49 911 93775-0

  • Contact us
©2026 Paessler GmbHTerms & ConditionsPrivacy PolicyImprintReport VulnerabilityDownload & InstallSitemap
Network Monitoring Tool Network Monitoring Tool Network Monitoring Tool