• Company
    • About Us
    • Case Studies
    • Press Center
    • Careers
    • Blog
    • Contact us
  • Contact us
  • Login
 
  • English
    • Deutsch
    • Español
    • Français
    • Italiano
    • Português
Paessler
                    - The Monitoring Experts
  • Products
    • Paessler PRTG
      Paessler PRTGMonitor your whole IT infrastructure
      • PRTG Network Monitor
      • PRTG Enterprise Monitor
      • PRTG Hosted Monitor
      • PRTG UVexplorer
      • PRTG extensionsExtensions for Paessler PRTGExtend your monitoring to a new level
    • Icon Features
      FeaturesExplore all monitoring features
      • Maps & dashboards
      • Alerts & notifications
      • Multiple user interfaces
      • Distributed monitoring
      • Customizable reporting
  • Solutions
    • Industries
      IndustriesMonitor various industry sectors
      • Industrial
      • Healthcare
      • Data Center
      • Education
      • Finance
      • Government
    • IT Topics
      IT TopicsMonitor all areas of IT
      • Network Monitoring
      • Bandwidth Monitoring
      • SNMP Monitor
      • Network Mapping
      • WiFi Monitoring
      • Server Monitoring
  • Pricing
  • Resources
    • Getting Started
      Getting StartedModules for self-paced learning
    • How-to Guides
      How-to GuidesGet the most out of PRTG
    • Videos & Webinars
      Videos & WebinarsLearn from Paessler experts
    • IT  Knowledge
      IT KnowledgeExpand your IT knowledge
    • PRTG Manual
      PRTG ManualFull documentation
    • Knowledge Base
      Knowledge BaseShare community knowledge
    • PRTG Sensor Hub
      PRTG Sensor HubGet sensors, scripts & templates
    • Trainings
      PRTG TrainingLearn how to work with PRTG
  • Partners
    • Icon Handshake
      Become a PartnerFor resellers and channel partners
    • Icon MSP
      Become an MSPDeliver monitoring as a managed service
    • icon partner
      Partner PortalLog in to your partner account
    • Deal Registration
      Deal RegistrationRegister your sales opportunities
    • icon search
      Find a PartnerFind partners selling Paessler products
    • icon technology
      Technology AlliancesSee Paessler technology partnerships
    • Partner HubTools for Your Success
  • Company
    • About Us
    • Case Studies
    • Press Center
    • Careers
    • Blog
    • Contact us
  • Contact us
  • Login
  • English
    • Deutsch
    • Español
    • Français
    • Italiano
    • Português
  • Get a quote
  • Free trial

Automated Software Update Monitoring

Track patch status across your Windows machines and WSUS. No manual checking required.

Free download
PRODUCT OVERVIEW

How do I monitor update status across all my Windows systems without checking each one manually?  

Tracking software update status across a Windows environment means querying each system for its patch state, WSUS sync health, and security product status. Three areas matter: update status per machine, the health of whatever serves your updates, and whether endpoint security tools are still actively running. Security patches and feature updates come through the same pipeline, so when something's missing, you need to see it regardless of type. 

Paessler PRTG retrieves this data using Windows-native methods like PowerShell and WMI, presenting everything centrally in a dashboard. It queries endpoints directly, pulls WSUS server statistics independently of WSUS's own reporting, and reads Windows Security Center product states across your fleet. Supported technologies: Windows 10, Windows 11, Windows Server, WSUS, Windows Security Center / Windows Action Center, workstations, servers, endpoints.

Download PRTG Trial

What you will find on this page

  • What Software Update Monitoring Covers
  • Monitor the Update Status
  • Manual Update Checking vs. Using PRTG
  • FAQs

PRTG is compatible with all major vendors, products, and systems

compatible with all major vendors, products, and systems

What PRTG Covers for Software Update Monitoring

Stay on Top of Every Update Across Your Windows Fleet

Windows updates run quietly. That's by design, and having an independent check on the process keeps you informed about every install across your fleet. A central status view means you see completion and pending states as they happen, giving you the full picture well before a vulnerability scan or a support ticket would. 

PRTG checks update status per machine and tracks missing update counts by severity class. Also tracked: time since last successful update per device, which matters more than raw count when your actual goal is staying on the current version. When any machine falls outside your defined thresholds you get an alert, with full context on what's pending and where.

  • Missing update count by severity class
  • Time since last successful update, per device. Alert threshold configurable per severity level, so critical updates get their own limit separate from optional ones
  • Covers updates sourced from Microsoft directly or via local WSUS
  • Alert on threshold breach, routable via email, SMS, or webhook

Get an independent health check on your WSUS infrastructure

Having an independent view of WSUS health gives you confirmation that the infrastructure is working as expected. Client sync states, update approvals, and error counts are all visible from outside WSUS's own reporting interface. That external perspective keeps you informed about sync status and approval queues continuously, so WSUS health is something you verify proactively. 

PRTG connects to the WSUS server via WMI and queries its statistics independently of WSUS's own reporting interface. That distinction matters: you're not relying on WSUS to tell you WSUS is healthy. If your infrastructure serves a distributed or MSP environment, this kind of external view is particularly useful, since it doesn't depend on the thing you're checking working correctly.

  • Computers not synced in 7 or more days 
  • Unapproved critical updates or security updates; configurable alert when counts exceed thresholds 
  • Computers with update errors vs. computers that are current, visible in one place 
  • Approval queue data and unapproved update counts. In practice, many teams start with the error count and sync state channels when investigating a WSUS issue 
PRTG tickets list showing system notifications, report completions, and update alerts

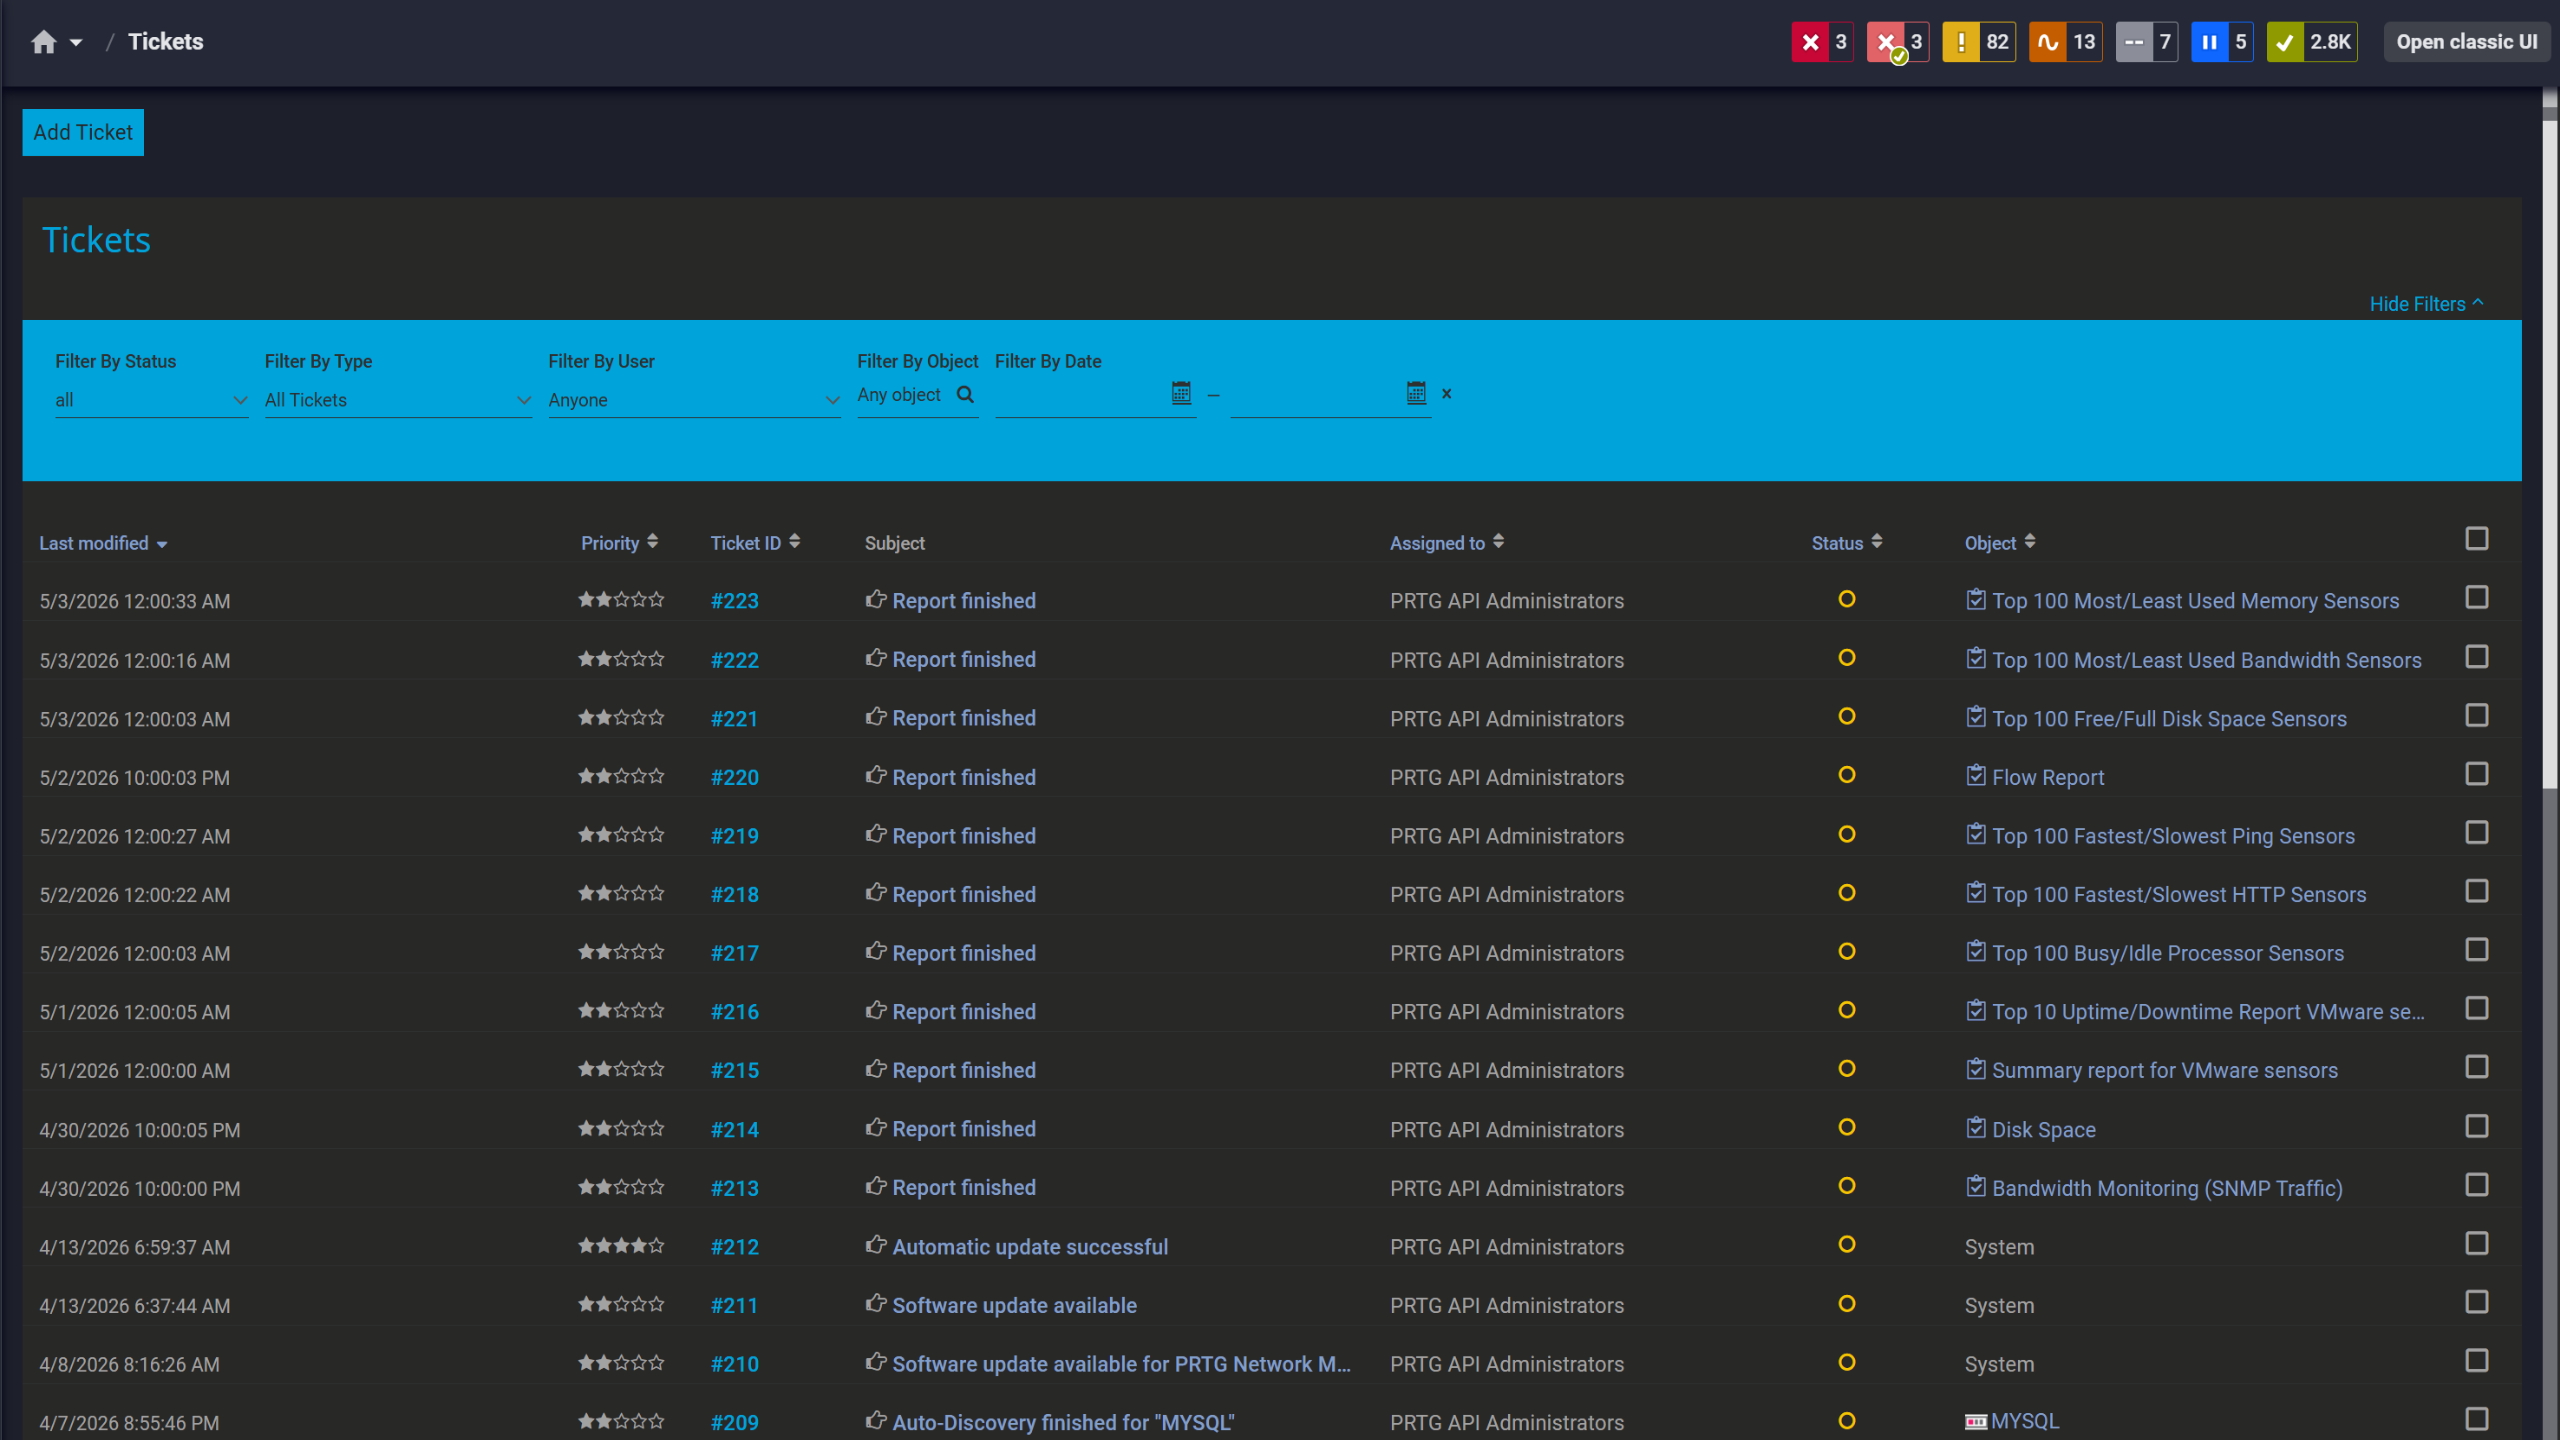
Tickets keep your team aligned

PRTG web interface showing Probe Health sensor with health and storage gauge widgets

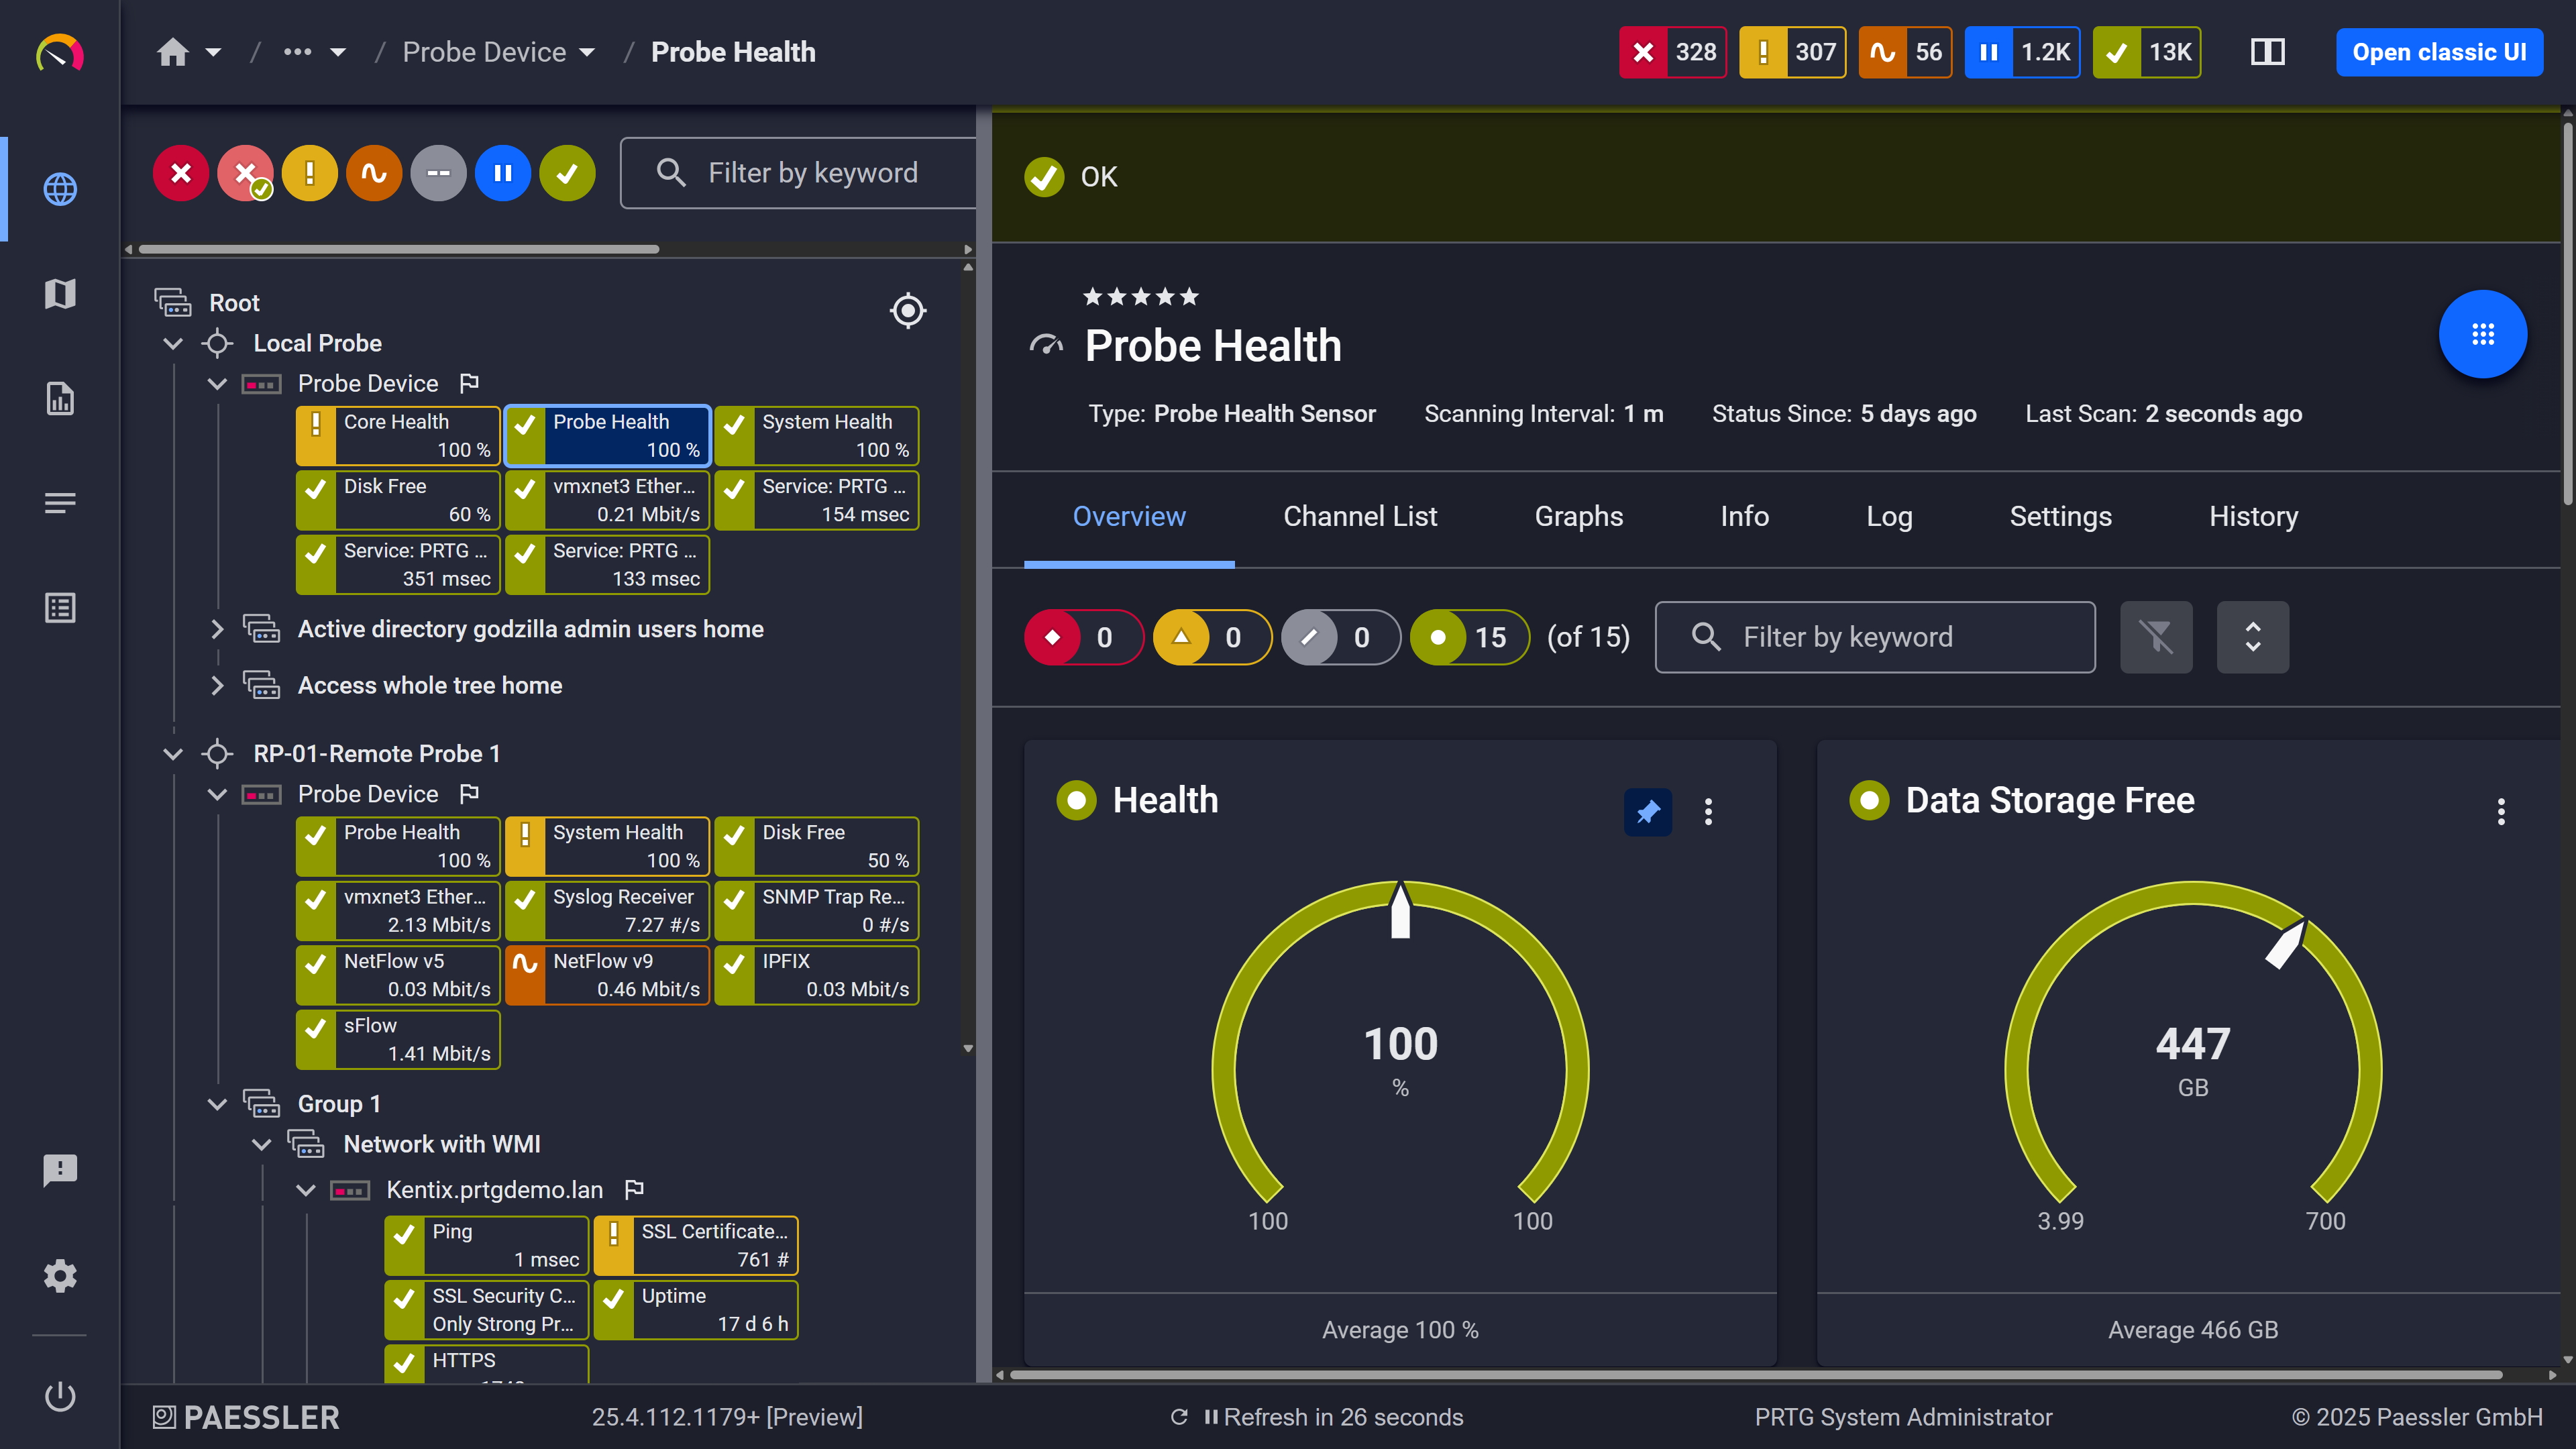
Probe health at a glance

PRTG web interface showing device tree and full device list with sensor status badges

Full device list, instant overview

Keep your entire Windows fleet up-to-date across every device

A mixed Windows fleet covers devices added at different times, running different operating systems, updated through different channels. A central view gives you that status across all of them at once. And a central view is what scales. 

PRTG aggregates update status across workstations and servers into a single dashboard. You define what "behind" looks like: missing update count, severity level, devices not running the latest versions of approved updates. Worth noting that thresholds are configured per sensor, not globally, which is useful when your servers and workstations have different patching process requirements or separate update management policies.

  • Unified update status view across IT environments of any size
  • Per-device patch status at a glance
  • Threshold-based alerting configurable per device group
  • Historical sensor data for trend visibility, useful for spotting devices that repeatedly fall behind on new versions

See Why IT Professionals Trust PRTG

Start monitoring your infrastructure in minutes. No professional services, no complex configuration, no risk.

Free download
PRODUCT OVERVIEW

Know your endpoint security tools are not just deployed, but actually running 

Deployment is the easy part. Knowing your antivirus, firewall, and anti-spyware are still active after an OS update or configuration change is where continuous monitoring adds value. A security product's running state is something worth tracking independently, and having that confirmation across all endpoints gives your team a clear picture. Consistent visibility into active protection status supports your overall security posture. 

PRTG reads from Windows Security Center and reports the status of every registered security product across your Windows endpoints. When a product's status changes in Windows Security Center, including going offline or registering as inactive, PRTG registers it as a sensor state change. The difference between "installed" and "actually running" is tracked, not assumed.

  • Status monitoring for all Windows Security Center-registered products
  • Covers antivirus, firewall, and anti-spyware, including products that report to Windows Action Center
  • Alerts on any status change or product downtime; catches scenarios where a product goes inactive after a Windows update without generating an obvious error
  • Windows client-scoped; applies to managed workstations and endpoints
PRTG reports list showing scheduled monitoring reports with run times and sensor counts

Scheduled reports, always on time

PRTG home screen showing feature highlight cards including mobile interface and API

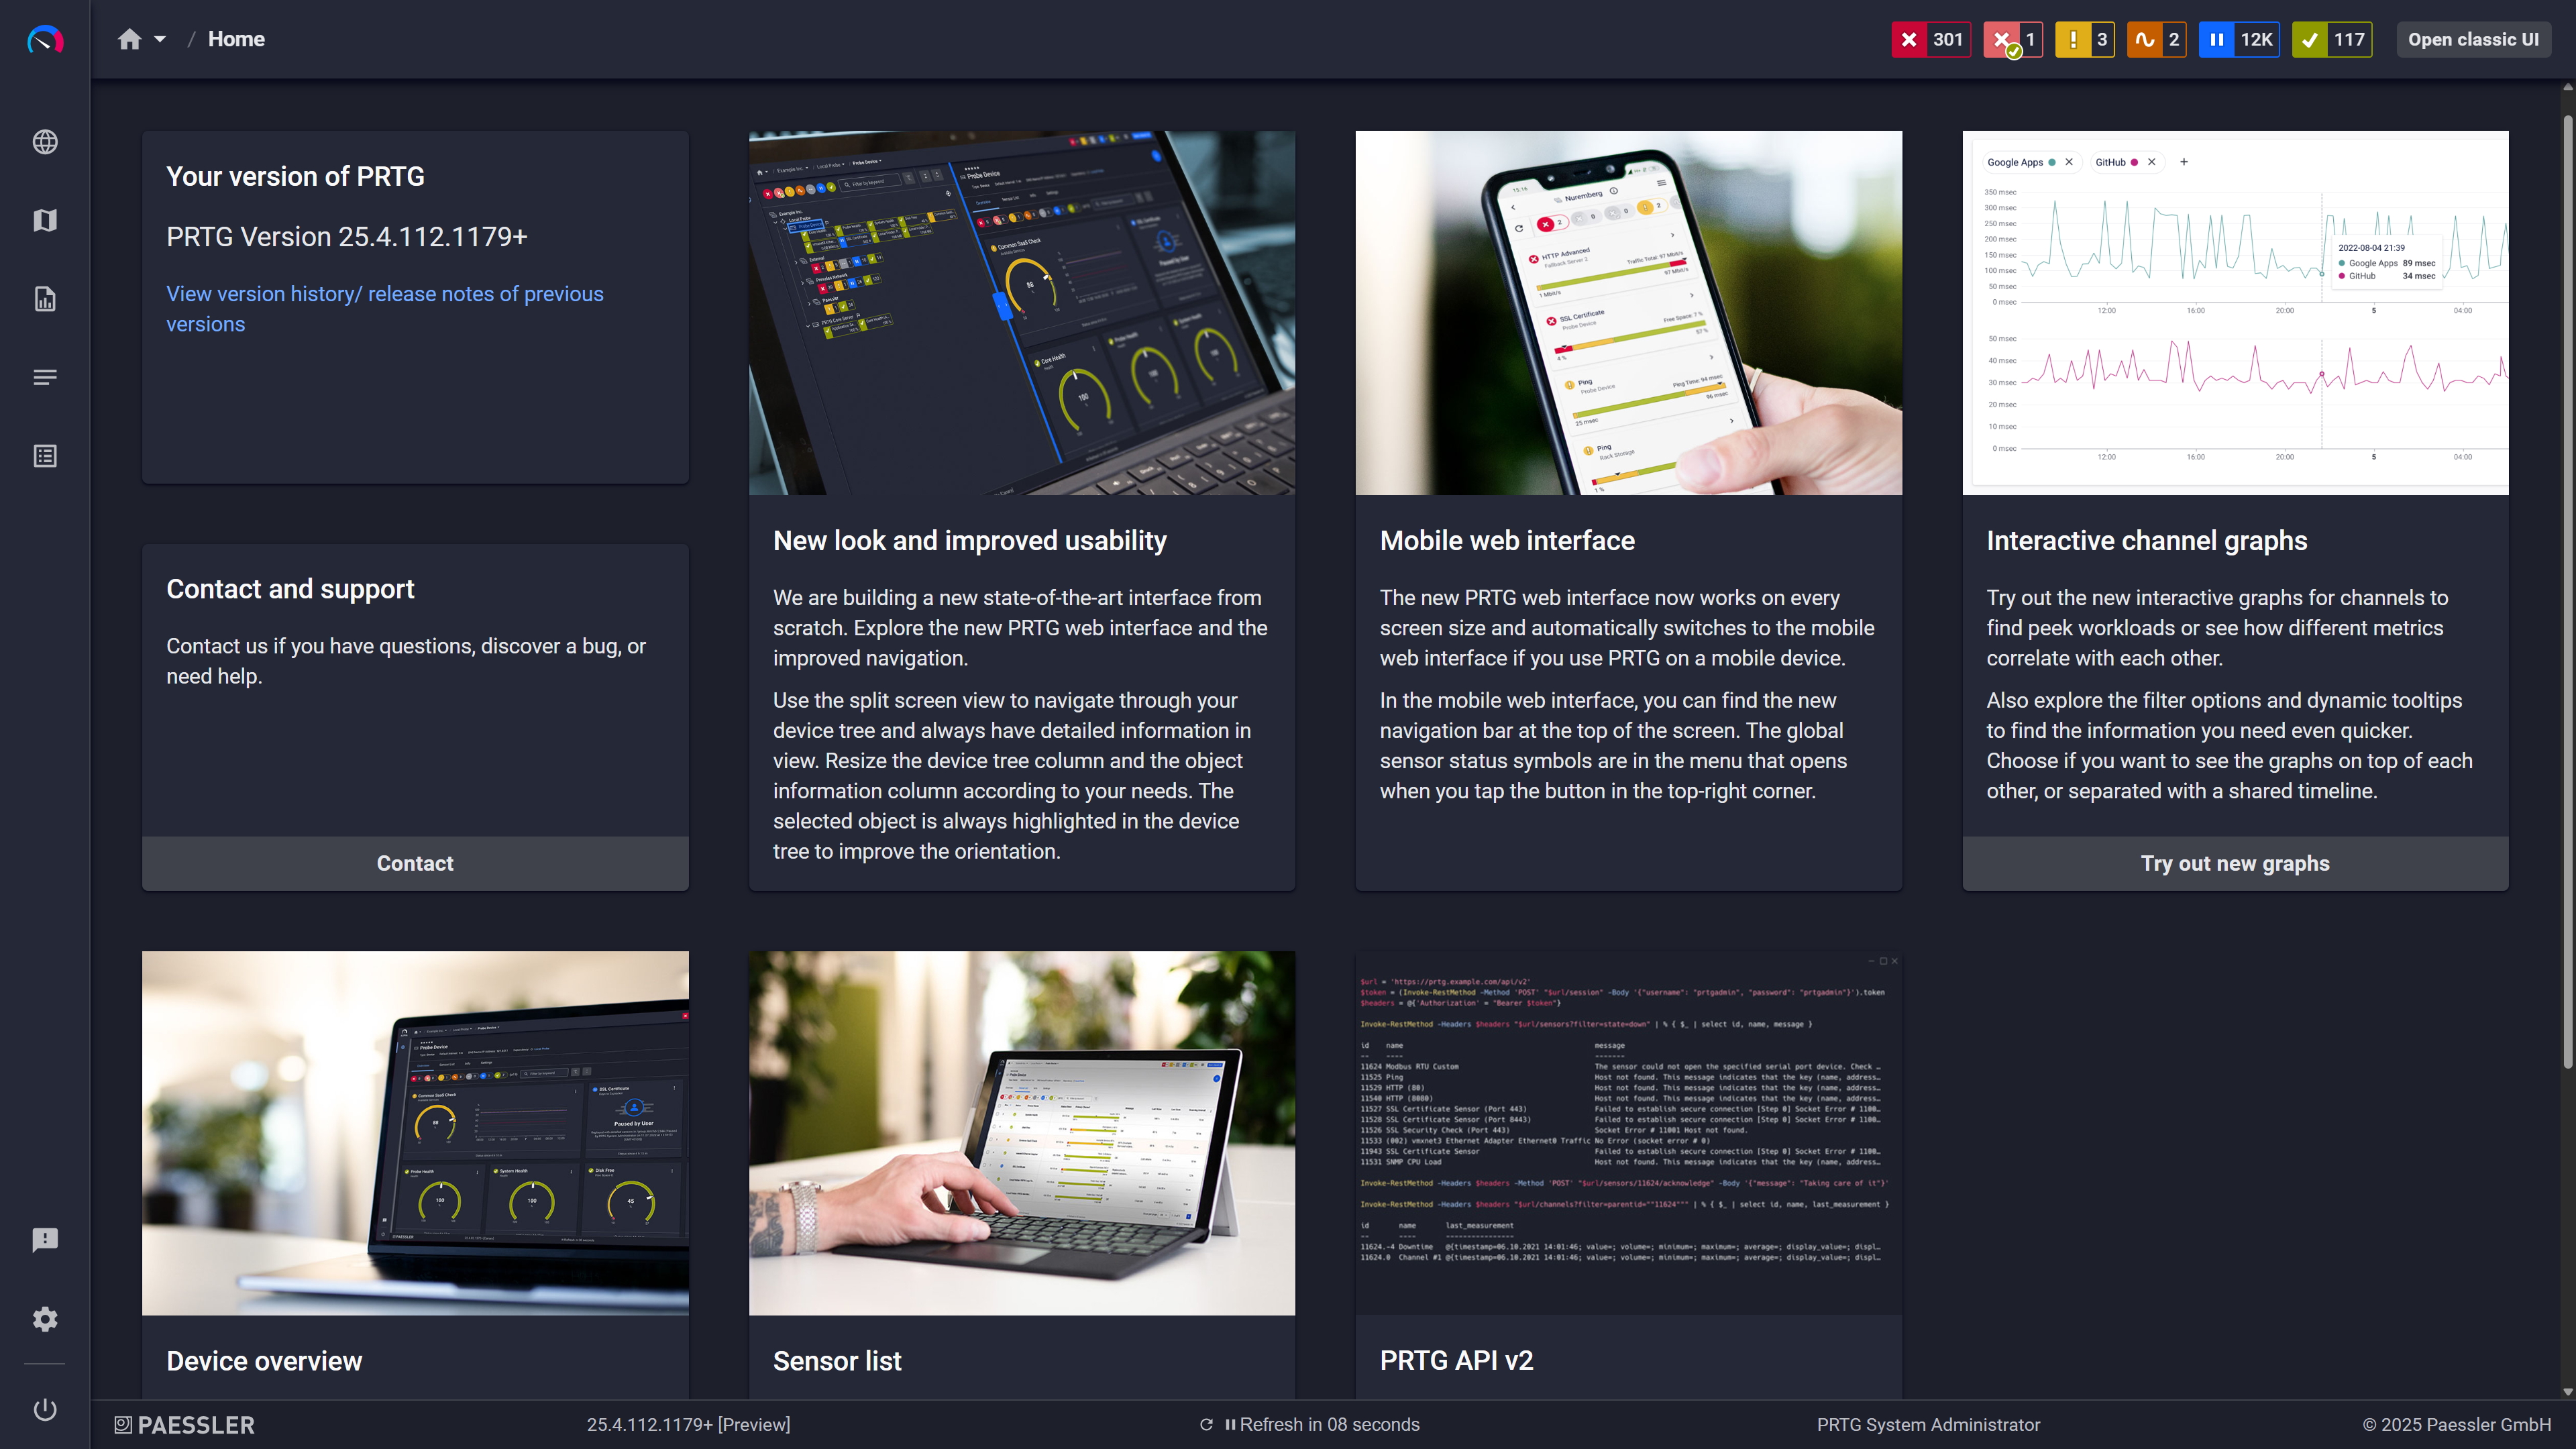
Modern interface, everything within reach

PRTG web interface showing live performance graphs for a Probe Health sensor

Live graphs, real-time performance data

How PRTG Monitors Software Update Status 

PRTG uses WMI and PowerShell to query update status directly from Windows machines and WSUS servers. No agents to install on monitored systems. These sensors work with native Windows protocols already in place. The three sensors work differently, which is worth understanding before you configure them.

Windows Update Sensor

The Windows Updates Status (PowerShell) sensor runs PowerShell scripts on the monitored Windows machine and queries the Windows Update Agent locally. When you configure it, you can point it at the Microsoft Update catalog or a local WSUS server depending on how your update management is set up. It returns counts of hidden, installed, and missing updates segmented by severity class.  
The sensor also tracks time since last successful update per device via a dedicated channel with its own configurable threshold. That's a lot of channels, but in practice you'll focus on the missing count and the time-since-last-update channel depending on your threshold strategy. 

WSUS Monitoring 

Use the WSUS Statistics sensor to connect to the WSUS server via WMI and pulls statistics outside of WSUS's own reporting interface. Returns computer sync states, approval queues, error counts, and overall server health metrics. If your WSUS infrastructure serves an MSP setup or spans multiple sites, the sensor gives you that external view without needing direct console access to the WSUS server itself. 

Security Center Sensor 

Our WMI Security Center sensor queries WMI to read from Windows Security Center / Windows Action Center. Returns status codes for each security product registered on the system. When a product's status changes, including going offline, PRTG registers it as a sensor state change. That covers antivirus, firewall, and anti-spyware tools that register with Windows Security Center. 

Agentless Operation 

All three sensors are agentless. No software to install on monitored endpoints, so compatibility concerns are minimal. They work with what's already there. Bandwidth overhead is low: WMI queries and PowerShell remoting are lightweight by design. 

Access requirements differ by sensor. The Windows Updates Status (PowerShell) sensor requires appropriate permissions and the necessary PowerShell execution/remote-access configuration – depending on your setup, this may include WinRM/PowerShell remoting. The WSUS Statistics and WMI Security Center sensors need WMI/DCOM access rights and network connectivity to the target systems. 

Alerting Thresholds 

Each sensor channel supports its own alert threshold. A common setup: alert when a machine has one or more missing critical updates, or when a device hasn't successfully updated in 14 days. Notifications can be routed via email, SMS, push, or webhooks (and, depending on your setup, additional channels and integrations). These can also be used to trigger downstream actions in connected tools via webhook.

free downLoad

Manual Update Checking vs. Using PRTG

Task

Without PRTG

Without PRTG

With PRTG

With PRTG

Detect a failed Windows update

Without PRTG
not included

Wait for user report or manual log review

With PRTG
included

Automated alert on threshold breach

Check WSUS server health

Without PRTG
not included

Rely on WSUS self-reporting

With PRTG
included

Independent WMI query of WSUS statistics

See update status across all machines

Without PRTG
not included

RDP into each device or pull WSUS reports manually

With PRTG
included

Unified dashboard, continuously updated

Confirm security tools are active

Without PRTG
not included

Manual spot-check per machine

With PRTG
included

Automated status per device via WMI Security Center

Track missing updates by severity

Without PRTG
not included

No central view

With PRTG
included

Per-device, per-severity breakdown

free downLoad

”PRTG helps us monitor critical security systems to give customers the peace of mind that their devices are operational and protecting their valuable assets.”

Rob Jackson, President
Integrated Precision Systems

“When it comes to security, we do of course use classic tools such as firewalls, virus scanners, and intrusion detection systems. However, these are no longer enough today. PRTG provides for additional security by detecting unusual behavior which may be a sign that a hacker has outsmarted our security systems.”

Damir Karacic, IT Administrator
Noris Inklusion

“Monitoring with PRTG is crucial for security. Today’s threats can move low and slow, so in addition to looking at the usual suspects, you also need to keep tabs on other indicators. For example, if a server is running a peak capacity for no apparent reason, you want to know so you can take a look and see what’s up – for example an open connection that is being used to extract data in a ransomware attack.”

Jon Larsen, CIO
Richweb

“The best thing about PRTG is that it provides for simple and effective monitoring, all the while respecting the security requirements of manufacturers. PRTG is so easy to use, that many of our monitoring tasks are now handled by our interns. We will definitely expand our use of the software in the future.”

Karsten Boettger, Head of IT
LAKUMED Clinics

Paessler PRTG Network Monitor licenses & pricing

Choose the PRTG Network Monitor subscription that's best for you.

License NameLicense descriptionPriceLicense DetailsGet startedPricing Details
PRTG 500$200per month paid annuallyBuy nowBuy now

Enough to monitor multiple aspects of 50 devices

PRTG 1000$358per month paid annuallyBuy nowBuy now

Enough to monitor multiple aspects of 100 devices

PRTG 2500$742per month paid annuallyBuy nowBuy now

Enough to monitor multiple aspects of 250 devices

PRTG 5000$1,300per month paid annuallyBuy nowBuy now

Enough to monitor multiple aspects of 500 devices

PRTG 10000$1,642per month paid annuallyBuy nowBuy now

Enough to monitor multiple aspects of 1000 devices

Over 100,000 Customers Worldwide Love Paessler  

customer success stories

 Software Update Monitoring: Frequently Asked Questions


Does PRTG deploy or push updates, or does it only monitor?

Monitoring only. The actual deployment stays with your existing tools: WSUS, SCCM, whatever's already handling your update management. PRTG sits on top as an independent check on the patch process, not a replacement for it. It tells you whether the process worked; it doesn't run the process.

Does PRTG support third-party application update monitoring, e.g. Chrome, Java, Adobe?

Not natively. Built-in sensors cover Windows and Microsoft updates. Extending that functionality to third-party applications, web browser versions, or other apps requires custom PowerShell sensors. That means scripting on your end. It's possible, but it's not a built-in capability and your mileage will vary depending on how those apps expose update state.

Can PRTG monitor Linux update status?

No native sensor for that. PRTG can monitor Linux system health (commonly via SSH, and depending on your setup, also via other standard methods such as SNMP) for metrics like CPU, memory, processes, and similar indicators - but Linux software update status is not covered out of the box. Worth keeping in mind if your environment is mixed.

What specific patch data does PRTG actually show?

Missing update counts by severity class, time since last update per device, installed vs. hidden updates, WSUS sync states per computer, and WSUS approval queue data. Current version gaps and new versions pending approval are both visible. For security-specific tracking, the WMI Security Center sensor adds the security product status layer on top. These are the patch status metrics available without any custom configuration.

How does PRTG work alongside SCCM or dedicated patch management tools?

It's complementary. SCCM handles the deployment side, pushing updates and managing workloads across your environment. PRTG monitors whether the update process completed successfully and surfaces any gaps. In practice, most teams run both: SCCM manages the patch distribution, PRTG provides the independent confirmation that it actually worked.

Is software update monitoring included in the free version of PRTG?

Yes. The free version includes 100 sensors. That's enough to cover update status across a meaningful number of machines using the Windows Updates Status (PowerShell) and WSUS Statistics sensors. For larger deployments, the PRTG pricing page has the plan details.

Does PRTG work for cloud-based or hybrid environments?

PRTG Network Monitor is the on-premises option; PRTG Hosted Monitor is the cloud-based deployment. Both support remote probes for distributed or multi-site IT environments, including MSP setups. Either way, the update monitoring sensors require WMI/DCOM or PowerShell remoting access to the monitored Windows systems. Network connectivity to the target machines is a prerequisite.

Paessler PRTG

Paessler PRTG

Network Monitoring Software – Version 26.1.116.1532 (February 9th, 2026)

Hosting icon

Hosting

Download for Windows and cloud-based version PRTG Hosted Monitor available

Languages icon

Languages

English, German, Spanish, French, Portuguese, Dutch, Russian, Japanese, and Simplified Chinese

test

Monitor everything

Network devices, bandwidth, servers, applications, virtual environments, remote systems, IoT, and more

test

Pricing

Choose the PRTG Network Monitor subscription that's best for you

Discover more monitoring insights and stories

Content illustration

Powerful stories from the monitoring world

  • The importance of vulnerability management for security and ...
  • Firmware Under Control With PRTG - Paessler Blog
  • IoT Device Monitoring: 10 Best Practices for Network Administrators
Support illustration

Resources to master your monitoring challenges

  • Which servers does PRTG connect to for software auto-update ...
  • Use prtg to push software updates
  • PRTG Manual: Update from Previous Versions - Paessler
Solution illustration

Solutions for all your monitoring needs

  • Software Update Monitoring
  • Monitoring Security
  • Network Security Monitoring
PRTG Logo

Start Monitoring with PRTG and see how it can make your network more reliable and your job easier.

Free download
PRODUCT OVERVIEW

Products

  • Paessler PRTG
    Paessler PRTGMonitor your whole IT infrastructure
    • PRTG Network Monitor
    • PRTG Enterprise Monitor
    • PRTG Hosted Monitor
    • PRTG UVexplorer
    • PRTG extensions
      Extensions for Paessler PRTGExtend your monitoring to a new level
  • Icon Features
    FeaturesExplore all monitoring features

Monitoring with PRTG

  • Network monitoring
  • Bandwidth monitoring
  • SNMP monitoring
  • Network mapping
  • Wi-Fi monitoring
  • Server monitoring
  • Network traffic analyzer
  • NetFlow monitoring
  • Syslog server

Useful Links

  • PRTG Manual
  • Knowledge Base
  • Customer Success Stories
  • About Paessler
  • Subscribe to newsletter
  • PRTG Support
  • PRTG Consulting
  • PRTG Feedback & Roadmap

Contact

Paessler GmbH
Thurn-und-Taxis-Str. 14, 
90411 Nuremberg 
Germany

[email protected]

+49 911 93775-0

  • Contact us
©2026 Paessler GmbHTerms & ConditionsPrivacy PolicyImprintReport VulnerabilityDownload & InstallSitemap
References References References