• Company
    • About Us
    • Case Studies
    • Press Center
    • Careers
    • Blog
    • Contact us
  • Contact us
  • Login
 
  • English
    • Deutsch
    • Español
    • Français
    • Italiano
    • Português
Paessler
                    - The Monitoring Experts
  • Products
    • Paessler PRTG
      Paessler PRTGMonitor your whole IT infrastructure
      • PRTG Network Monitor
      • PRTG Enterprise Monitor
      • PRTG Hosted Monitor
      • PRTG UVexplorer
      • PRTG extensionsExtensions for Paessler PRTGExtend your monitoring to a new level
    • Icon Features
      FeaturesExplore all monitoring features
      • Maps & dashboards
      • Alerts & notifications
      • Multiple user interfaces
      • Distributed monitoring
      • Customizable reporting
  • Solutions
    • Industries
      IndustriesMonitor various industry sectors
      • Industrial
      • Healthcare
      • Data Center
      • Education
      • Finance
      • Government
    • IT Topics
      IT TopicsMonitor all areas of IT
      • Network Monitoring
      • Bandwidth Monitoring
      • SNMP Monitor
      • Network Mapping
      • WiFi Monitoring
      • Server Monitoring
  • Pricing
  • Resources
    • Getting Started
      Getting StartedModules for self-paced learning
    • How-to Guides
      How-to GuidesGet the most out of PRTG
    • Videos & Webinars
      Videos & WebinarsLearn from Paessler experts
    • IT  Knowledge
      IT KnowledgeExpand your IT knowledge
    • PRTG Manual
      PRTG ManualFull documentation
    • Knowledge Base
      Knowledge BaseShare community knowledge
    • PRTG Sensor Hub
      PRTG Sensor HubGet sensors, scripts & templates
    • Trainings
      PRTG TrainingLearn how to work with PRTG
  • Partners
    • Icon Handshake
      Become a PartnerFor resellers and channel partners
    • Icon MSP
      Become an MSPDeliver monitoring as a managed service
    • icon partner
      Partner PortalLog in to your partner account
    • Deal Registration
      Deal RegistrationRegister your sales opportunities
    • icon search
      Find a PartnerFind partners selling Paessler products
    • icon technology
      Technology AlliancesSee Paessler technology partnerships
    • Partner HubTools for Your Success
  • Company
    • About Us
    • Case Studies
    • Press Center
    • Careers
    • Blog
    • Contact us
  • Contact us
  • Login
  • English
    • Deutsch
    • Español
    • Français
    • Italiano
    • Português
  • Get a quote
  • Free trial

Proactive Computer Monitoring Tool

Continuous monitoring for Windows computers that tracks availability and performance metrics, sends notifications, and speeds up troubleshooting. 

Free download
PRODUCT OVERVIEW

What should a computer monitoring tool track? 

A practical computer monitoring tool should give you real-time visibility into system health and availability, not just one-off snapshots. It should collect consistent metrics across Windowscomputer systems (and connect to broader IT infrastructure and network monitoring) and present the results in clear dashboards with thresholds and notifications.

With PRTG, you can use one monitoring solution for computer monitoring, system monitoring, and performance monitoring. You can track key Windows metrics like uptime, disk health status for hard drives, and CPU usage, so IT professionals can start diagnostics and troubleshooting with data instead of guesswork.

Supported technologies: Windows monitoring via WMI and performance counters (hybrid approach where applicable), auto-discovery for devices reachable in the probe’s network (primarily intended for devices in the same network as your probes), disk health monitoring (WMI Disk Health sensor), uptime monitoring (Windows System Uptime sensor), battery/UPS monitoring (metrics depend on what the laptop/UPS exposes; SNMP UPS support depends on the device), and Windows update status monitoring (Windows Updates Status (PowerShell) sensor).

Download PRTG Trial

What you will find on this page

  • What You Can Track and Manage
  • How PRTG Monitors
  • Manual Monitoring vs. PRTG
  • FAQs

PRTG is compatible with all major vendors, products, and systems

compatible with all major vendors, products, and systems

What You Can Track and Manage on Windows Systems

Disk Health Visibility Across Windows Systems

Disk health status across Windows systems is most useful when it's tracked consistently over time, not checked reactively after performance changes.

PRTG's computer monitoring software includes the WMI Disk Health sensor, so you can track disk health and operational status over time. Set thresholds and use notifications to react to changes you care about, using the same dashboard view you already use for other monitoring capabilities.

  • Disk health status and operational state in one view
  • Threshold-based notifications when health values change
  • Near Real-time dashboards for quick triage
  • Trend visibility for smarter replacement planning

Get Uptime Metrics You Can Trust 

Consistent uptime tracking gives post-incident reviews a reliable data foundation and makes troubleshooting timelines easier to reconstruct.

With PRTG monitoring software, you can track uptime consistently on Windows computer systems and keep history for reviews. This supports clearer reporting for IT infrastructure operations and helps with troubleshooting because you can compare downtime with other system metrics on your dashboards.

  • Continuous uptime monitoring for Windows systems
  • Availability history to support troubleshooting and reviews
  • Reports that summarize downtime (scope depends on reporting configuration)
  • Clear dashboards for IT professionals and stakeholders
PRTG web interface showing device tree and full device list with sensor status badges

Full device list, instant overview

PRTG SNMP Disk Free sensor showing free space, free bytes, and total disk capacity gauges

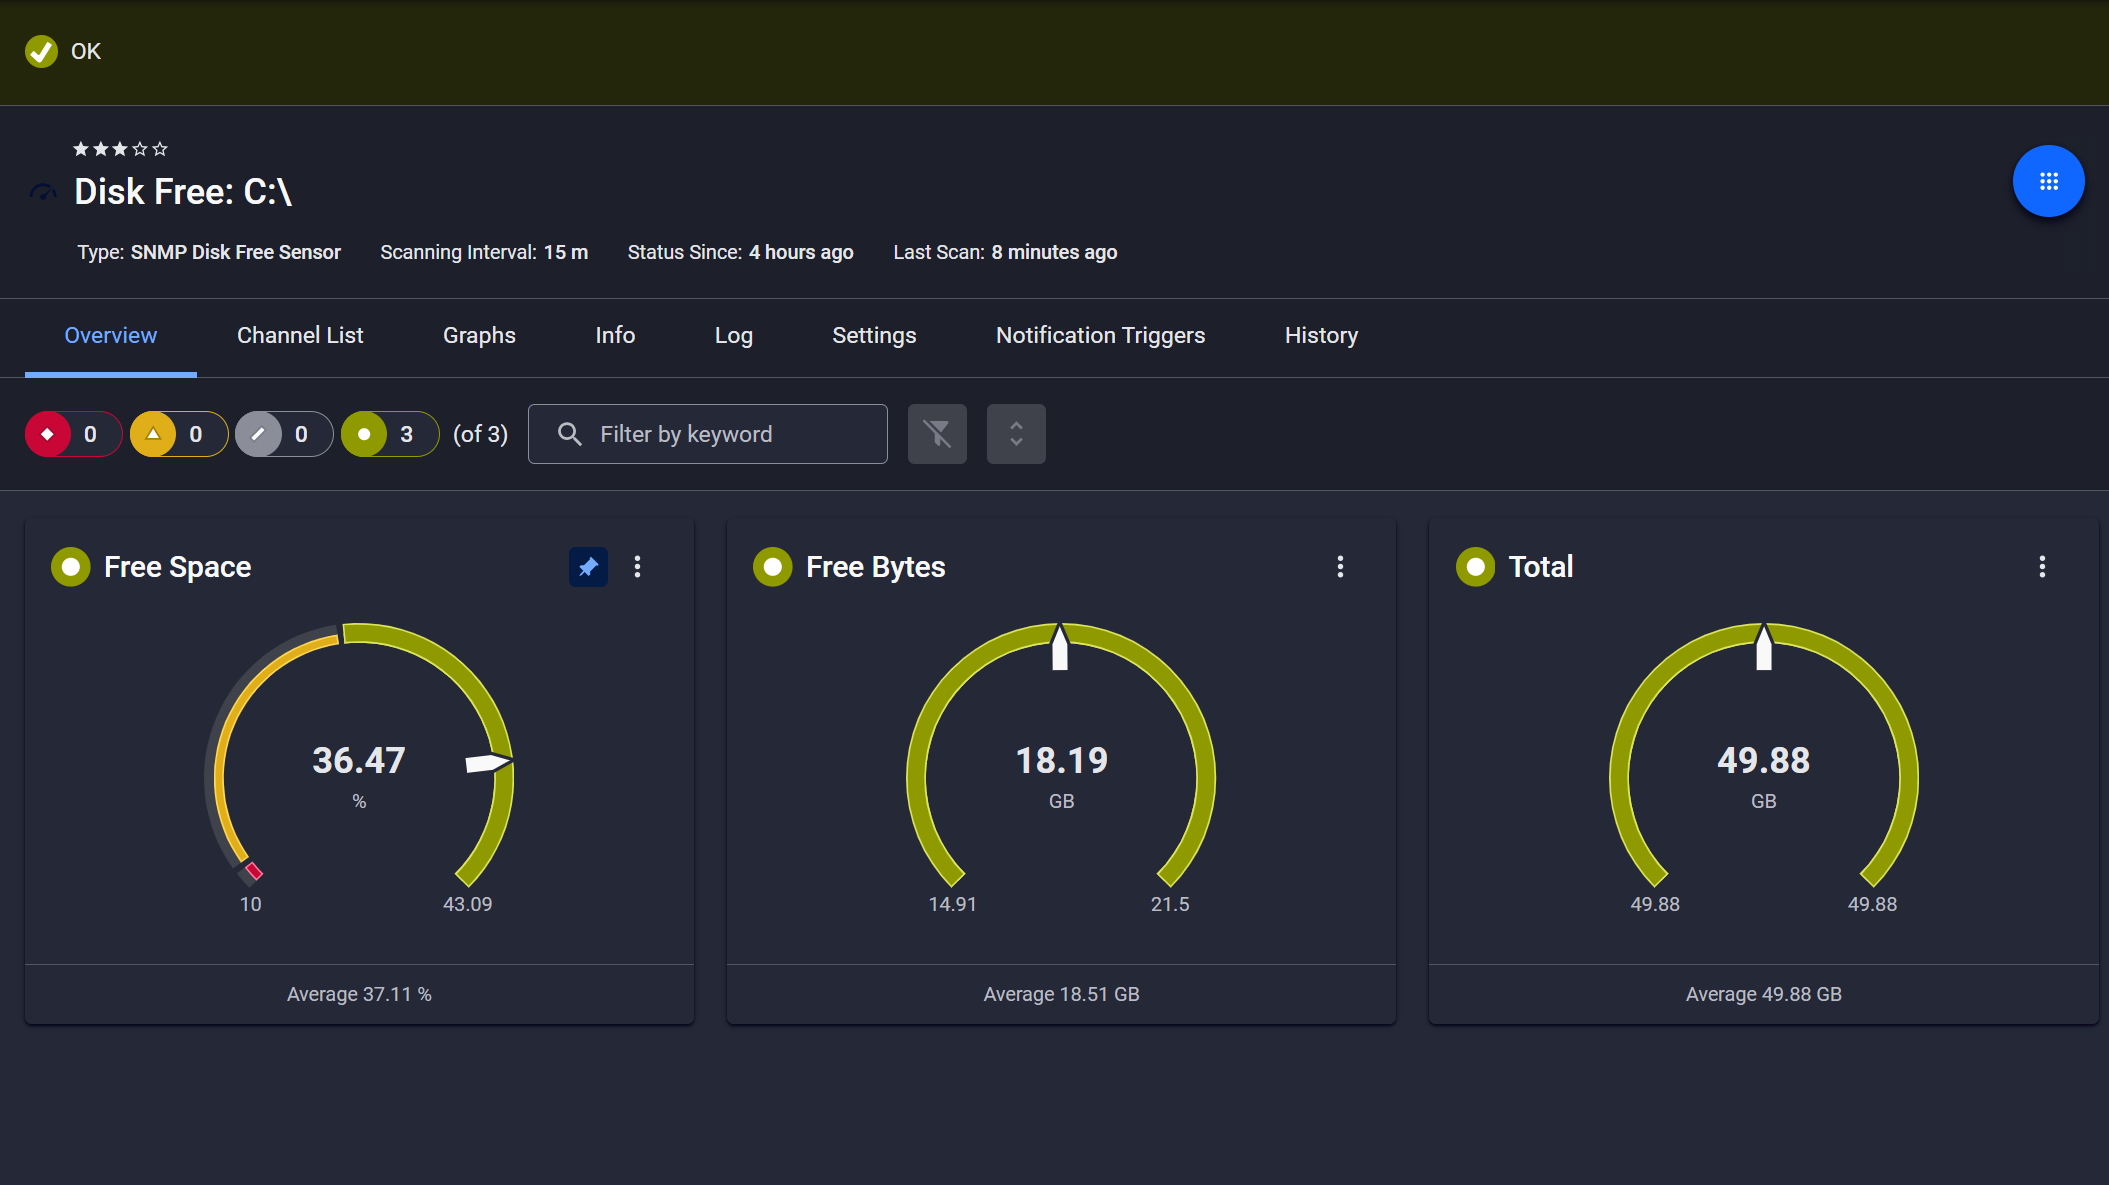
Disk space monitored, alerts ready

PRTG web interface showing live performance graphs for a Probe Health sensor

Live graphs, real-time performance data

See Patch Status Without Manual Checks 

A central view of patch status makes it straightforward to see what's current across your Windows systems and act on what needs attention.

PRTG includes the Windows Updates Status (PowerShell) sensor to monitor Windows update status and counts of available and installed updates from Microsoft or WSUS. That gives you one place to track update-related metrics, set thresholds, and use notifications to keep the status visible without turning this into a separate tool.

  • Central visibility into Windows update status
  • Thresholds and notifications to reduce “silent drift”
  • Faster remediation prioritization
  • Supports compliance-minded workflows (without compliance guarantees)

See Why IT Professionals Trust PRTG

Start monitoring your infrastructure in minutes. No professional services, no complex configuration, no risk.

Free download
PRODUCT OVERVIEW

Keep Laptop and UPS Batteries Predictable

Battery wear and UPS runtime are worth tracking consistently, especially with laptops and UPS-backed workstations where gradual decline affects day-to-day operations.

PRTG can support hardware monitoring for battery/UPS runtime where the device exposes the data. You can track those metrics on a dashboard, set thresholds, and use notifications when runtime drops below what you consider safe, without claiming the same data is available on every model.

  • Battery/runtime metrics where exposed by laptop/UPS
  • Notifications when runtime drops below your threshold
  • Trend visibility for replacement planning
  • Dashboards for quick fleet checks
PRTG device view showing sensor list for a monitored Microsoft Exchange server

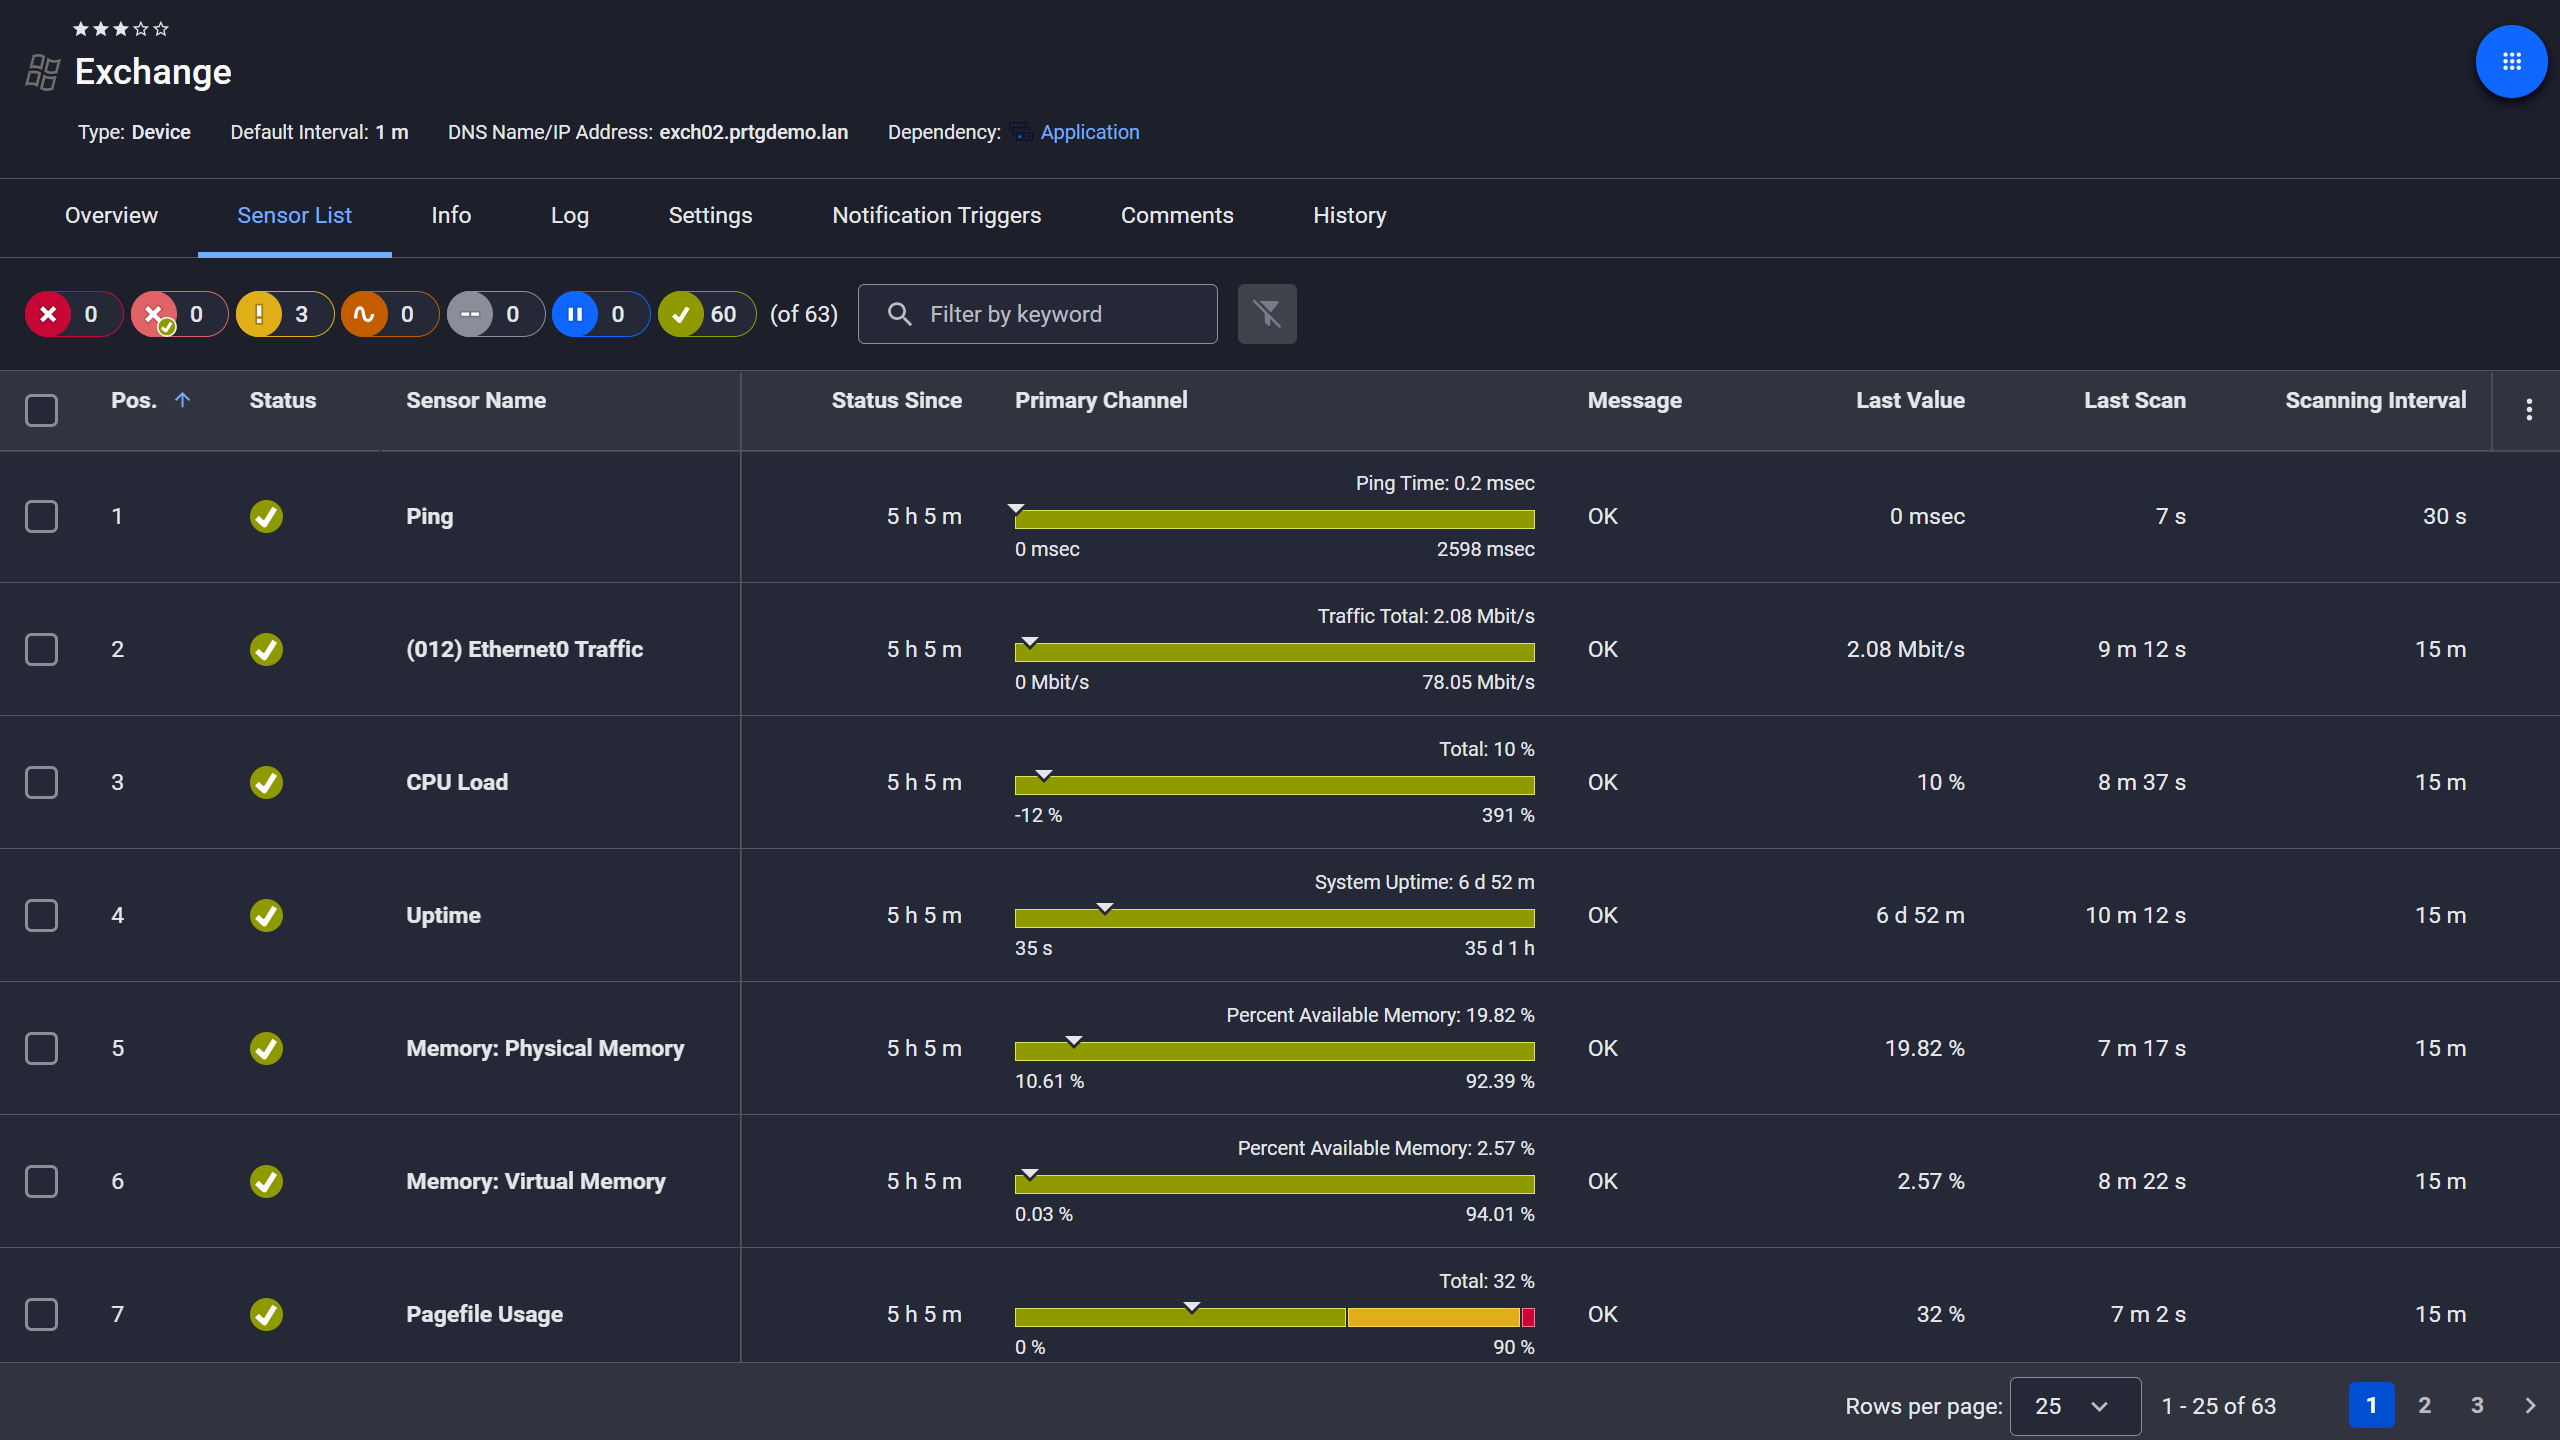
Exchange server, fully under control

PRTG reports list showing scheduled monitoring reports with run times and sensor counts

Scheduled reports, always on time

PRTG home screen showing feature highlight cards including mobile interface and API

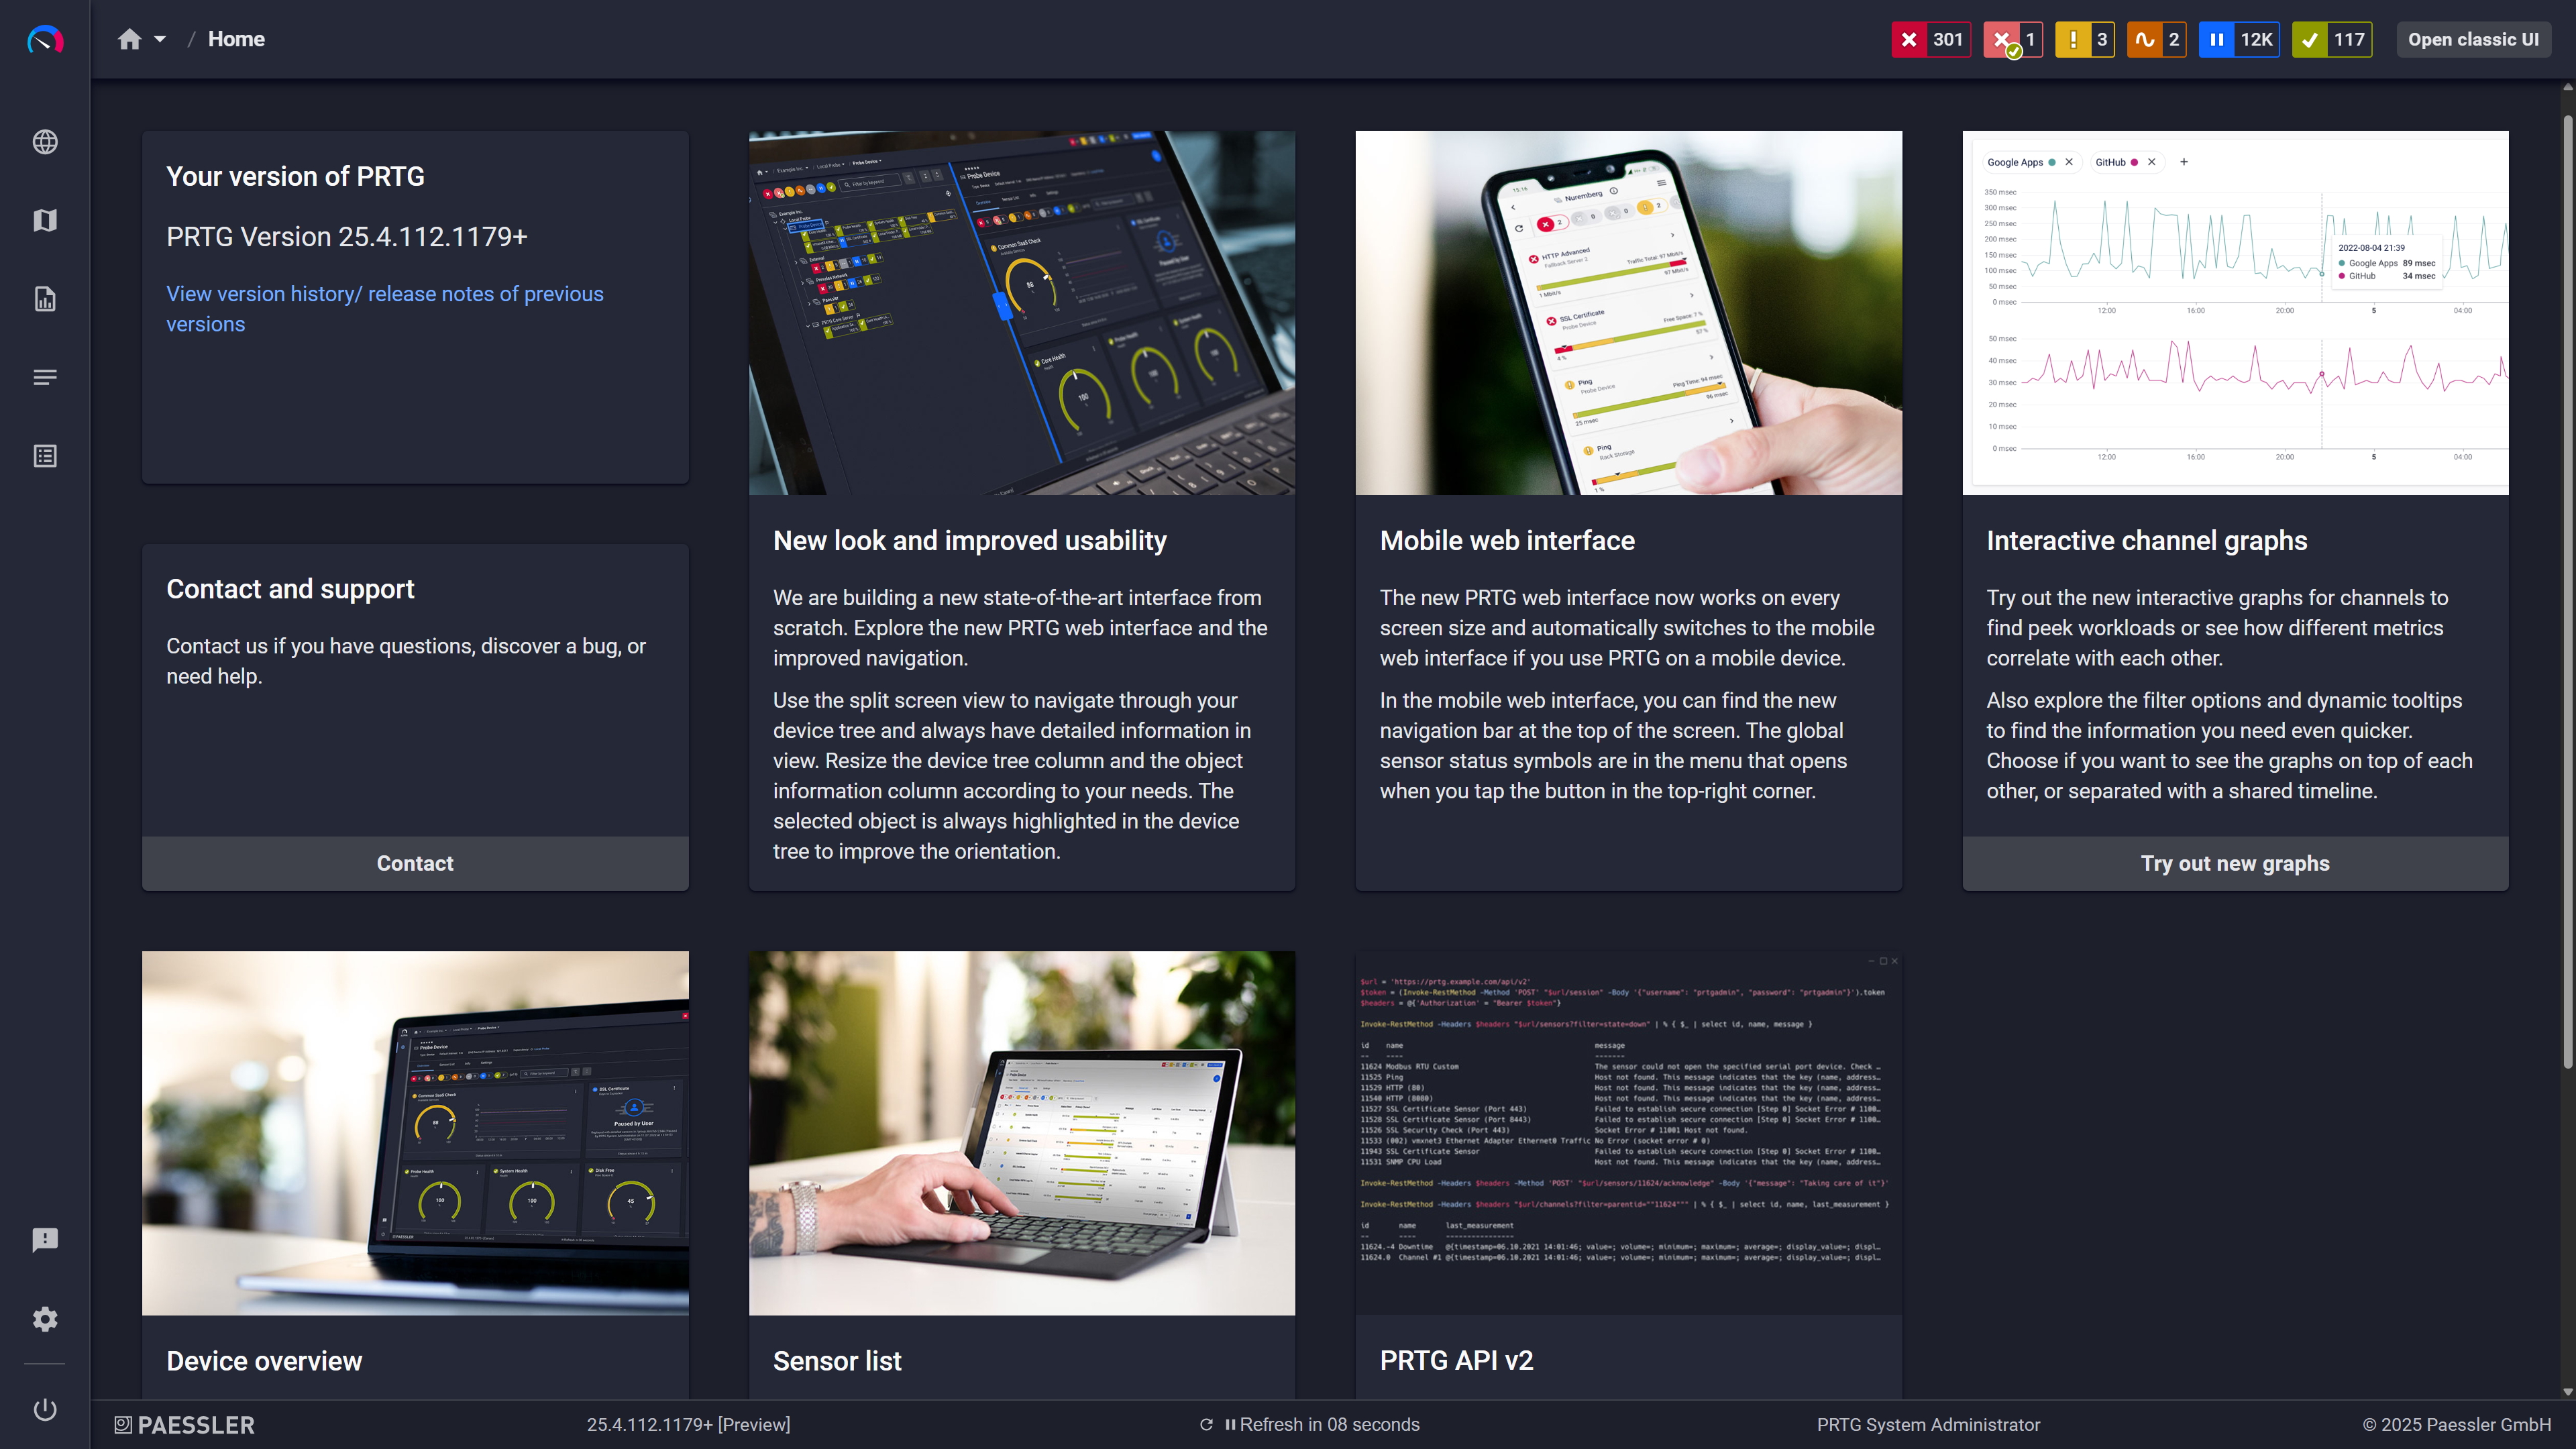
Modern interface, everything within reach

One Dashboard for Windows and Beyond

Bringing Windows system monitoring and broader network monitoring into one place means your team works from shared data and context during troubleshooting.

PRTG is a monitoring tool that can combine Windows system checks with broader network monitoring and other monitoring capabilities in one place. You can build dashboards that match how your team works, and use thresholds and notifications to keep the signal clear. The result is a shared view that supports faster troubleshooting, without claiming business-style KPI reporting.

  • One dashboard for core Windows system monitoring signals
  • Shared visibility for faster handoffs during troubleshooting
  • Threshold-based alerting to cut noise
  • Scales from a small setup to broader IT infrastructure coverage

How PRTG Monitors Computer Systems  

This section summarizes the main ways PRTG collects Windows metrics and how it structures them so you can trend, alert, and review the data.

WMI And Counters 

PRTG can query Windows metrics via WMI or Windows performance counters, depending on the sensor and your Windows Compatibility Options. If you enable a hybrid approach where applicable, the sensor tries performance counters first and uses WMI as a fallback if performance counter queries fail. This helps you keep system monitoring consistent across different Windows versions and configurations without changing your workflow.

Auto Discovery 

Auto-discovery can create an initial set of sensors for devices in your network, which is helpful when you want a fast baseline across many computer systems. It’s primarily intended for devices that are reachable in the same network as your probes, so plan coverage with that in mind. After discovery, you typically refine the setup by adjusting which sensors you keep and what thresholds make sense for each system or group.

Sensors And Channels 

In PRTG, a sensor is a defined check (for example, a disk health sensor or uptime sensor), and sensors return one or more channels. Channels are the individual metrics you chart over time, compare across systems, and use for troubleshooting. This structure makes it easier to build dashboards that show the right level of detail for IT professionals, from quick status views to more in-depth diagnostics.

Threshold Alerting 

Thresholds are the core of how PRTG turns monitoring data into something you can act on. You define limits for the metrics you care about (for example, CPU usage, disk health status changes, or counts of available updates), and PRTG checks those values on the scan interval you set. When a value crosses a threshold, PRTG sends notifications based on your rules, so alerts stay tied to measurable changes instead of assumptions.

Dashboards And Views 

PRTG dashboards let you bring system monitoring and performance monitoring views together so you can see what matters at a glance. You can create different dashboard views for different teams or responsibilities (for example, a Windows-focused view vs. a service-focused view), and you can group computer systems in ways that match your environment. Like any monitoring setup, dashboards take some time to tune, especially if you want to optimize for low noise and fast troubleshooting.

free downLoad

Manual Computer Monitoring vs. Monitoring with PRTG

FEATURE

Without PRTG

Without PRTG

With PRTG

With PRTG

Disk health monitoring signals and alerts

Without PRTG
not included

Spot checks and ad-hoc reviews

With PRTG
included

Continuous monitoring with thresholds and notifications

Uptime measurement and reporting

Without PRTG
not included

Inconsistent checks and partial logs

With PRTG
included

Continuous uptime history for reviews and troubleshooting

Patch status visibility

Without PRTG
not included

Per-system checks

With PRTG
included

Central view of update status and counts of available/installed updates

Battery/UPS runtime visibility

Without PRTG
not included

Local checks, device-by-device

With PRTG
included

Monitoring where the device exposes metrics, with thresholds

Troubleshooting workflow

Without PRTG
not included

Guesswork and scattered data

With PRTG
included

Historical metrics + dashboards + consistent thresholds

free downLoad

There are around 20 people within the business across various departments using PRTG who look at the dashboard, but the beauty of it is that we don't really have to look at it. In terms of its day-to-day use, we just let it do its thing, and we just act on alerts when necessary.

Ollie Kerslake, Infrastructure Lead
Riverford Organic Farmers

“The tool has given us greater control over all types of devices connected to the network (switches, IP telephony, security cameras, IoT, WiFi) that previously remained opaque when dealing with service incidents. This has improved our ability to diagnose and resolve problems, which has translated into greater efficiency and a better user experience in both internal and public services.”

Jordi Tolosà Bel, New Technologies Technician
Vinaroz City Council

“Our objective was to be able to monitor the health of our most critical servers containing data and applications, but also the flows and bandwidth between headquarters, our 50 servers in the cloud and the 15 servers at our production sites. For us, it is essential to have a proactive approach to understand where the weaknesses of the IT system are to be able to improve them.”

Marc Boullier, CIO
Carambar & Co

Paessler PRTG Network Monitor licenses & pricing

Choose the PRTG Network Monitor subscription that's best for you.

License NameLicense descriptionPriceLicense DetailsGet startedPricing Details
PRTG 500$200per month paid annuallyBuy nowBuy now

Enough to monitor multiple aspects of 50 devices

PRTG 1000$358per month paid annuallyBuy nowBuy now

Enough to monitor multiple aspects of 100 devices

PRTG 2500$742per month paid annuallyBuy nowBuy now

Enough to monitor multiple aspects of 250 devices

PRTG 5000$1,300per month paid annuallyBuy nowBuy now

Enough to monitor multiple aspects of 500 devices

PRTG 10000$1,642per month paid annuallyBuy nowBuy now

Enough to monitor multiple aspects of 1000 devices

Over 100,000 Customers Worldwide Love Paessler  

customer success stories

Computer Monitoring Tool: Frequently Asked Questions


What is “computer monitoring” in IT infrastructure?

In IT, computer monitoring means tracking availability and performance metrics for endpoints and servers so you can spot potential issues early and shorten troubleshooting. A good monitoring solution focuses on metrics you can trend, alert on, and review.

Does PRTG support Windows 10 and Microsoft environments?

PRTG is commonly used for Windows monitoring, including Windows 10 systems in Microsoft environments. Exact compatibility depends on what you monitor (WMI, performance counters, PowerShell, SNMP) and your setup.

Which metrics can I monitor on Windows computers with PRTG?

Typical system monitoring includes uptime, CPU usage, disk-related status, and update status. The exact metrics depend on the sensors you use and what the target system exposes via WMI, counters, or PowerShell.

Can PRTG monitor Linux and macOS systems too?

PRTG can be used across different operating systems as part of broader IT infrastructure monitoring, including Linux and mac systems. The available metrics and methods depend on the platform and protocol.

How do thresholds and notifications work in PRTG?

You define thresholds for selected metrics, then choose how you want notifications to be sent. This keeps alerts tied to measurable values, and helps you optimize signal vs noise.

Can I access dashboards on mobile devices (Android/iOS apps)?

PRTG supports access options for mobile devices, including apps for Android and iOS, so you can check dashboards and receive notifications while away from your desk.

How does pricing work for PRTG monitoring software?

PRTG pricing depends on the edition and monitoring scale (for example, how many sensors you use and what scope you monitor). For a decision, it’s best to match pricing to the monitoring capabilities you need.

Can PRTG monitor CPU temperature or fan speeds?

Sometimes, but it depends on what the hardware and Windows expose. For things like CPU temperature, fan speeds, GPU data, overheating signals, or other processor-level telemetry, you may need vendor interfaces or custom sensors. Avoid assuming these are available out of the box on every system.

Paessler PRTG

Paessler PRTG

Network Monitoring Software – Version 26.1.116.1532 (February 9th, 2026)

Hosting icon

Hosting

Download for Windows and cloud-based version PRTG Hosted Monitor available

Languages icon

Languages

English, German, Spanish, French, Portuguese, Dutch, Russian, Japanese, and Simplified Chinese

test

Monitor everything

Network devices, bandwidth, servers, applications, virtual environments, remote systems, IoT, and more

test

Pricing

Choose the PRTG Network Monitor subscription that's best for you

Discover more monitoring insights and stories

Content illustration

Powerful stories from the monitoring world

  • How to Move an Installation of PRTG 7 to Another Computer
  • How to Reboot a Remote Computer via WMI (No Extra Software ...
  • Autism and Early Computers – Curiosity Goes beyond Borders
Support illustration

Resources to master your monitoring challenges

  • Monitor Computer Certificate Stores
  • how to monitor local computer CPU loads, RAM - Paessler Helpdesk
  • How can I monitor WMI sensors if the target machine is not part of a ...
Solution illustration

Solutions for all your monitoring needs

  • Computer Monitoring
  • Workstation Monitoring
  • Computer Inventory Management
PRTG Logo

Start Monitoring with PRTG and see how it can make your network more reliable and your job easier.

Free download
PRODUCT OVERVIEW

Products

  • Paessler PRTG
    Paessler PRTGMonitor your whole IT infrastructure
    • PRTG Network Monitor
    • PRTG Enterprise Monitor
    • PRTG Hosted Monitor
    • PRTG UVexplorer
    • PRTG extensions
      Extensions for Paessler PRTGExtend your monitoring to a new level
  • Icon Features
    FeaturesExplore all monitoring features

Monitoring with PRTG

  • Network monitoring
  • Bandwidth monitoring
  • SNMP monitoring
  • Network mapping
  • Wi-Fi monitoring
  • Server monitoring
  • Network traffic analyzer
  • NetFlow monitoring
  • Syslog server

Useful Links

  • PRTG Manual
  • Knowledge Base
  • Customer Success Stories
  • About Paessler
  • Subscribe to newsletter
  • PRTG Support
  • PRTG Consulting
  • PRTG Feedback & Roadmap

Contact

Paessler GmbH
Thurn-und-Taxis-Str. 14, 
90411 Nuremberg 
Germany

[email protected]

+49 911 93775-0

  • Contact us
©2026 Paessler GmbHTerms & ConditionsPrivacy PolicyImprintReport VulnerabilityDownload & InstallSitemap
CCTV CCTV CCTV