• Company
    • About Us
    • Case Studies
    • Press Center
    • Careers
    • Blog
    • Contact us
  • Contact us
  • Login
 
  • English
    • Deutsch
    • Español
    • Français
    • Italiano
    • Português
Paessler
                    - The Monitoring Experts
  • Products
    • Paessler PRTG
      Paessler PRTGMonitor your whole IT infrastructure
      • PRTG Network Monitor
      • PRTG Enterprise Monitor
      • PRTG Hosted Monitor
      • PRTG UVexplorer
      • PRTG extensionsExtensions for Paessler PRTGExtend your monitoring to a new level
    • Icon Features
      FeaturesExplore all monitoring features
      • Maps & dashboards
      • Alerts & notifications
      • Multiple user interfaces
      • Distributed monitoring
      • Customizable reporting
  • Solutions
    • Industries
      IndustriesMonitor various industry sectors
      • Industrial
      • Healthcare
      • Data Center
      • Education
      • Finance
      • Government
    • IT Topics
      IT TopicsMonitor all areas of IT
      • Network Monitoring
      • Bandwidth Monitoring
      • SNMP Monitor
      • Network Mapping
      • WiFi Monitoring
      • Server Monitoring
  • Pricing
  • Resources
    • Getting Started
      Getting StartedModules for self-paced learning
    • How-to Guides
      How-to GuidesGet the most out of PRTG
    • Videos & Webinars
      Videos & WebinarsLearn from Paessler experts
    • IT  Knowledge
      IT KnowledgeExpand your IT knowledge
    • PRTG Manual
      PRTG ManualFull documentation
    • Knowledge Base
      Knowledge BaseShare community knowledge
    • PRTG Sensor Hub
      PRTG Sensor HubGet sensors, scripts & templates
    • Trainings
      PRTG TrainingLearn how to work with PRTG
  • Partners
    • Icon Handshake
      Become a PartnerFor resellers and channel partners
    • Icon MSP
      Become an MSPDeliver monitoring as a managed service
    • icon partner
      Partner PortalLog in to your partner account
    • Deal Registration
      Deal RegistrationRegister your sales opportunities
    • icon search
      Find a PartnerFind partners selling Paessler products
    • icon technology
      Technology AlliancesSee Paessler technology partnerships
    • Partner HubTools for Your Success
  • Company
    • About Us
    • Case Studies
    • Press Center
    • Careers
    • Blog
    • Contact us
  • Contact us
  • Login
  • English
    • Deutsch
    • Español
    • Français
    • Italiano
    • Português
  • Get a quote
  • Free trial

Proactive Business Process Monitoring

Monitor end-to-end service health across all dependencies. Get real-time visibility into process health and performance metrics 

Free download
PRODUCT OVERVIEW

How Do You Monitor a Business Process and Not Just Its Individual Components?  

Monitoring business processes means more than checking if a server is up. It means knowing whether the services your operations depend on are actually functioning, end to end, across every component, protocol, and location they rely on. A single component going green tells you nothing about whether the service itself is healthy.  

Paessler PRTG combines sensors from across your infrastructure into a single aggregated service-level monitor, up to 50 channels per Business Process sensor. Instead of tracking server health, network status, and application availability separately, you define a service. Whether its remote access, a web application, or an ERP system, and PRTG watches every component it relies on. One combined status in real time. When something degrades, you see exactly which part is affected.  

PRTG monitors services built on: web servers, VPN gateways, RDP/RDS environments, Active Directory, SQL databases, cloud endpoints (HTTP/HTTPS), SNMP-enabled network devices, WMI-monitored Windows systems, and external HTTP/HTTPS endpoints.  

Supported protocols and methods: SNMP, WMI, HTTP/HTTPS, ICMP ping, RDP, REST API.

Download PRTG Trial

What you will find on this page

  • Full Business Process Visibility
  • How PRTG Monitors Business Processes
  • Business Process Monitoring: Manual Effort vs. PRTG
  • FAQs

PRTG is compatible with all major vendors, products, and systems

compatible with all major vendors, products, and systems

Full Business Process Visibility, From a Single View

Catch Service Degradation Before Your Users Do

Individual components show green, but the service is not responding. By the time a ticket arrives, the disruption has already started, and your business operations are paying for it.  

PRTG gives you service-level visibility. Define which components make up a service, set warning and error thresholds that reflect your operational KPIs (key performance indicators), and PRTG continuously monitors combined process health. When any part degrades past your threshold, an alert fires, enabling corrective action before the impact reaches your users. Before customer satisfaction takes the hit.

  • Service-level alerting that reflects the combined health of all monitored dependencies
  • Configurable warning and error thresholds per service component: set them to reflect your KPIs
  • Real-time status across mixed environments: on-premises, cloud, and hybrid
  • Alerts trigger on service degradation, not just complete failure
  • No scripting required for standard service monitor setup

Track Every Service Across All Its Dependencies, In One Place

Modern services span many components. When one falls silent, you're cross-referencing dashboards to identify bottlenecks and possible causes, while users are already affected and process efficiency drops.  

PRTG pulls everything into one structured service view. Sensors from different devices, protocols, and locations feed into a single model. External HTTP/HTTPS endpoints, a third-party API, a payment provider, are included too. You define the service once. PRTG watches the full chain, giving you the performance data you need to streamline troubleshooting across every dependency. That data supports data-driven decision making about where inefficiencies actually sit. 

  • Cross-device, cross-protocol service models using SNMP, WMI, HTTP, ping, RDP, and more
  • External endpoint availability (HTTP/HTTPS) included in the same service view
  • Optimize operational efficiency by correlating data from all service components in one view
  • Service model defined by you, reflecting your actual process flows and infrastructure dependencies
  • No separate monitoring tool needed per technology layer
PRTG reports list showing scheduled monitoring reports with run times and sensor counts

Scheduled reports, always on time

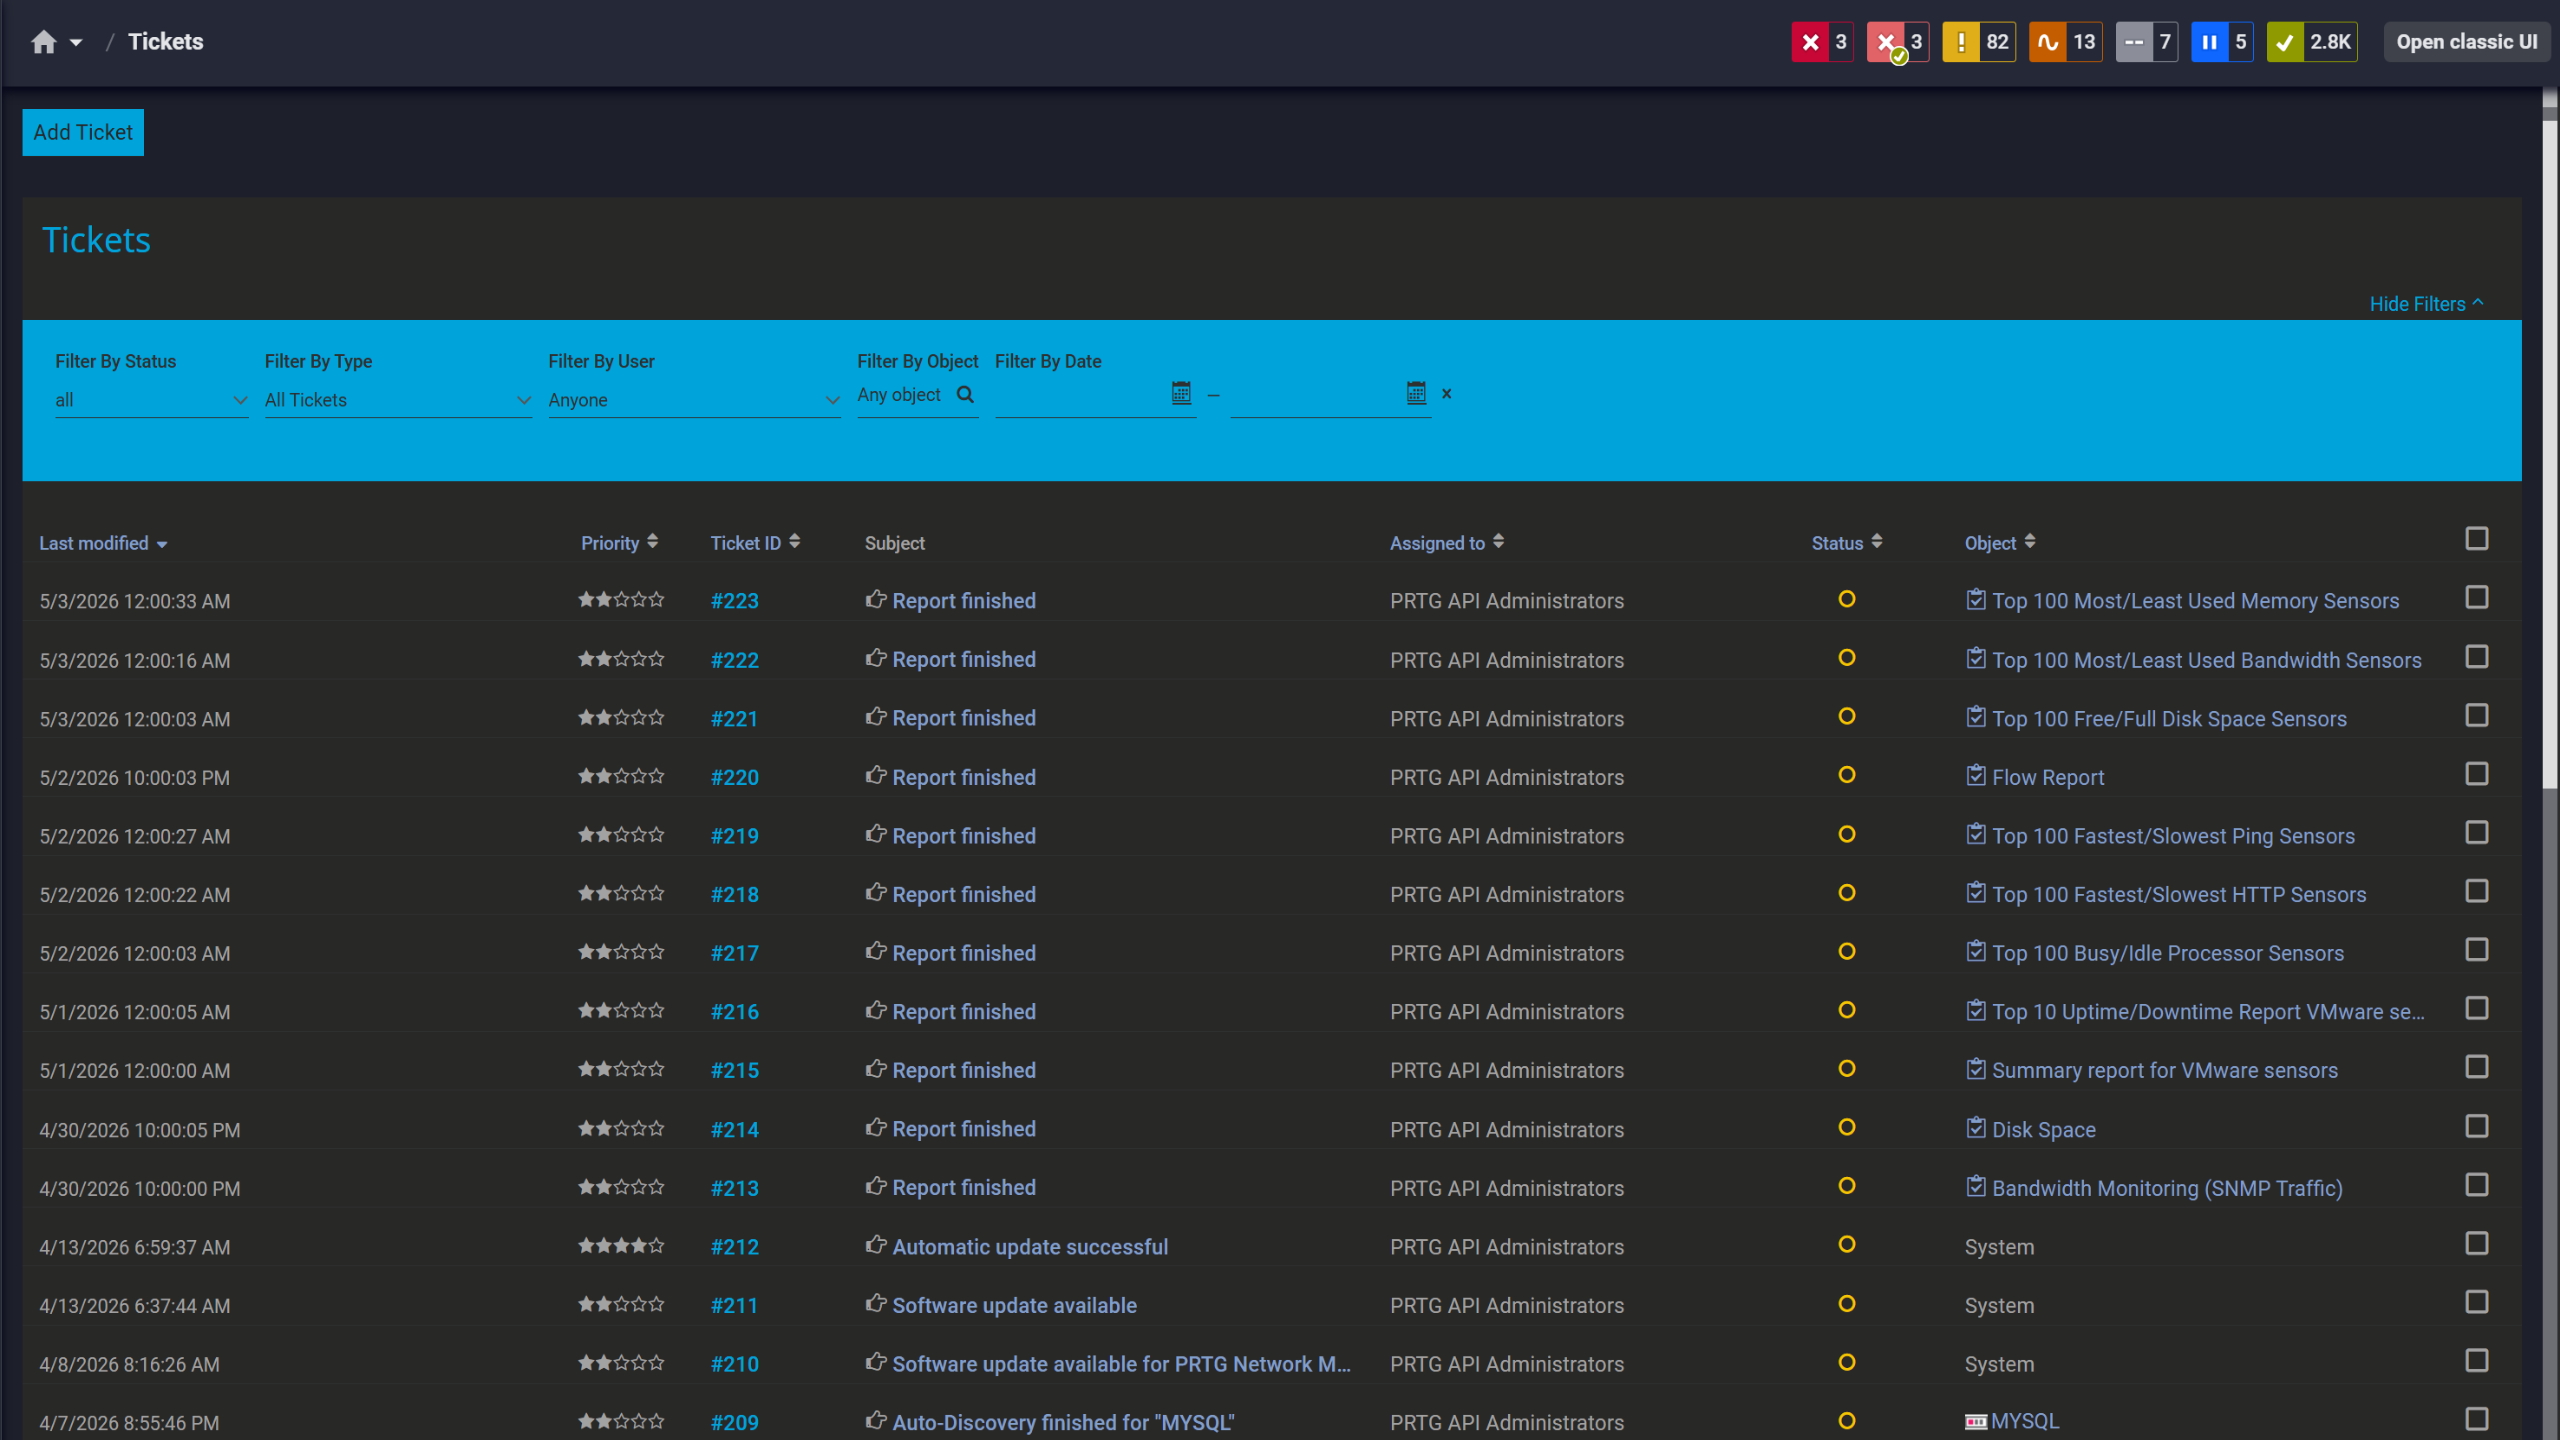
PRTG tickets list showing system notifications, report completions, and update alerts

Tickets keep your team aligned

PRTG web interface showing live performance graphs for a Probe Health sensor

Live graphs, real-time performance data

See Why IT Professionals Trust PRTG

Start monitoring your infrastructure in minutes. No professional services, no complex configuration, no risk.

Free download
PRODUCT OVERVIEW

Give Every Stakeholder the View They Actually Need

Engineers need sensor-level detail. Managers need process health at a glance. A single shared dashboard serves neither, and manual reporting produces performance data that's outdated before it's read.  

PRTG's map editor lets you build role-specific dashboards from the same live monitoring data. Engineers get full sensor detail and performance metrics. Managers get color-coded service health, visualization that supports informed decisions, risk management, and operational excellence across business goals. No duplication. No manual updates.
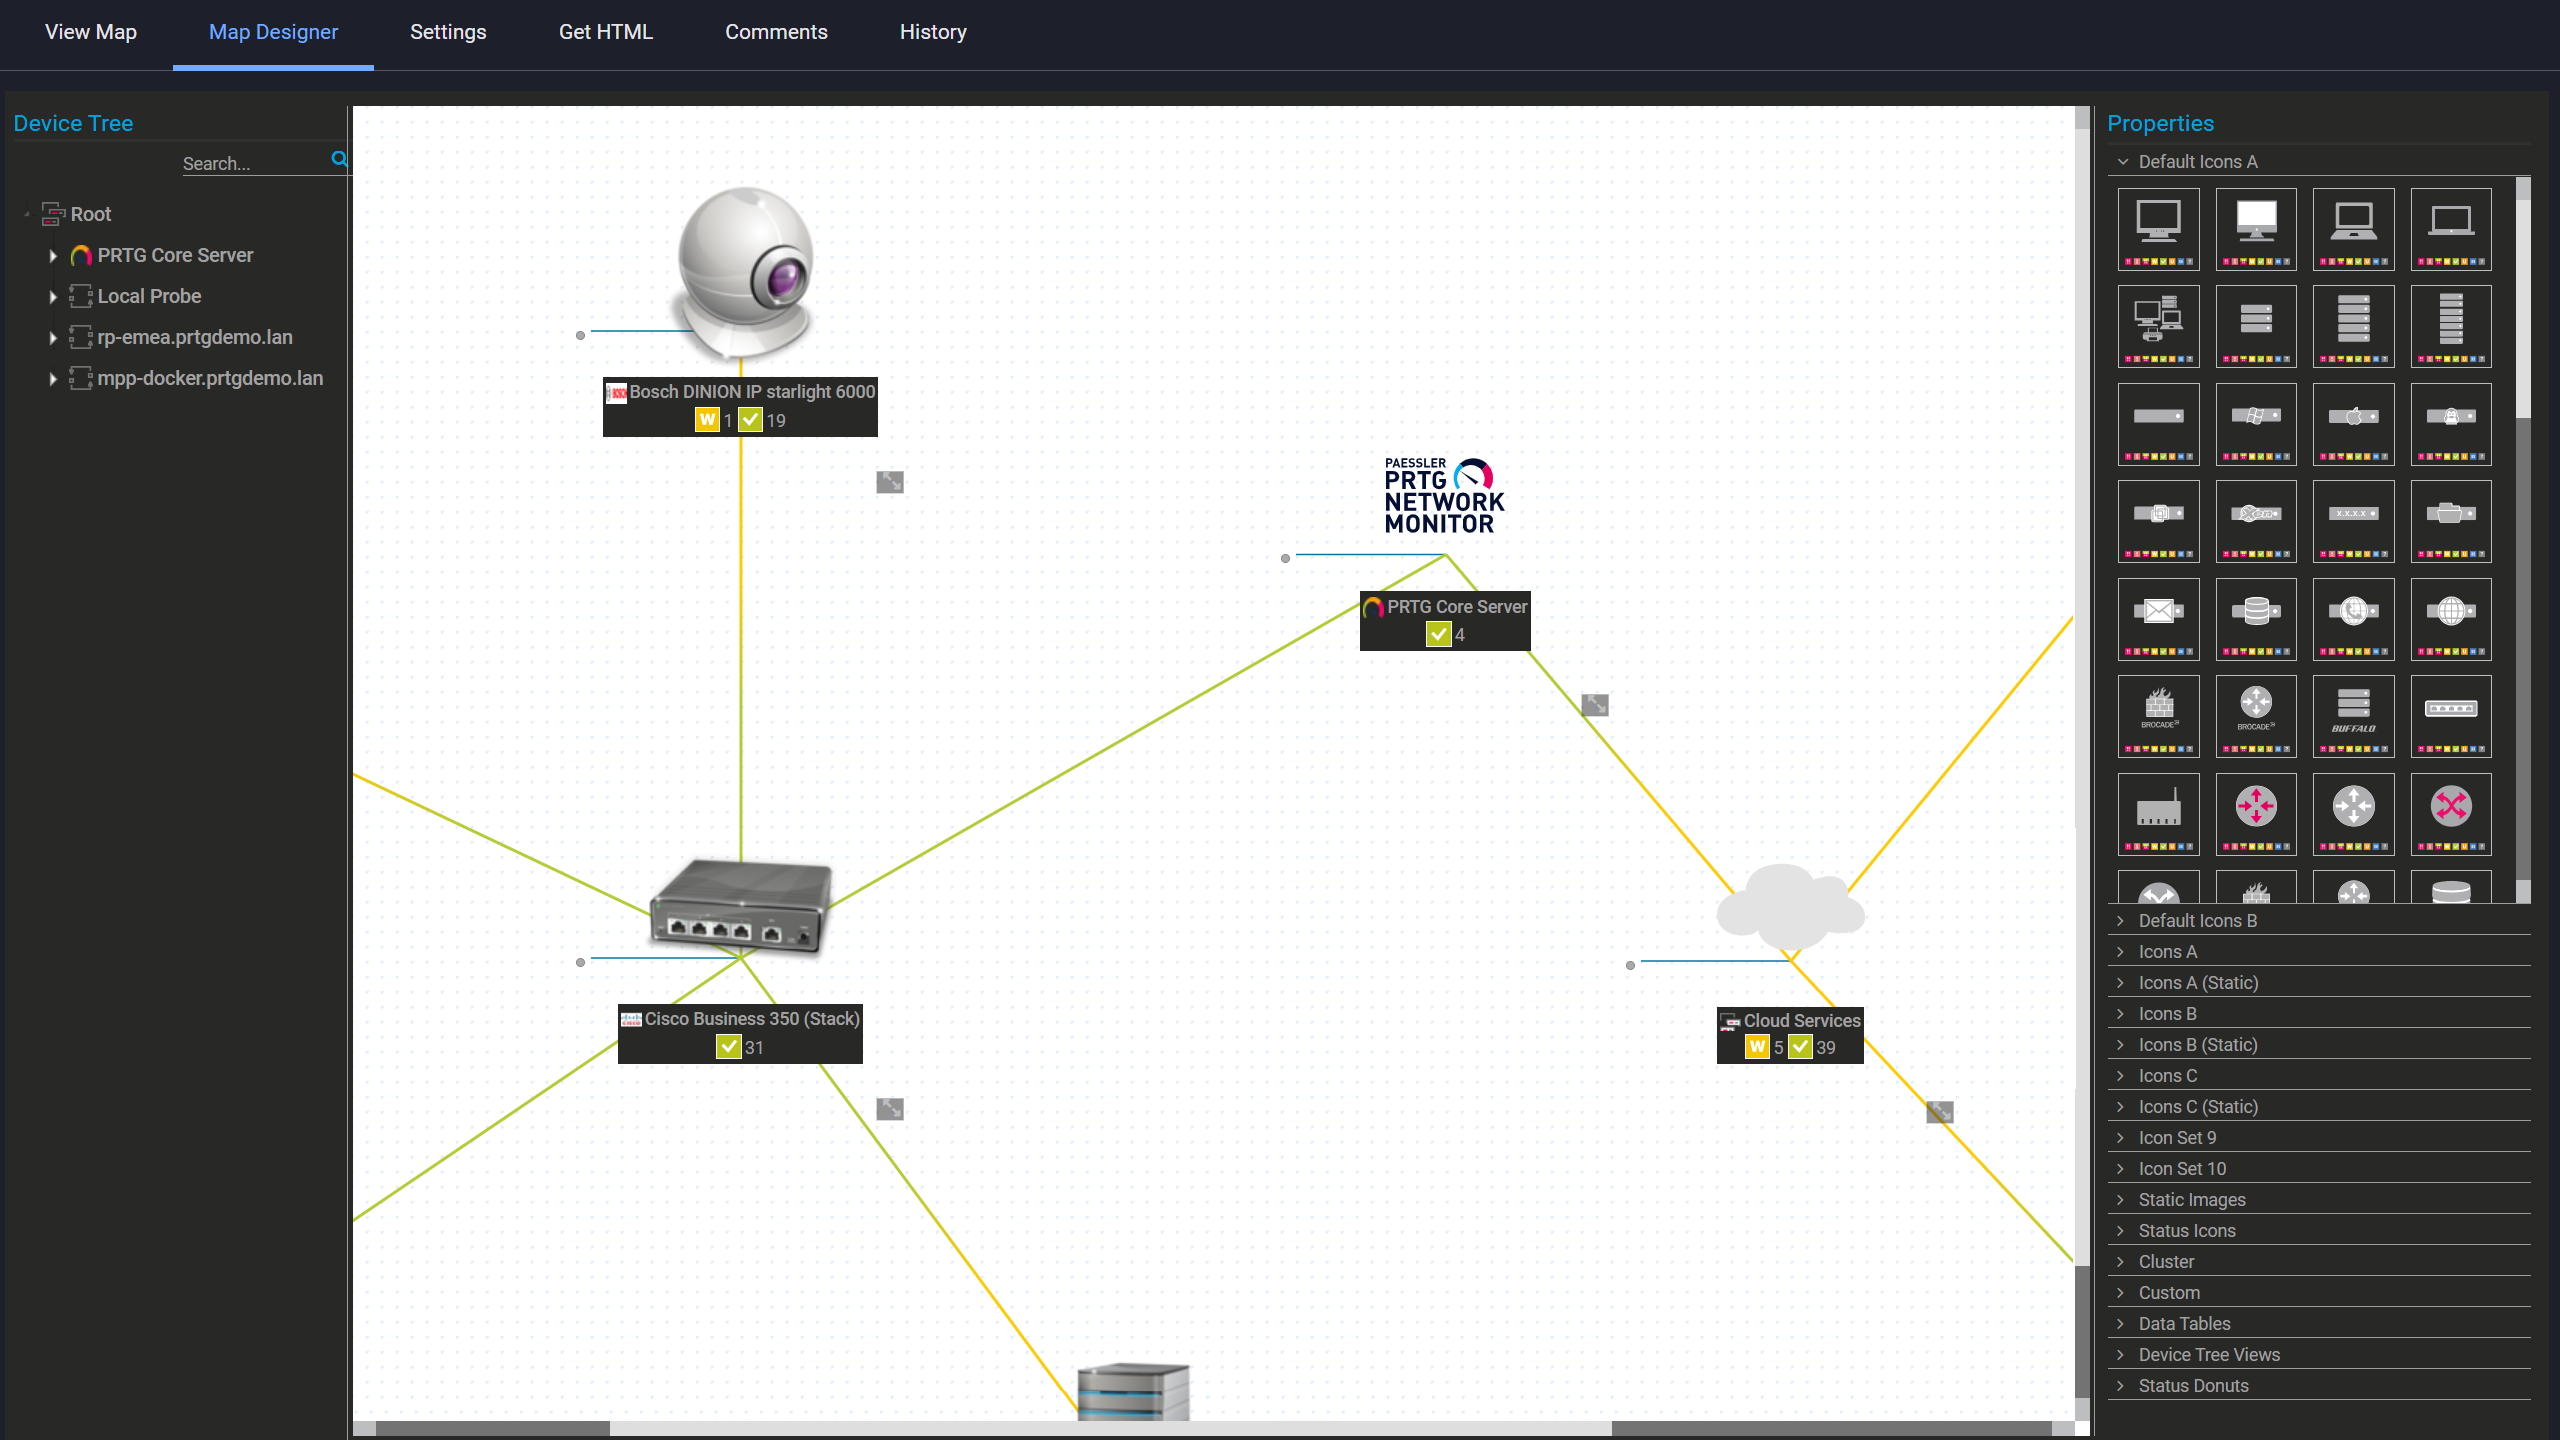
  • Map editor for building role-specific views and real-time service visualization
  • Color-coded service health maps: green, yellow, red at a glance
  • Shareable maps accessible to stakeholders via read-only user accounts
  • One monitoring setup, multiple audience-appropriate views aligned to your business goals
  • No manual reporting or status update preparation required
PRTG Map Designer showing a custom network map with live device status and vendor icons

Custom maps with live status

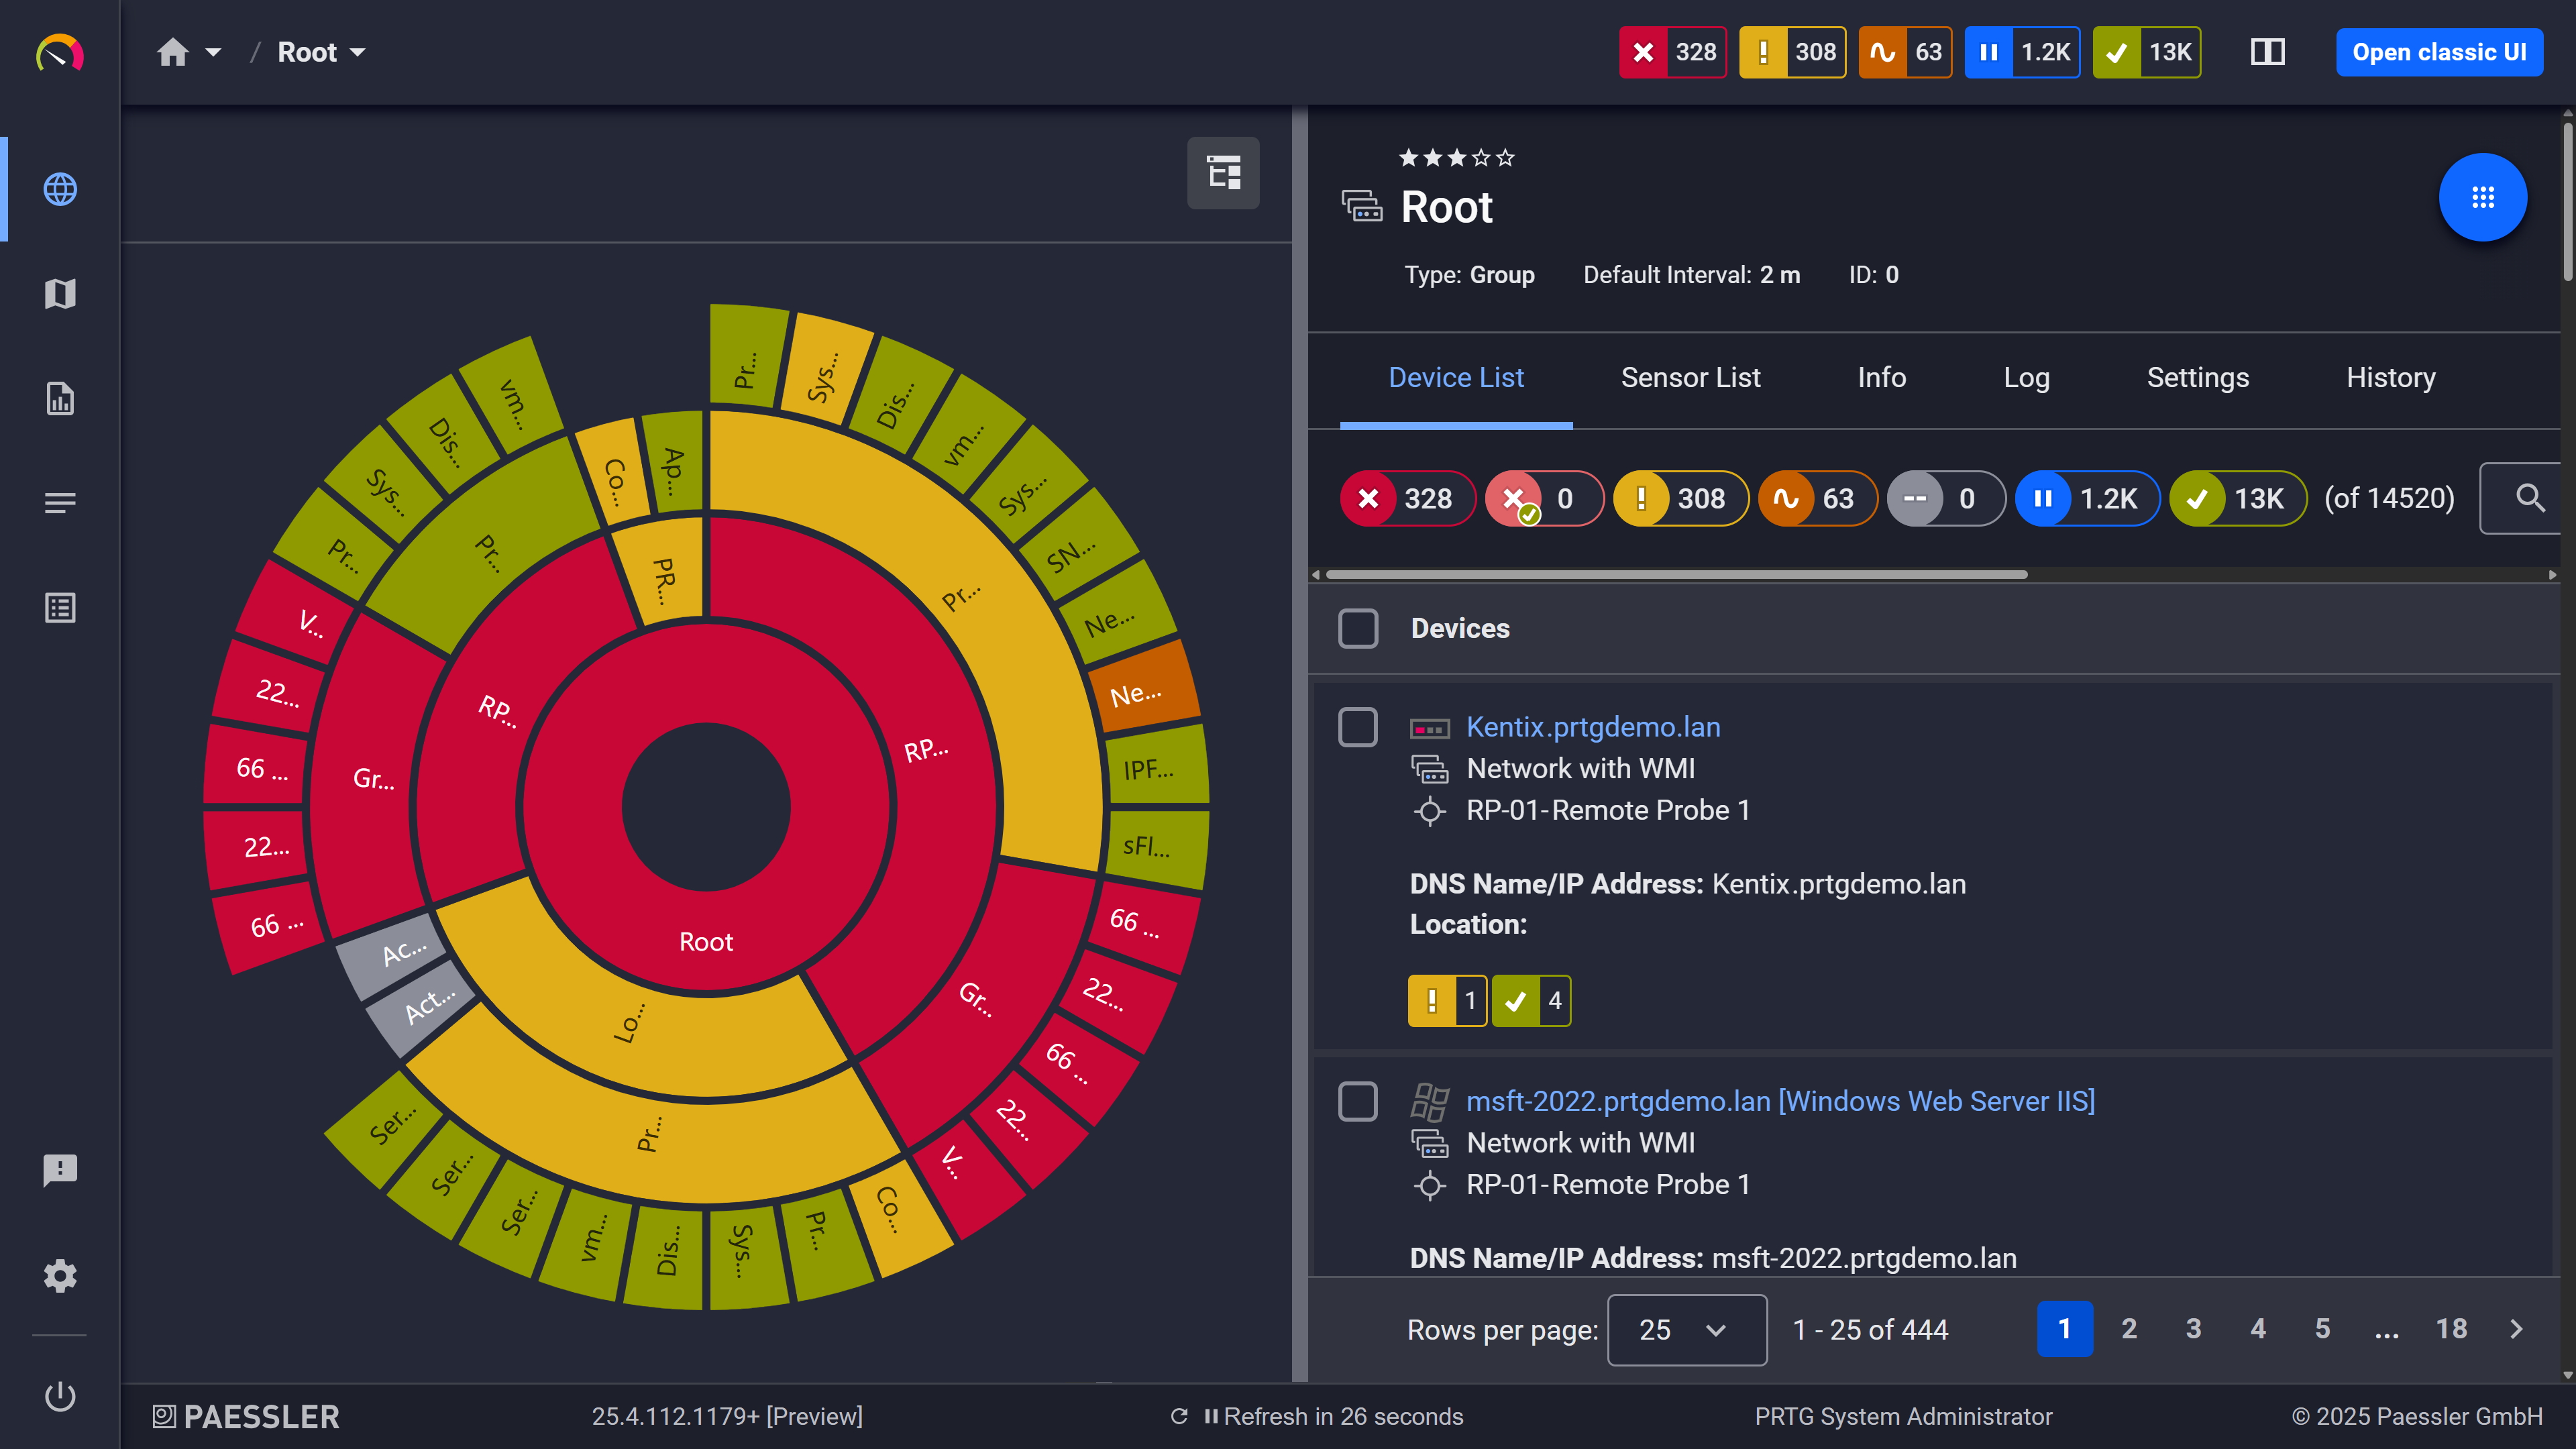
PRTG sunburst chart visualizing the full network hierarchy with color-coded sensor status

Your entire network, visualized instantly
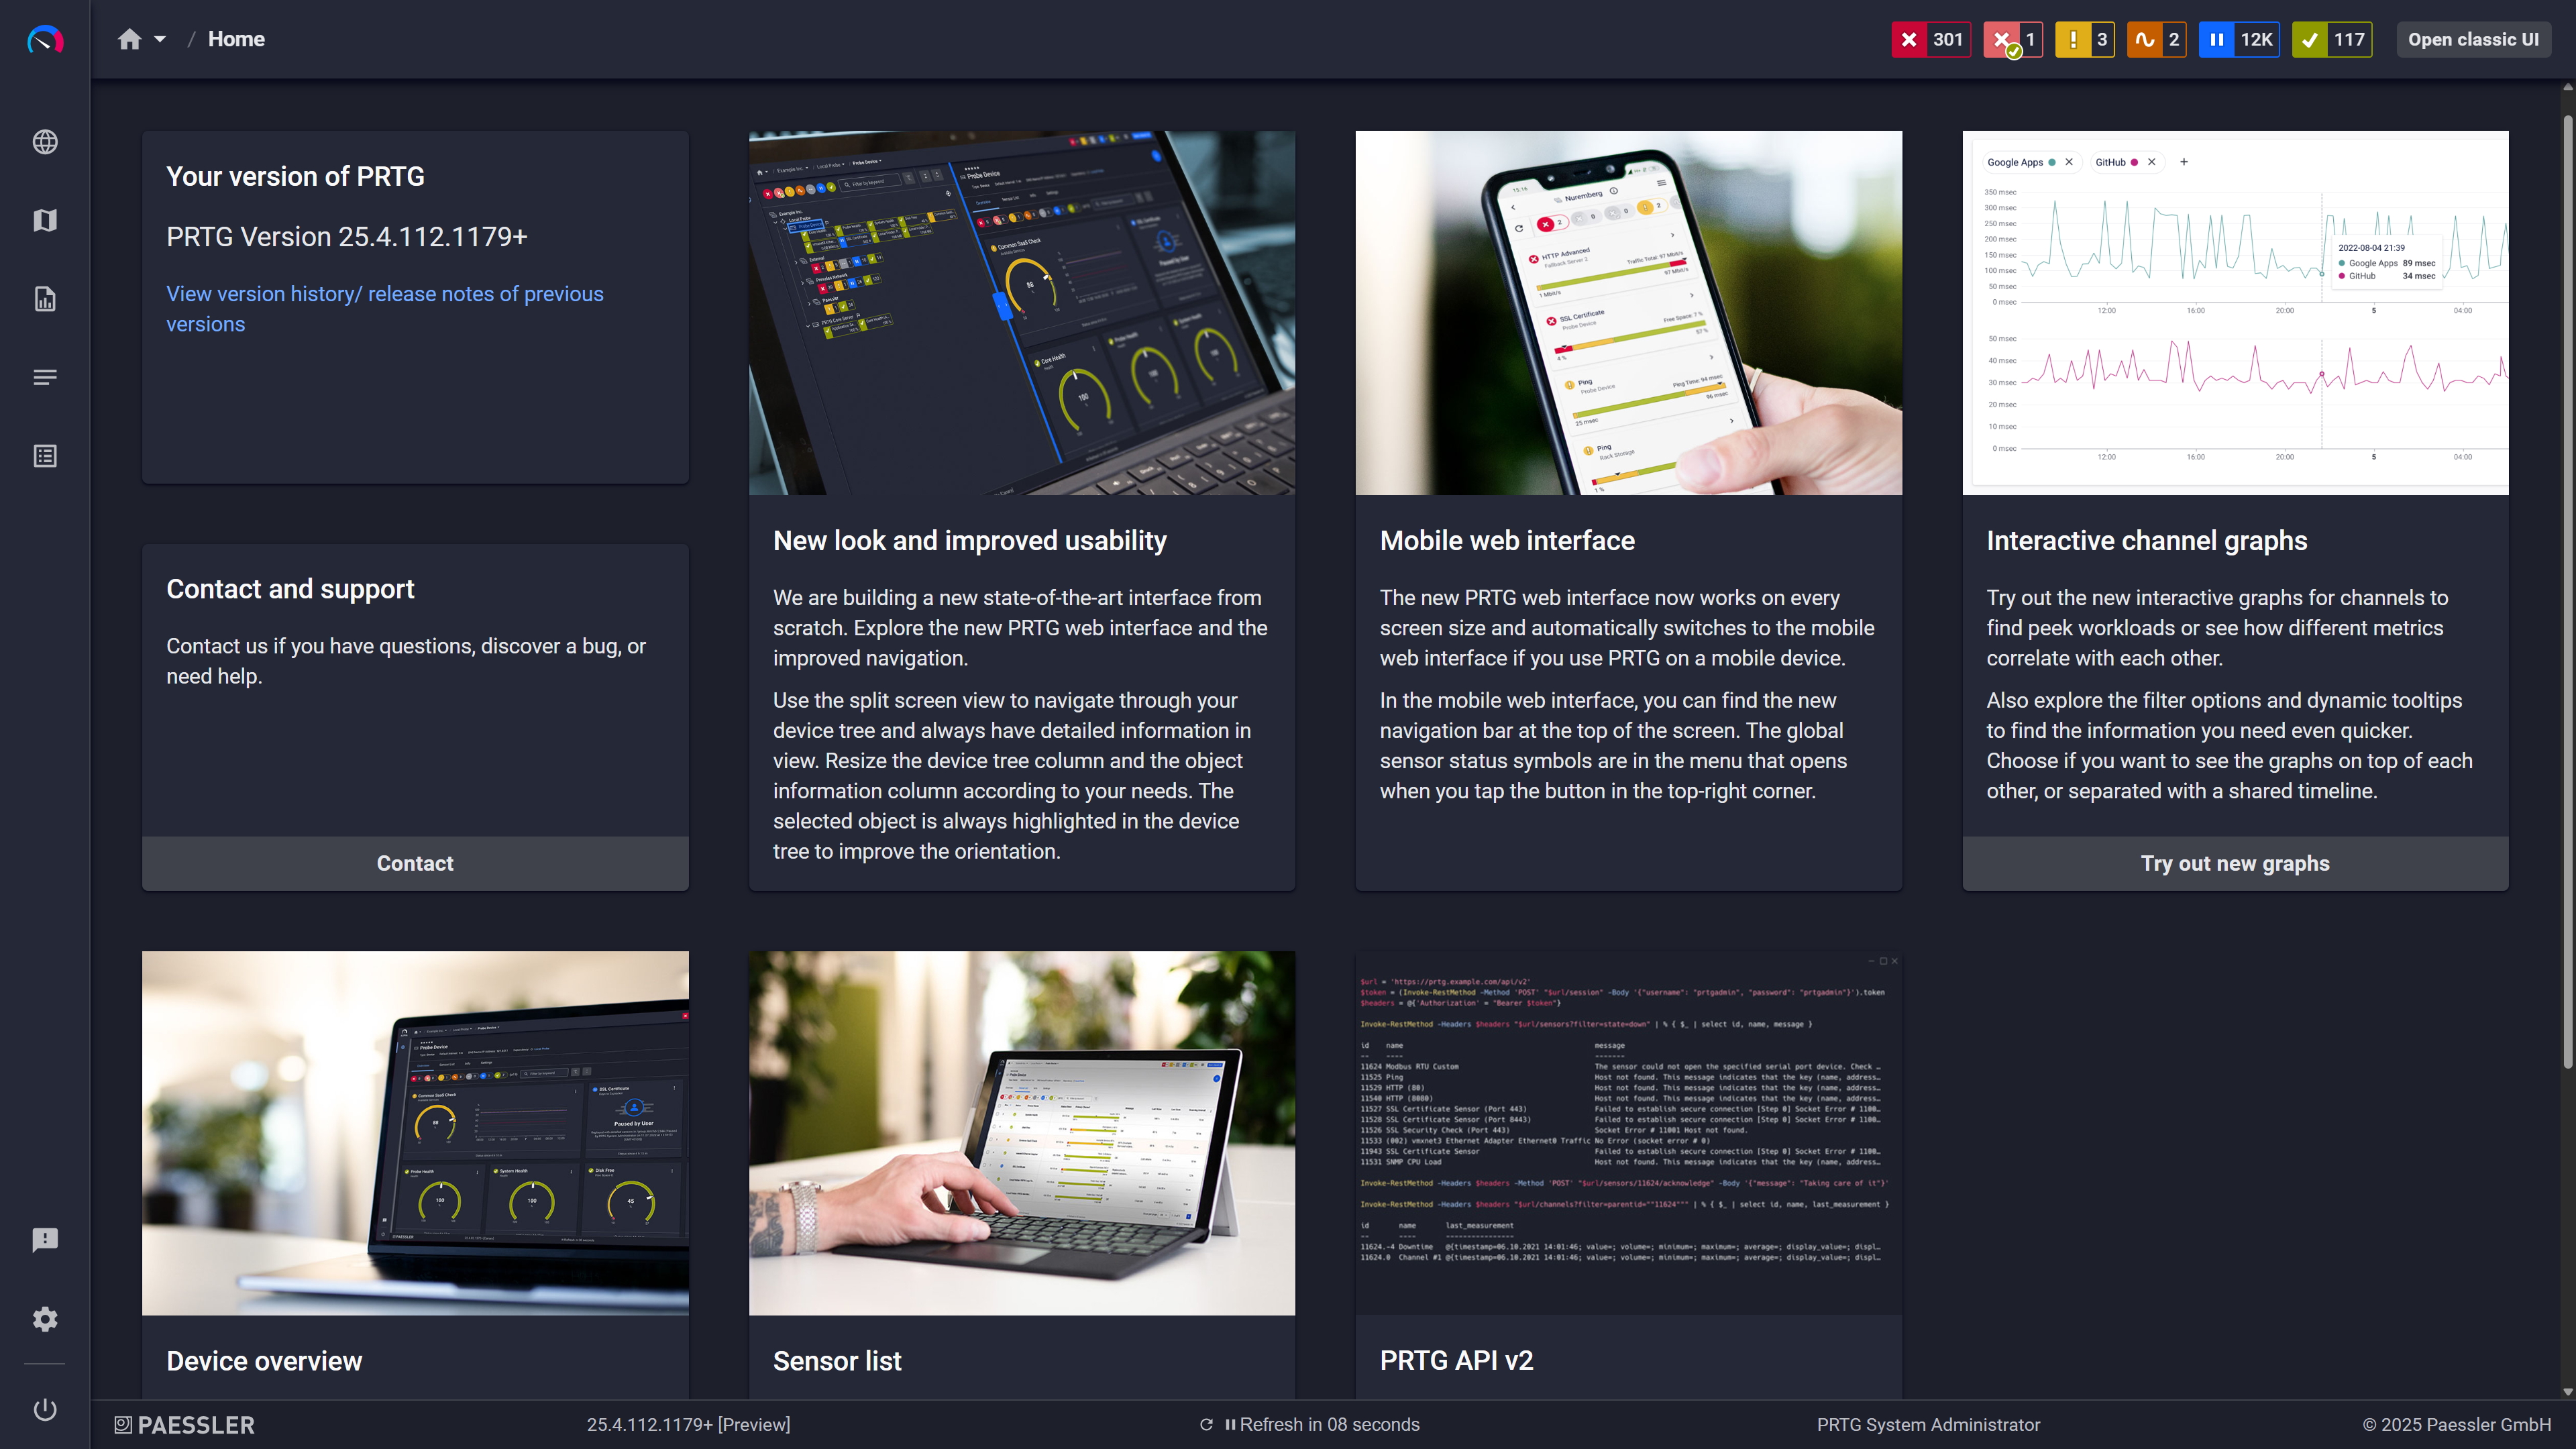
PRTG home screen showing feature highlight cards including mobile interface and API

Modern interface, everything within reach

Branch and Regional Teams: Get Local Service Visibility Without Reconfiguring Central IT

Branch teams often find out about problems the same way end users do: when something stops working. Delayed detection, inefficiencies in troubleshooting, resource utilization stretched thin across sites that aren't properly monitored.  

PRTG's remote probes runs local network scanning on-site. Monitoring traffic stays within the local network. The probe connects to the PRTG core server, on-premises or via PRTG Hosted Monitor, for centralized management, data storage, and alerting. Deploying a remote probe per site costs less than running a separate monitoring tool for each location, and everything is managed from the same central PRTG core. That's where the cost savings come from: consolidation, not complexity.

  • Remote probe performs local network scanning on-site, monitoring traffic stays local
  • Requires a PRTG core server (on-premises or PRTG Hosted Monitor) for centralized management
  • Fast to deploy at a branch or regional site without a company-wide rollout
  • Supports distributed, multi-site environments from a single PRTG core
  • Central IT doesn't need to reconfigure their existing setup to add a new site

How PRTG Monitors Business Processes

PRTG uses a sensor-based approach to data collection. Individual sensors gather performance data from devices, services, and endpoints, the core functions your business relies on. The Business Process sensor and Sensor Factory sensor aggregate that data into service-level views, with multiple channels per service reflecting the health of each component group.

Business Process Sensor

Select source sensors from anywhere in your PRTG setup and group them into channels. For each channel, define warning and error thresholds based on the percentage of source sensors in a degraded state. This sets your tolerance for error rates across each component group.  

PRTG maps each source sensor to a business process condition. "Up," "Warning," and "Down (Partial)" map to "up." A "Down" status maps to "down." The Global State channel always reflects the most severe status present. The sensor supports up to 50 channels, granular process performance visibility for complex service models, no additional tooling needed.

Sensor Factory Sensor

The Sensor Factory sensor applies formula-based logic instead of percentage thresholds. Write channel expressions using sensor IDs and define exactly which condition changes the sensor's status.  

Example: alert only if two or more of four specific components are simultaneously down. This keeps alert noise low and business outcomes in focus. Single-component failures don't automatically mark the entire service unavailable. Start with the Business Process sensor for most use cases, use Sensor Factory when you need more precise control.

Service Sensor Types

For web services: the HTTP Full Web Page sensor measures full page load time including all assets, a direct timing and throughput metric for web service performance. The HTTP Transaction sensor monitors multi-step flows like logins and checkout processes. The Cloud Ping v2 sensor checks availability from locations across four continents.  

For remote access: the RDP sensor tracks protocol availability and response time. For infrastructure: the SNMP Hardware Status sensor covers server hardware health. The SNMP Cisco ASA VPN Connections sensor tracks VPN availability and connection counts. All feed directly into Business Process or Sensor Factory sensors, the foundation for your service-level performance metrics.

Alerts and Notifications

When a Business Process sensor changes state, PRTG triggers the notification workflows you've configured, without manual intervention and no automation gap between detection and response. Email and push notifications via the iOS and Android app work out of the box. HTTP actions (webhooks) and REST API calls route alerts into external systems. Notification schedules control timing and recipients. Escalation rules engage additional contacts if an alert isn't acknowledged within a defined window. Alert acknowledgment stops repeat notifications while the issue is being worked. SMS is supported but requires a third-party SMS gateway.

free downLoad

Business Process Monitoring: Manual Effort vs. PRTG

Task

Without PRTG

Without PRTG

With PRTG

With PRTG

Service health visibility

Without PRTG
not included

Check each component separately to assess overall service health

With PRTG
included

Single service-level sensor shows aggregated status across all monitored dependencies in real time

Issue detection

Without PRTG
not included

Users report the problem before IT knows it exists

With PRTG
included

Threshold-based alerting fires when a service condition degrades, enabling corrective action before full failure

Status reporting

Without PRTG
not included

Manual status updates prepared for management

With PRTG
included

Shareable dashboards update automatically with live monitoring data

Cause Analysis

Without PRTG
not included

Cause investigation requires cross-referencing multiple tools. A slow and inefficient task

With PRTG
included

See which service component group is degraded and navigate directly to the relevant sensors in PRTG

Remote/branch site monitoring

Without PRTG
not included

No monitoring at remote/branch sites without a company-wide rollout

With PRTG
included

Streamline monitoring across distributed sites with a remote probe: fast to deploy, no central IT reconfiguration

free downLoad

”Adopting PRTG has been like going from being in the dark to being in the light. Before, we had limited visibility into what was happening in the infrastructure and in the network. Now, however, thanks to the comprehensive dashboard and real-time notifications, we receive constant updates on the status of facilities and services, and our way of working has gone from passive to proactive.”

Luca Meneghesso, Senior IT infrastructure and Security Specialist
Banca Profilo

”GESAC increasingly focuses on innovation to improve the quality of services offered and the experience of passengers handled every day by Naples Airport. Thanks to PRTG, we finally have unified, automatic, and continuous monitoring of the airport network and can guarantee quick and timely interventions.”

Domenico Ciervo, GESAC ICT Manager
Naples International Airport

”As an international company, PRTG is ideal for us. If something went down half way across the world, we wouldn’t be woken up – we can rely on PRTG to identify the problem and alert us before it occurs – enabling the right person, in the right time zone to resolve the problem. At the end of the day, if we’re to provide an internal network experience for our employees that meets expectations, we need a tool like PRTG to be successful.”

Barry Kelly, Systems Engineer
Skyscanner

Paessler PRTG Network Monitor licenses & pricing

Choose the PRTG Network Monitor subscription that's best for you.

License NameLicense descriptionPriceLicense DetailsGet startedPricing Details
PRTG 500$200per month paid annuallyBuy nowBuy now

Enough to monitor multiple aspects of 50 devices

PRTG 1000$358per month paid annuallyBuy nowBuy now

Enough to monitor multiple aspects of 100 devices

PRTG 2500$742per month paid annuallyBuy nowBuy now

Enough to monitor multiple aspects of 250 devices

PRTG 5000$1,300per month paid annuallyBuy nowBuy now

Enough to monitor multiple aspects of 500 devices

PRTG 10000$1,642per month paid annuallyBuy nowBuy now

Enough to monitor multiple aspects of 1000 devices

Over 100,000 Customers Worldwide Love Paessler  

customer success stories

 Business Process Monitoring with PRTG: Frequently Asked Questions


What is the Business Process sensor in PRTG and how does it work?

The Business Process sensor creates a single sensor reflecting the combined process health of multiple components. Select source sensors, group them into channels, and set warning and error thresholds based on what percentage of source sensors are degraded. PRTG maps each sensor's status to a business process condition, up or down. The Global State channel always shows the most severe status across all channels. One sensor. Clear service health. Full component detail underneath.

What happens when one component of a monitored service fails?

PRTG evaluates the affected channel against your defined thresholds. If the percentage of sensors in a down condition exceeds your error threshold, the channel’s state changes to down, which propagates to the Global State channel. Your configured notifications fire immediately. Individual source sensors remain accessible, so you can navigate directly to the failing component, investigate, and take corrective action from there.

Can I monitor cloud-hosted and on-premises components in the same service monitor?

Yes. The Business Process sensor pulls from existing source sensors regardless of where the underlying component is hosted. An on-premises VPN server, a cloud-hosted endpoint monitored via HTTP, and a local database can all be part of the same service model. This works whether you're running a stable on-premises environment or hybrid infrastructure during a digital transformation period. The sensor works with whatever the source sensors are measuring.

What's the difference between the Business Process sensor and the Sensor Factory sensor?

Both aggregate performance data from source sensors into a combined service view. The Business Process sensor uses percentage-based thresholds: define what share of source sensors in a channel must be down to trigger a warning or error. The Sensor Factory sensor uses formulas: write a channel expression using sensor IDs and define the exact condition that changes the sensor's status.  

Start with the Business Process sensor for straightforward service aggregation. Use the Sensor Factory sensor when you need conditional logic, for example, "alert only if two specific high-priority components are both down simultaneously."

Does PRTG integrate with ticketing or ITSM tools for automated incident creation?

Not natively. PRTG doesn't have built-in integrations with specific ITSM platforms. When an alert fires, PRTG can trigger an HTTP action, a webhook call to an external URL. Most ITSM tools accept incoming webhooks and can create incidents automatically from them. Setup requires configuring a webhook receiver on the ITSM side and an HTTP notification action in PRTG with the correct endpoint and payload. It works reliably, but requires configuration on both ends.

How long does it take to set up business process monitoring in PRTG?

If sensors are already running for the components you want to group, typical for existing PRTG users, setting up a Business Process sensor takes minutes. PRTG also includes device templates for common infrastructure components, which speeds up the initial data collection setup if you're starting from scratch. Select source sensors, define channels, set thresholds. Done.  

The planning takes longer: deciding which components belong to which service, what thresholds make sense, and how alerting should behave. More complex Sensor Factory configurations take longer than a straightforward Business Process sensor setup. Either way, the performance data from day one supports process improvement decisions, in how you define service models and how quickly you respond when they surface an issue. This is a good way to implement continuous improvement.

Paessler PRTG

Paessler PRTG

Network Monitoring Software – Version 26.1.116.1532 (February 9th, 2026)

Hosting icon

Hosting

Download for Windows and cloud-based version PRTG Hosted Monitor available

Languages icon

Languages

English, German, Spanish, French, Portuguese, Dutch, Russian, Japanese, and Simplified Chinese

test

Monitor everything

Network devices, bandwidth, servers, applications, virtual environments, remote systems, IoT, and more

test

Pricing

Choose the PRTG Network Monitor subscription that's best for you

Discover more monitoring insights and stories

Content illustration

Powerful stories from the monitoring world

  • Video: Business Process Sensor - Paessler
  • Monitoring Business Processes: Transformation of Technical ...
  • Business Process Sensor: IT Overview 2.0 - Paessler Blog
Support illustration

Resources to master your monitoring challenges

  • PRTG Manual: Business Process Sensor - Paessler
  • How can I use the Business Process sensor for my website back end?
  • How does the Business Process sensor calculate summarized ...
Solution illustration

Solutions for all your monitoring needs

  • Business Process Monitoring
  • Enterprise Network Monitoring
  • IT Operations Analyzer
PRTG Logo

Start Monitoring with PRTG and see how it can make your network more reliable and your job easier.

Free download
PRODUCT OVERVIEW

Products

  • Paessler PRTG
    Paessler PRTGMonitor your whole IT infrastructure
    • PRTG Network Monitor
    • PRTG Enterprise Monitor
    • PRTG Hosted Monitor
    • PRTG UVexplorer
    • PRTG extensions
      Extensions for Paessler PRTGExtend your monitoring to a new level
  • Icon Features
    FeaturesExplore all monitoring features

Monitoring with PRTG

  • Network monitoring
  • Bandwidth monitoring
  • SNMP monitoring
  • Network mapping
  • Wi-Fi monitoring
  • Server monitoring
  • Network traffic analyzer
  • NetFlow monitoring
  • Syslog server

Useful Links

  • PRTG Manual
  • Knowledge Base
  • Customer Success Stories
  • About Paessler
  • Subscribe to newsletter
  • PRTG Support
  • PRTG Consulting
  • PRTG Feedback & Roadmap

Contact

Paessler GmbH
Thurn-und-Taxis-Str. 14, 
90411 Nuremberg 
Germany

[email protected]

+49 911 93775-0

  • Contact us
©2026 Paessler GmbHTerms & ConditionsPrivacy PolicyImprintReport VulnerabilityDownload & InstallSitemap
How to run an auto-discovery in PRTG in 5 steps How to run an auto-discovery in PRTG in 5 steps How to run an auto-discovery in PRTG in 5 steps