• Company
    • About Us
    • Case Studies
    • Press Center
    • Careers
    • Blog
    • Contact us
  • Contact us
  • Login
 
  • English
    • Deutsch
    • Español
    • Français
    • Italiano
    • Português
Paessler
                    - The Monitoring Experts
  • Products
    • Paessler PRTG
      Paessler PRTGMonitor your whole IT infrastructure
      • PRTG Network Monitor
      • PRTG Enterprise Monitor
      • PRTG Hosted Monitor
      • PRTG UVexplorer
      • PRTG extensionsExtensions for Paessler PRTGExtend your monitoring to a new level
    • Icon Features
      FeaturesExplore all monitoring features
      • Maps & dashboards
      • Alerts & notifications
      • Multiple user interfaces
      • Distributed monitoring
      • Customizable reporting
  • Solutions
    • Industries
      IndustriesMonitor various industry sectors
      • Industrial
      • Healthcare
      • Data Center
      • Education
      • Finance
      • Government
    • IT Topics
      IT TopicsMonitor all areas of IT
      • Network Monitoring
      • Bandwidth Monitoring
      • SNMP Monitor
      • Network Mapping
      • WiFi Monitoring
      • Server Monitoring
  • Pricing
  • Resources
    • Getting Started
      Getting StartedModules for self-paced learning
    • How-to Guides
      How-to GuidesGet the most out of PRTG
    • Videos & Webinars
      Videos & WebinarsLearn from Paessler experts
    • IT  Knowledge
      IT KnowledgeExpand your IT knowledge
    • PRTG Manual
      PRTG ManualFull documentation
    • Knowledge Base
      Knowledge BaseShare community knowledge
    • PRTG Sensor Hub
      PRTG Sensor HubGet sensors, scripts & templates
    • Trainings
      PRTG TrainingLearn how to work with PRTG
  • Partners
    • Icon Handshake
      Become a PartnerFor resellers and channel partners
    • Icon MSP
      Become an MSPDeliver monitoring as a managed service
    • icon partner
      Partner PortalLog in to your partner account
    • Deal Registration
      Deal RegistrationRegister your sales opportunities
    • icon search
      Find a PartnerFind partners selling Paessler products
    • icon technology
      Technology AlliancesSee Paessler technology partnerships
    • Partner HubTools for Your Success
  • Company
    • About Us
    • Case Studies
    • Press Center
    • Careers
    • Blog
    • Contact us
  • Contact us
  • Login
  • English
    • Deutsch
    • Español
    • Français
    • Italiano
    • Português
  • Get a quote
  • Free trial

Complete Cisco Monitoring

Monitor your entire Cisco infrastructure with purpose-built sensors and auto-discovery

Free download
PRODUCT OVERVIEW

What Does Cisco Network Monitoring Actually Cover? 

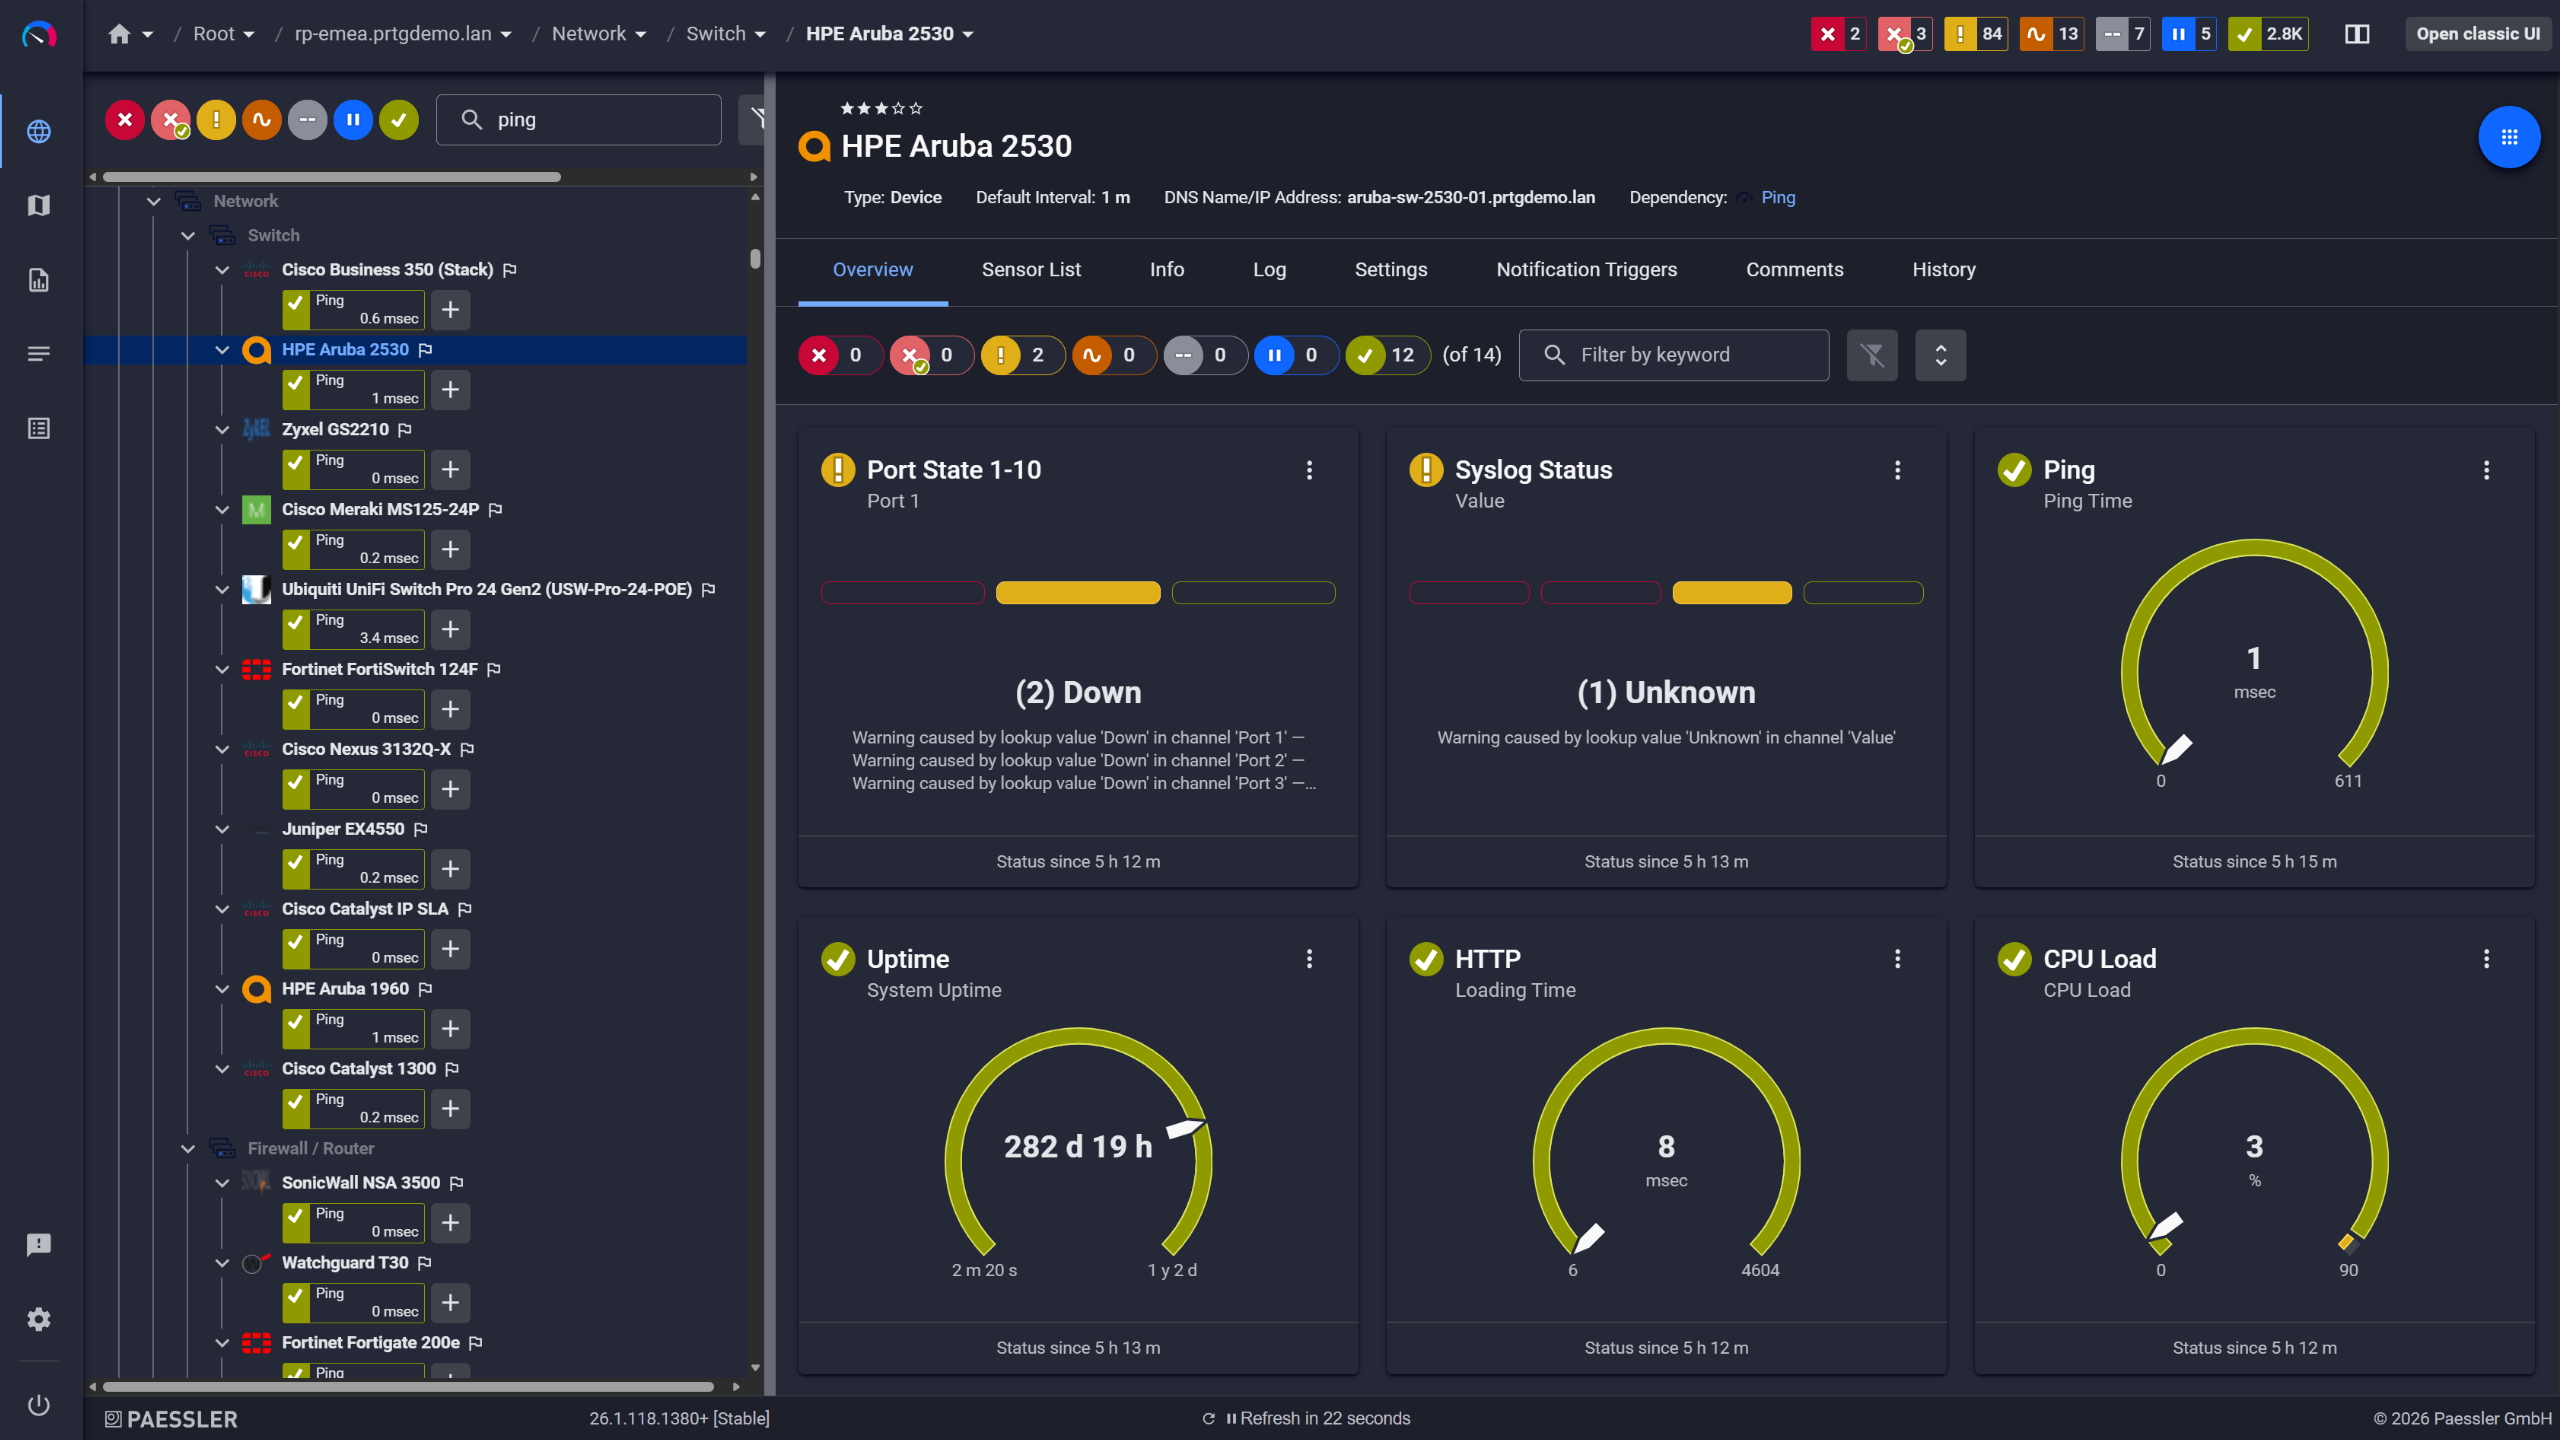
Cisco infrastructure spans a lot of ground: routers, switches, firewalls, access points, UCS servers, WAN links, VPN tunnels. Keeping visibility across all of it in a multi-site environment means tracking hardware health, bandwidth usage, VPN connectivity, and QoS performance at the same time. Most teams manage this across several tools, which works until something breaks and you need a fast answer.

PRTG uses SNMP, NetFlow, and dedicated Cisco sensors to pull that data into one dashboard. Auto-discovery handles device mapping without manual configuration, and historical trend data sits alongside real-time metrics so troubleshooting doesn't mean correlating exports from three different places. Supported Cisco technologies include Catalyst switches, Nexus switches, ASA firewalls, UCS servers, routers, access points, ACI, WAN modules, and IP SLA probes.

Download PRTG Trial

What you will find on this page

  • Experience Full Cisco Visibility
  • How PRTG Monitors Cisco
  • Cisco Monitoring: Manual vs. PRTG
  • FAQs

PRTG is compatible with all major vendors, products, and systems

compatible with all major vendors, products, and systems

What You Can Do With Full Cisco Visibility

Bandwidth Visibility Across your Cisco Infrastructure

Getting a complete bandwidth picture across every Cisco switch and router used to mean hours of CLI work. PRTG collects NetFlow data (v5, v9, IPFIX) from your Cisco routers and switches and gives you Top Talkers, Top Connections, and Top Protocols without logging into devices one by one. SNMP interface sensors run alongside that, tracking per-port utilization, interface errors, and packet loss continuously.

  • Identify bandwidth consumption by source IP, destination IP, application, and protocol with per-flow visibility
  • Track interface utilization as percentage of capacity, with alerts when ports approach saturation thresholds (e.g., 80%, 90%)
  • Monitor CRC errors, discards, collisions, and packet loss counters to detect physical layer or configuration issues
  • Configure NetFlow exports on Cisco devices; PRTG acts as the collector and aggregates data from multiple flow sources
  • For high-traffic environments, limit NetFlow sensors to approximately 50 per remote probe (actual limits depend on probe hardware and scanning intervals)

Continuous Hardware Health Monitoring Across Cisco Devices

Hardware health data gives you the lead time to act on your schedule rather than react to an outage. PRTG's SNMP Cisco System Health sensor monitors power supply status, fan RPM, CPU utilization, memory usage, and internal temperatures across Cisco devices. For data center environments, dedicated UCS sensors cover blade health, fabric interconnect status, and chassis conditions. Early warning means replacements happen during maintenance windows, not as emergency responses.

  • Receive alerts on PSU failures, fan speed drops below operational thresholds, and temperature excursions before hardware damage occurs
  • Track CPU and memory utilization trends to identify when devices approach resource limits (capacity planning and upgrade justification)
  • Monitor UCS blade server health, fabric interconnect uplink status, and chassis power/cooling across converged infrastructure
  • SNMP must be enabled on Cisco devices with appropriate community strings (v1/v2c) or user credentials (v3 recommended for security)
  • Historical performance data supports lifecycle management and helps justify hardware refresh cycles with concrete metrics
PRTG device overview for an HPE Aruba 2530 switch with port state, ping, and CPU sensors

Network switches monitored across vendors

PRTG Map Designer showing a custom network map with live device status and vendor icons

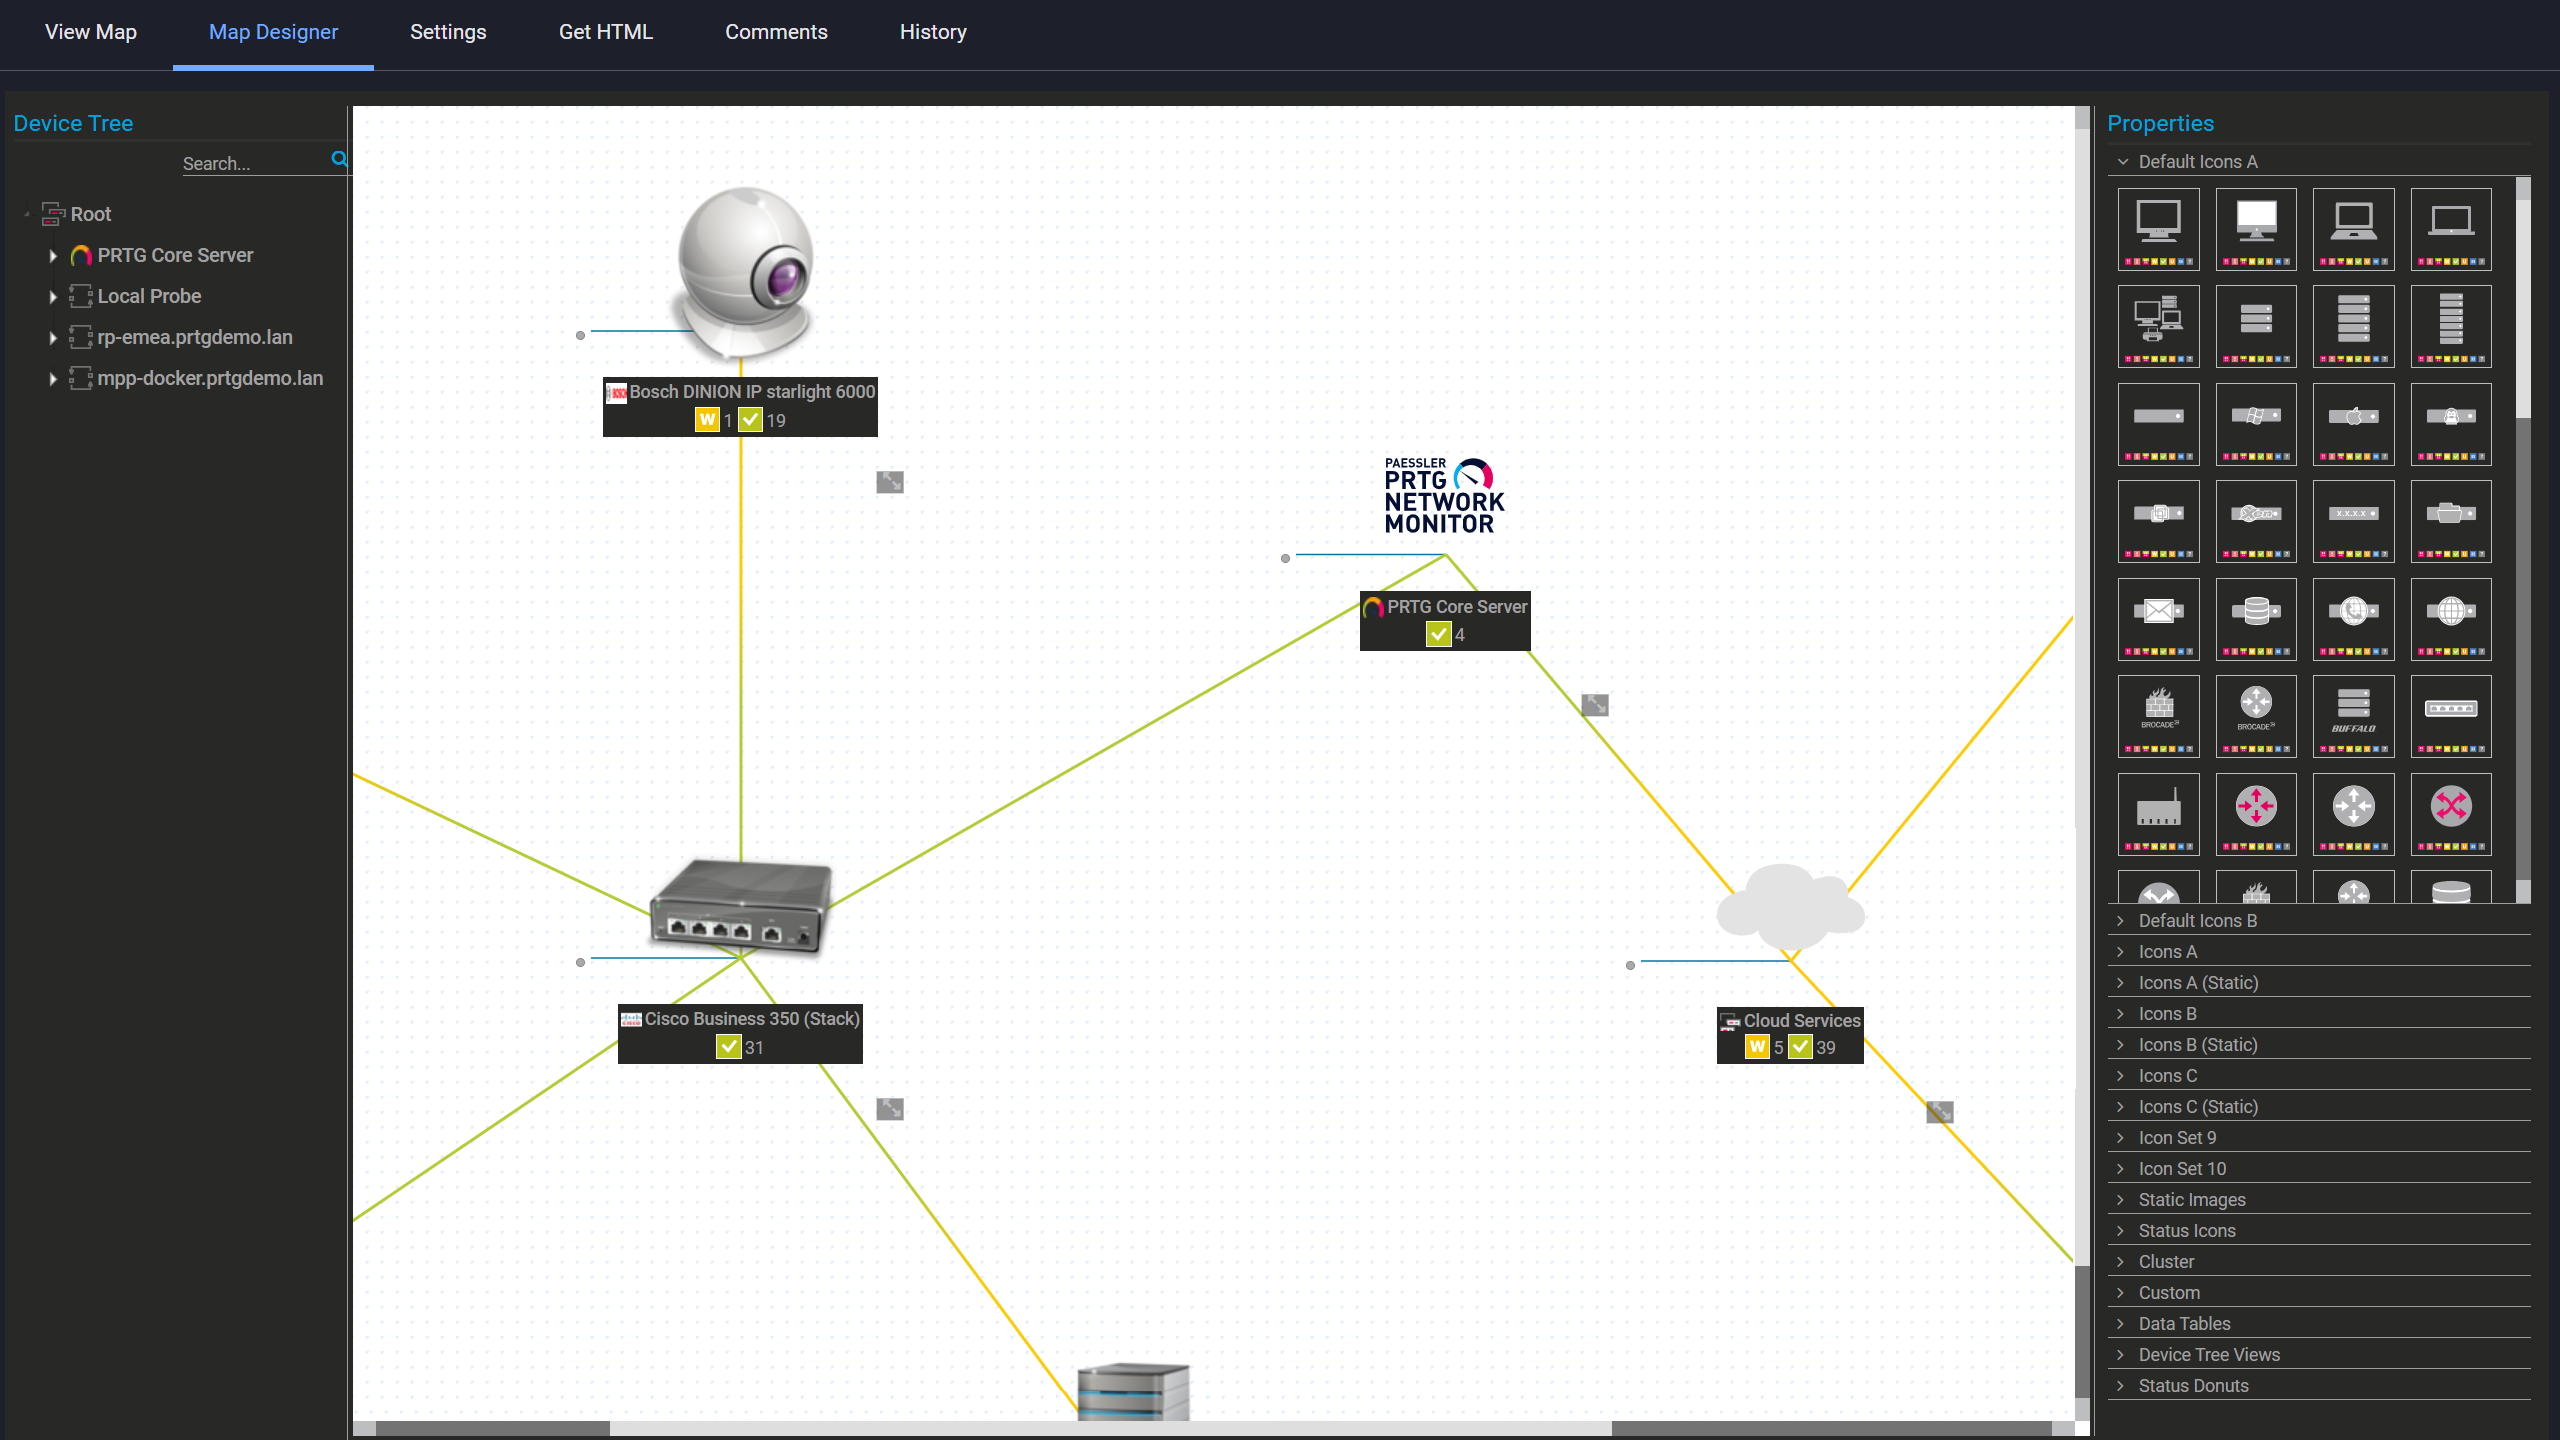
Custom maps with live status

PRTG web interface showing device tree and full device list with sensor status badges

Full device list, instant overview

Keep VPN Tunnels and Remote Access Stable 

Site-to-site tunnels drop intermittently. Remote workers report ASA connectivity issues. You have no visibility into how many active sessions are running or which tunnels are unstable until someone calls the helpdesk.

PRTG includes three dedicated SNMP sensors for Cisco ASA monitoring. SNMP Cisco ASA VPN Traffic Sensor covers bandwidth consumed by tunnels. SNMP Cisco ASA VPN Connections Sensor tracks active site-to-site and remote access sessions, and SNMP Cisco ASA VPN Users Sensor monitors concurrent connections so capacity constraints surface before they become complaints. Worth being clear: PRTG alerts on VPN metrics, it doesn't diagnose root causes. Routing issues, encryption mismatches, ISP problems still need logs and diagnostic tooling.

  • Monitor VPN tunnel bandwidth utilization (Mbps/Gbps) and detect saturation before remote users experience slowdowns
  • Track both IPsec site-to-site and SSL remote-access sessions with historical trending for capacity planning
  • Alert when concurrent user sessions approach ASA license limits or your configured capacity thresholds
  • Detect intermittent tunnel drops, connection flapping, and session anomalies before they escalate to the helpdesk
  • SNMP access to ASA firewalls required; root-cause diagnosis (routing failures, encryption mismatches, ISP issues) needs ASA logs and additional diagnostic tools

See Why IT Professionals Trust PRTG

Start monitoring your infrastructure in minutes. No professional services, no complex configuration, no risk.

Free download
PRODUCT OVERVIEW

Validate QoS Policies and Protect VoIP Quality 

QoS policies look correct in configuration. What matters is how they perform under real production load, and that requires continuous measurement. The SNMP Cisco CBQoS sensor monitors queue depth, dropped packets, and traffic shaping metrics so you can see exactly how policies behave when the network is busy. The Cisco IP SLA sensor tracks latency, jitter, packet loss, and MOS for voice quality validation using probes already configured on your routers. One thing to note: PRTG reads metrics from probes you set up. It doesn't create or manage IP SLA tests automatically.

  • Track queue depth, drop rates, and traffic shaping effectiveness per QoS class to validate policy performance under production load
  • Monitor round-trip latency (ms), jitter (ms), packet loss percentage, and Mean Opinion Score (MOS) for voice quality assessment
  • Alert when VoIP quality degrades below acceptable thresholds (e.g., MOS < 3.5, jitter > 30ms, packet loss > 1%)
  • IP SLA sensors require you to configure IP SLA probes/responders on Cisco devices first; PRTG collects and visualizes the results
  • Historical QoS data supports network optimization, troubleshooting performance complaints, and justifying WAN upgrades
PRTG Ping sensor graphs showing response time, min, max, and packet loss over time

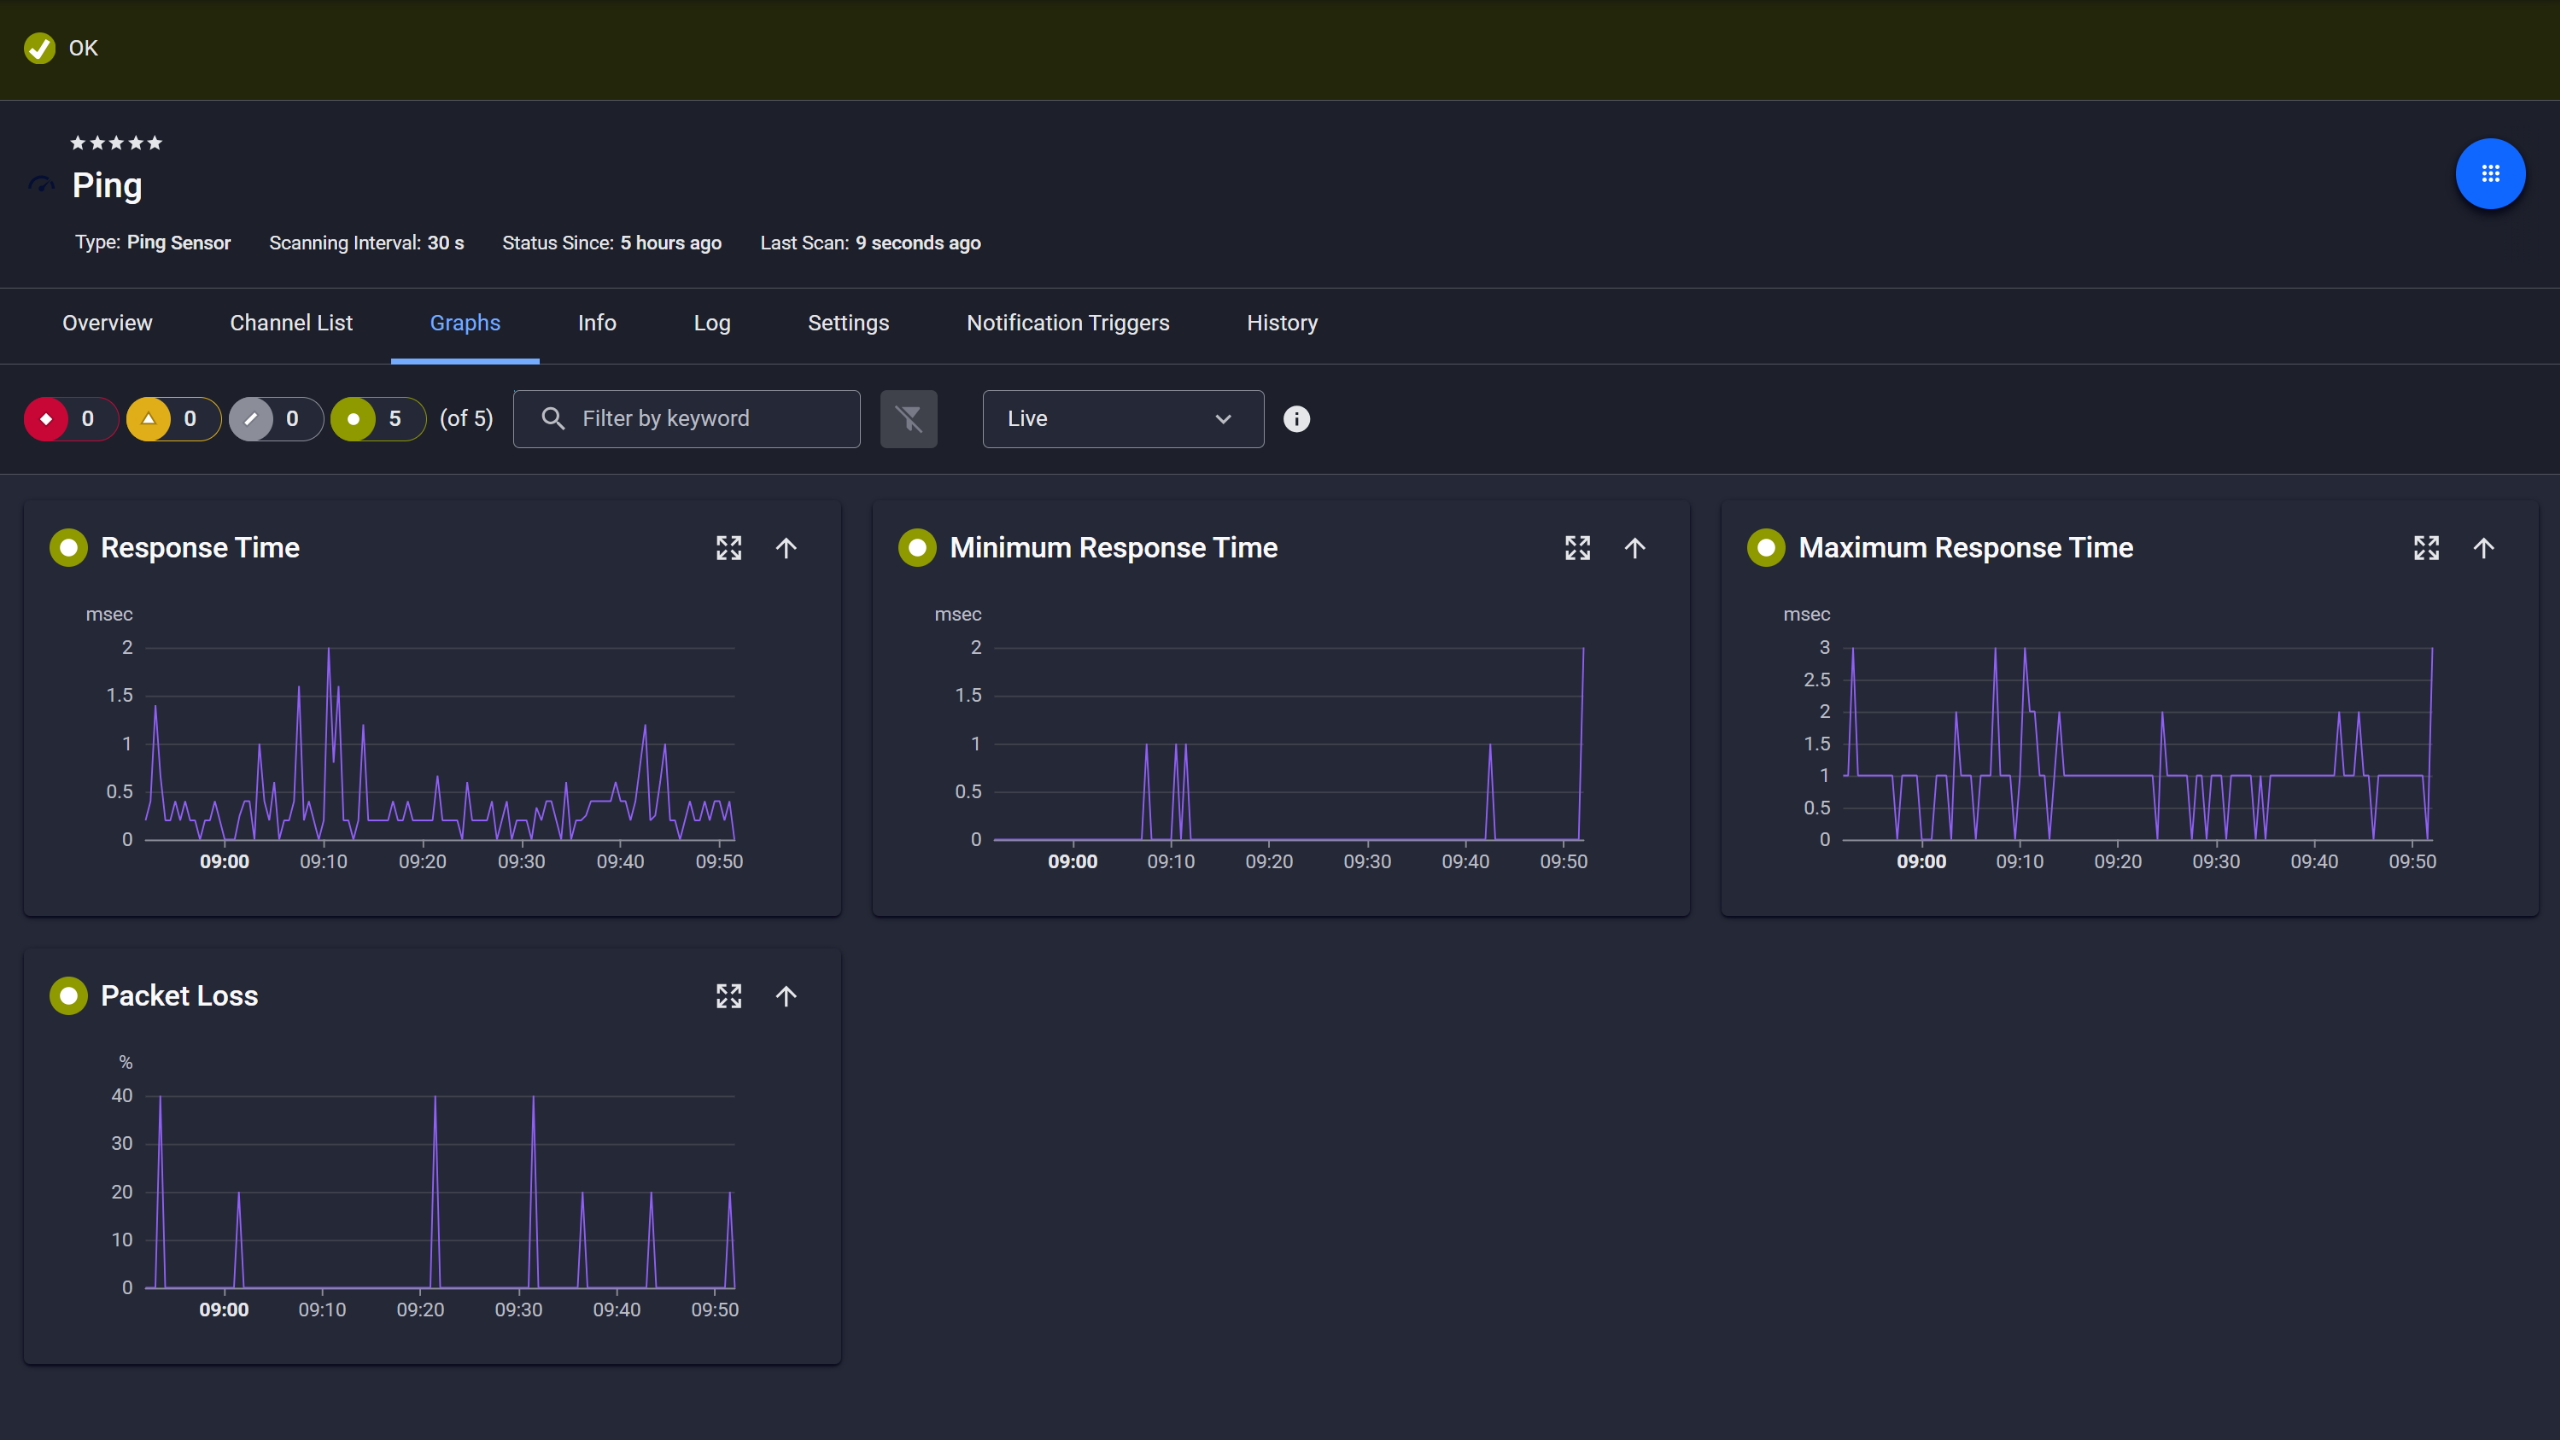
Ping response and packet loss

PRTG web interface showing live performance graphs for a Probe Health sensor

Live graphs, continuous performance data

PRTG reports list showing scheduled monitoring reports with run times and sensor counts

Scheduled reports, always on time

Unify Multi-Site and Multi-Vendor Monitoring 

Multiple branch offices, several data centers, cloud locations, and a mix of Cisco and third-party devices: PRTG brings all of it under one roof. Remote probes monitor distributed Cisco networks locally at each site and forward data to the core server. Auto-discovery finds Cisco switches, routers, access points, and firewalls, plus anything else that speaks SNMP or other standard protocols. Centralized dashboards and geo-maps give you a view across the whole environment without switching between tools.

  • Deploy Windows-based remote probes at each site to collect NetFlow, SNMP, and performance data locally, then forward aggregated metrics to the PRTG core server
  • Reduce WAN bandwidth consumption by processing monitoring data at the edge; probes continue monitoring even if WAN links fail
  • Auto-discovery scans IP ranges and detects Cisco devices plus multi-vendor equipment (SNMP, WMI, HTTP, ICMP support across thousands of device types)
  • Centralized dashboards, geo-maps, and alerting unify visibility across distributed sites without maintaining separate tools per location
  • Scales to thousands of devices across enterprise networks and service provider environments; clustering available for high availability and load distribution

How PRTG Monitors Cisco

PRTG monitors Cisco network infrastructure using industry-standard protocols and purpose-built sensors. No scripting, no custom development. Routers, switches, firewalls, access points, UCS servers. Network administrators get immediate visibility without building anything from scratch. Five core methods cover the full picture.

SNMP Device Monitoring

Simple Network Management Protocol is the foundation here. The SNMP Cisco System Health sensor handles the hardware side: power supply status, fan speed, CPU utilization, memory usage, internal temperature. Interface sensors watch individual ports for bandwidth, errors, and connectivity. Together that's continuous visibility across your Cisco routers, switches, firewalls, and access points.

SNMP v1, v2c, and v3 are all supported. Enable SNMP on your devices, configure community strings or user credentials depending on the version and auto-discovery handles sensor creation. If security posture matters on your network, v3 is the one worth using. Encrypted, credential-based, and less exposed than v2c in most environments.

NetFlow Traffic Analysis

PRTG supports NetFlow v5, v9, and IPFIX. Configure your Cisco devices to export flow data and you get Top Talkers, Top Connections, Top Protocols across the network. Which IP addresses are consuming bandwidth, which sessions are active, which applications are dominating network traffic. That's the information you actually need when something's slow and nobody knows why.

Flow monitoring is resource-intensive and that's worth planning around. Keep NetFlow sensors to roughly 50 per probe. Beyond that, the monitoring itself starts to feel the load. Remote probes help in high-traffic environments. Point the collector at the probe rather than the core server and sensors are created automatically for each flow source.

ASA Firewall and VPN Monitoring 

Three dedicated SNMP sensors cover Cisco ASA firewalls. VPN Traffic monitors bandwidth consumed by tunnels. VPN Connections tracks active sessions, site-to-site and remote access both. And VPN Users watches concurrent connections, useful for catching capacity constraints before they turn into helpdesk calls.

What these sensors don't do is tell you why a tunnel dropped. Routing failures, encryption negotiation issues, ISP problems. That investigation still needs ASA logs and additional tooling. But knowing when something broke and which tunnel is the problem is usually the part that takes longest, and that's what PRTG handles.

QoS and IP SLA

Two sensors are relevant here. The SNMP Cisco CBQoS sensor monitors Class-Based QoS metrics: queue depth, dropped packets, traffic shaping effectiveness. The Cisco IP SLA sensor tracks latency, jitter, packet loss, and MOS for VoIP quality using probes already configured on your routers.

Together they let you validate whether QoS policies are actually working under real load, not just in theory. Also worth stating clearly: PRTG reads metrics from IP SLA probes you configure on your devices. It doesn't create or manage those tests itself. What you get is continuous visibility into the results, with alerts when voice quality degrades or thresholds breach.

Remote Probe Monitoring

Remote probes are how PRTG scales across distributed environments without collapsing your WAN links. Deploy a lightweight probe in each branch office, data center, or cloud environment and it collects data locally from Cisco switches, routers, firewalls, and access points then forwards aggregated data to the central PRTG core server.

WAN bandwidth consumption stays low. Also, if a WAN link goes down monitoring continues locally. All sensor types are supported on remote probes: SNMP, NetFlow, ping, HTTP, and more. Install a Windows-based remote probe at the site (Linux supported in specific scenarios; consult PRTG documentation for details), connect to the core server and auto-discovery finds local Cisco devices and configures sensors. For multi-site service provider environments or distributed enterprise networks this architecture scales without routing everything through a single collection point.

free downLoad

Cisco Monitoring: Manual vs. PRTG

Task

Without PRTG

Without PRTG

With PRTG

With PRTG

Checking bandwidth and port saturation

Without PRTG
not included

SSH or Telnet into each device, run show interface commands, export and analyze data manually

With PRTG
included

NetFlow sensors identify Top Talkers, Top Connections, and Top Protocols automatically. SNMP sensors track per-port utilization continuously

Tracking hardware health (PSU, fans, temperature)

Without PRTG
not included

Poll each device via CLI, track status in spreadsheets or tickets

With PRTG
included

Cisco System Health sensor monitors all components continuously. Alerts fire the moment something shows early warning signs

Monitoring VPN tunnels and sessions

Without PRTG
not included

Log into each ASA, run show vpn-sessiondb, repeat per firewall

With PRTG
included

Dedicated ASA VPN sensors track traffic, connections, and concurrent users across all firewalls from one place

Validating QoS and VoIP performance

Without PRTG
not included

Manually review CBQoS stats and IP SLA results on each router — time-consuming and easy to miss degradation between checks

With PRTG
included

SNMP CBQoS and IP SLA sensors collect and visualize performance metrics automatically, with threshold alerts when voice quality or policy compliance drops

Managing multi-site Cisco infrastructure

Without PRTG
not included

Separate tools or manual checks per site. No unified view

With PRTG
included

Remote probes monitor all sites locally. Centralized dashboard and notifications cover the whole network

free downLoad

“From a server perspective, we're monitoring all of the key components of our service such as CPU usage, RAM disk space, the Windows services that it's running, and network connectivity of that server. In terms of networks, we’re monitoring all of our switches, firewalls, and access points. It’s really useful to be able to easily pull performance metrics from the PRTG dashboard.”

Ollie Kerslake, Infrastructure Lead
Riverford Organic Farmers

“The tool has given us greater control over all types of devices connected to the network (switches, IP telephony, security cameras, IoT, WiFi) that previously remained opaque when dealing with service incidents. This has improved our ability to diagnose and resolve problems, which has translated into greater efficiency and a better user experience in both internal and public services.”

Jordi Tolosà Bel, New Technologies Technician
Vinaroz City Council

“Our objective was to be able to monitor the health of our most critical servers containing data and applications, but also the flows and bandwidth between headquarters, our 50 servers in the cloud and the 15 servers at our production sites. For us, it is essential to have a proactive approach to understand where the weaknesses of the IT system are to be able to improve them.”

Marc Boullier, CIO
Carambar & Co

Paessler PRTG Network Monitor licenses & pricing

Choose the PRTG Network Monitor subscription that's best for you.

License NameLicense descriptionPriceLicense DetailsGet startedPricing Details
PRTG 500$200per month paid annuallyBuy nowBuy now

Enough to monitor multiple aspects of 50 devices

PRTG 1000$358per month paid annuallyBuy nowBuy now

Enough to monitor multiple aspects of 100 devices

PRTG 2500$742per month paid annuallyBuy nowBuy now

Enough to monitor multiple aspects of 250 devices

PRTG 5000$1,300per month paid annuallyBuy nowBuy now

Enough to monitor multiple aspects of 500 devices

PRTG 10000$1,642per month paid annuallyBuy nowBuy now

Enough to monitor multiple aspects of 1000 devices

Over 100,000 Customers Worldwide Love Paessler  

customer success stories

 Cisco Monitoring: Frequently Asked Questions


Does PRTG support Cisco ACI monitoring?

Yes, though how much visibility you get depends on how you set it up. SNMP sensors cover fabric health, leaf and spine switches. For deeper integration API-based custom sensors give you more granularity into your ACI environment. Uptime, performance metrics, connectivity. All trackable from the same platform as the rest of your Cisco infrastructure.

Can PRTG monitor Cisco Nexus and Catalyst switches?

Both work. SNMP monitoring covers Nexus data center switches and Catalyst enterprise switches. Run auto-discovery and PRTG identifies the devices, then configures sensors for interface traffic, hardware health, CPU, and memory. Standard deployments don't need manual sensor setup.

Does PRTG include dedicated Cisco sensors?

It does come withquite a few. System Health, ASA VPN, CBQoS, IP SLA, UCS. Pre-configured, no scripting. Auto-discovery identifies your Cisco network components and applies the right sensors. For anything outside standard Cisco hardware you can build custom sensors, but most environments won't need to.

Can I integrate PRTG with other tools via API?

PRTG has a REST API. Query sensor data, acknowledge alarms, pause sensors, trigger actions programmatically. Ticketing systems, NOC dashboards, automation platforms, custom applications are all workable. How deep the integration goes is usually a question of what the other system supports, not on PRTG's end.

Does PRTG offer topology mapping for Cisco networks?

Partial support. Map functionality covers geo-maps for multi-site deployments and custom dashboards with live sensor status. Layer 2 and Layer 3 topology maps are not generated automatically though, those you build manually in the map editor. Worth knowing before you go in, rather than expecting automatic topology discovery.

Is PRTG suitable for large enterprise networks and service providers?

Scales well for both. Remote probes handle distributed sites, clustering covers high availability and thousands of devices across routers, switches, firewalls, and WAN links are monitored. Licensing is flexible enough that it doesn't become a bottleneck. Service providers and enterprise networks run PRTG at scale regularly.

Can PRTG monitor Wi-Fi access points and wireless controllers?

Yes. Cisco wireless access points and controllers via SNMP. Signal strength, connected clients, bandwidth usage, connectivity. Sits in the same platform as your wired Cisco monitoring. Same dashboards, same alerts. No separate tools.

Paessler PRTG

Paessler PRTG

Network Monitoring Software – Version 26.1.116.1532 (February 9th, 2026)

Hosting icon

Hosting

Download for Windows and cloud-based version PRTG Hosted Monitor available

Languages icon

Languages

English, German, Spanish, French, Portuguese, Dutch, Russian, Japanese, and Simplified Chinese

test

Monitor everything

Network devices, bandwidth, servers, applications, virtual environments, remote systems, IoT, and more

test

Pricing

Choose the PRTG Network Monitor subscription that's best for you

Discover more monitoring insights and stories

Content illustration

Powerful stories from the monitoring world

  • Cisco Meraki Monitoring in PRTG: Setup Guide 2025 - Paessler Blog
  • Monitoring Cisco Devices With PRTG – Part 2/3 - Paessler Blog
  • Cisco ASA Firewall Monitoring with PRTG NetFlow v9 and NSEL
Support illustration

Resources to master your monitoring challenges

  • How can I monitor a Cisco WLC deployment with PRTG?
  • PRTG Manual: SNMP Cisco UCS System Health Sensor - Paessler
  • How can I monitor Cisco Webex with PRTG? - Paessler Helpdesk
Solution illustration

Solutions for all your monitoring needs

  • Cisco Monitoring
  • Cisco Router Monitoring
  • Cisco Switch Monitoring
PRTG Logo

Start Monitoring with PRTG and see how it can make your network more reliable and your job easier.

Free download
PRODUCT OVERVIEW

Products

  • Paessler PRTG
    Paessler PRTGMonitor your whole IT infrastructure
    • PRTG Network Monitor
    • PRTG Enterprise Monitor
    • PRTG Hosted Monitor
    • PRTG UVexplorer
    • PRTG extensions
      Extensions for Paessler PRTGExtend your monitoring to a new level
  • Icon Features
    FeaturesExplore all monitoring features

Monitoring with PRTG

  • Network monitoring
  • Bandwidth monitoring
  • SNMP monitoring
  • Network mapping
  • Wi-Fi monitoring
  • Server monitoring
  • Network traffic analyzer
  • NetFlow monitoring
  • Syslog server

Useful Links

  • PRTG Manual
  • Knowledge Base
  • Customer Success Stories
  • About Paessler
  • Subscribe to newsletter
  • PRTG Support
  • PRTG Consulting
  • PRTG Feedback & Roadmap

Contact

Paessler GmbH
Thurn-und-Taxis-Str. 14, 
90411 Nuremberg 
Germany

[email protected]

+49 911 93775-0

  • Contact us
©2026 Paessler GmbHTerms & ConditionsPrivacy PolicyImprintReport VulnerabilityDownload & InstallSitemap
CCTV CCTV CCTV