
- English
- Deutsch
- Español
- Français
- Italiano
- Português
Cisco Meraki simplifies network management through the cloud, but that doesn't mean your monitoring is automatically sorted. When access points go offline, switches enter an alerting state, or uplinks fail, the Meraki Dashboard shows you what's happening. What it doesn't do is feed that status into the rest of your infrastructure monitoring or push alerts through the channels your team actually uses.
Paessler PRTG connects to the Meraki Dashboard API and pulls device health data directly into your central monitoring setup.
What PRTG monitors in your Meraki environment:
Wi-Fi access points (MR), switches (MS), MX security appliances, uplink status (active, failed, ready), device states (online, offline, alerting, dormant), VPN connectivity, network name identification across your cloud-based Meraki deployment. PRTG provides observability for Meraki networks alongside SaaS apps, Microsoft environments, and traditional on-premises infrastructure.

You've got Cisco Meraki devices spread across multiple sites. Checking their status means logging into the Meraki cloud, switching between organizations and network names, manually reviewing device health. That works for the occasional check. When IT teams are responsible for keeping everything online, though, it's not practical.
PRTG pulls device health data directly from the Meraki API and tracks it in your central monitoring system. Same status information (online, offline, alerting), no manual login routine. Unlike standalone monitoring tools that only cover Meraki, with PRTG you can integrate cloud-based observability to your entire network.Dies ist ein Aufzählungspunkt
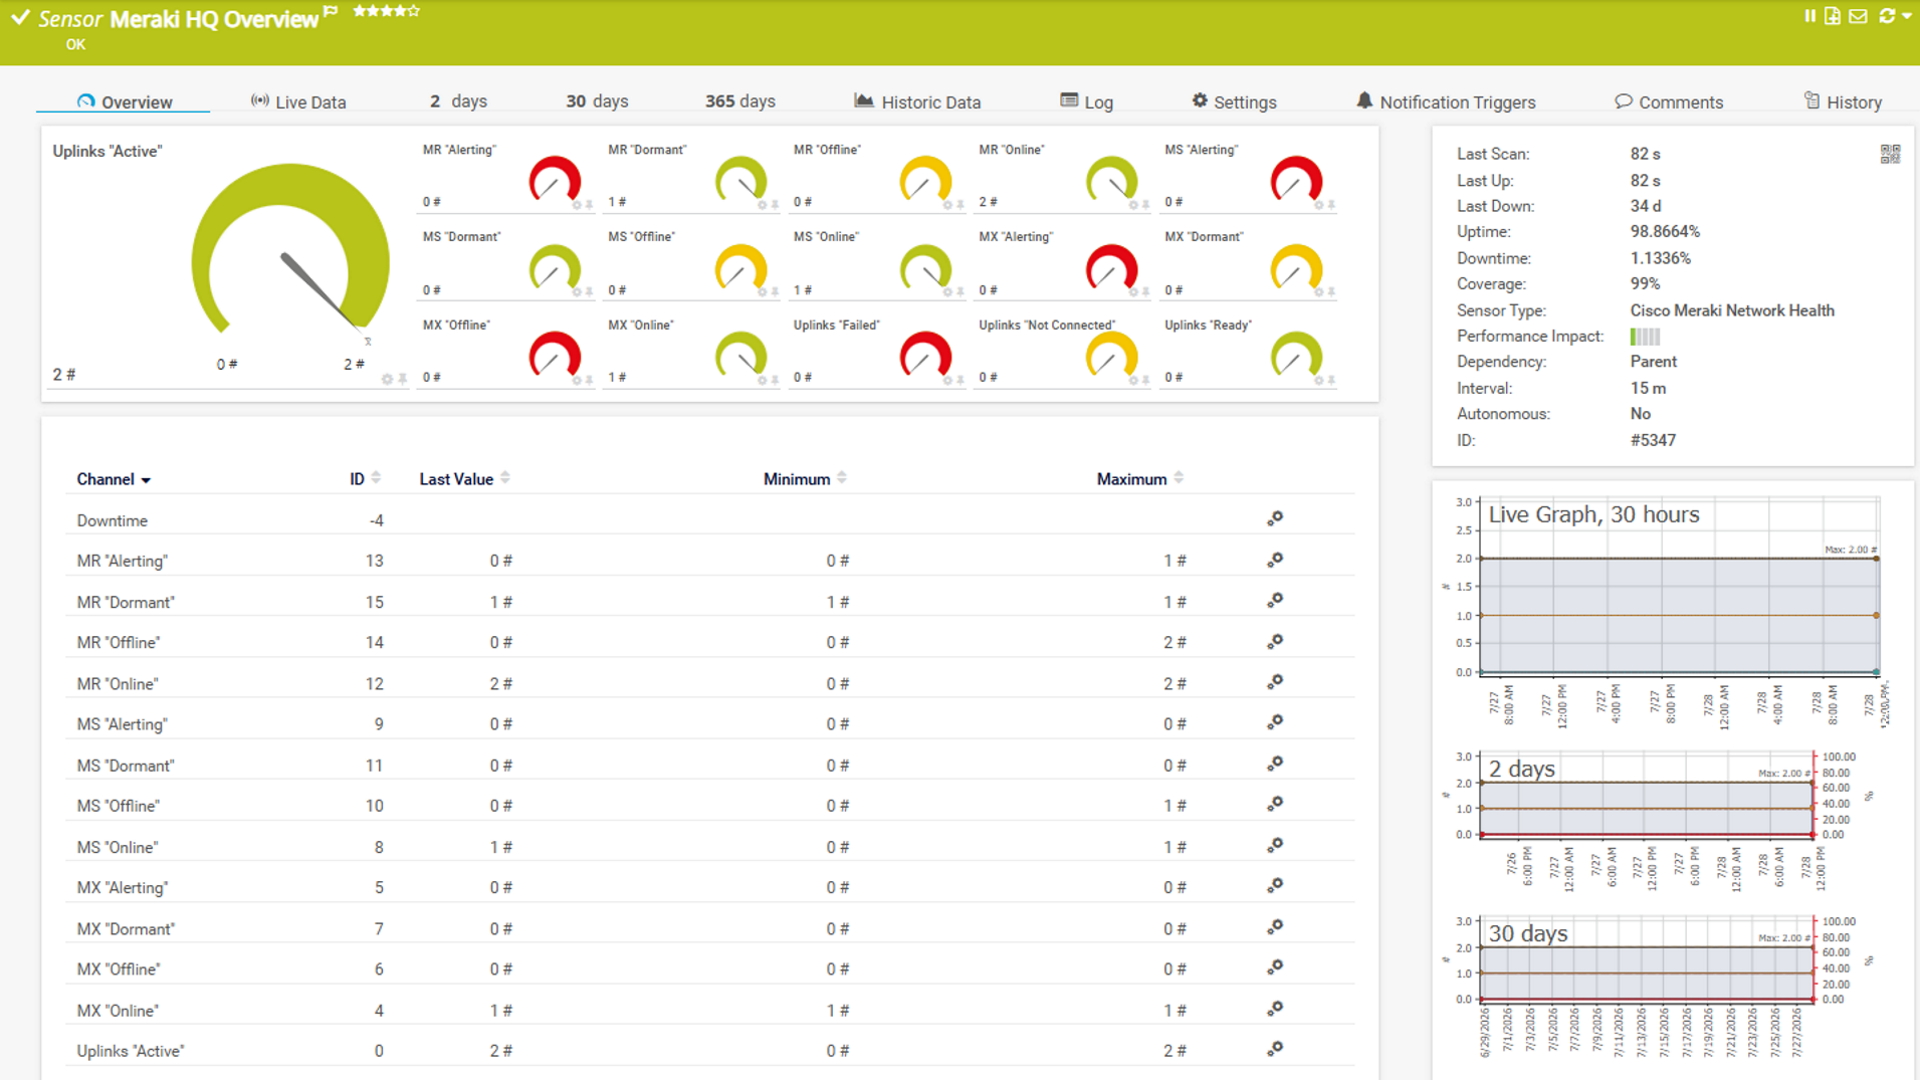
Your Cisco Meraki metrics at a glance
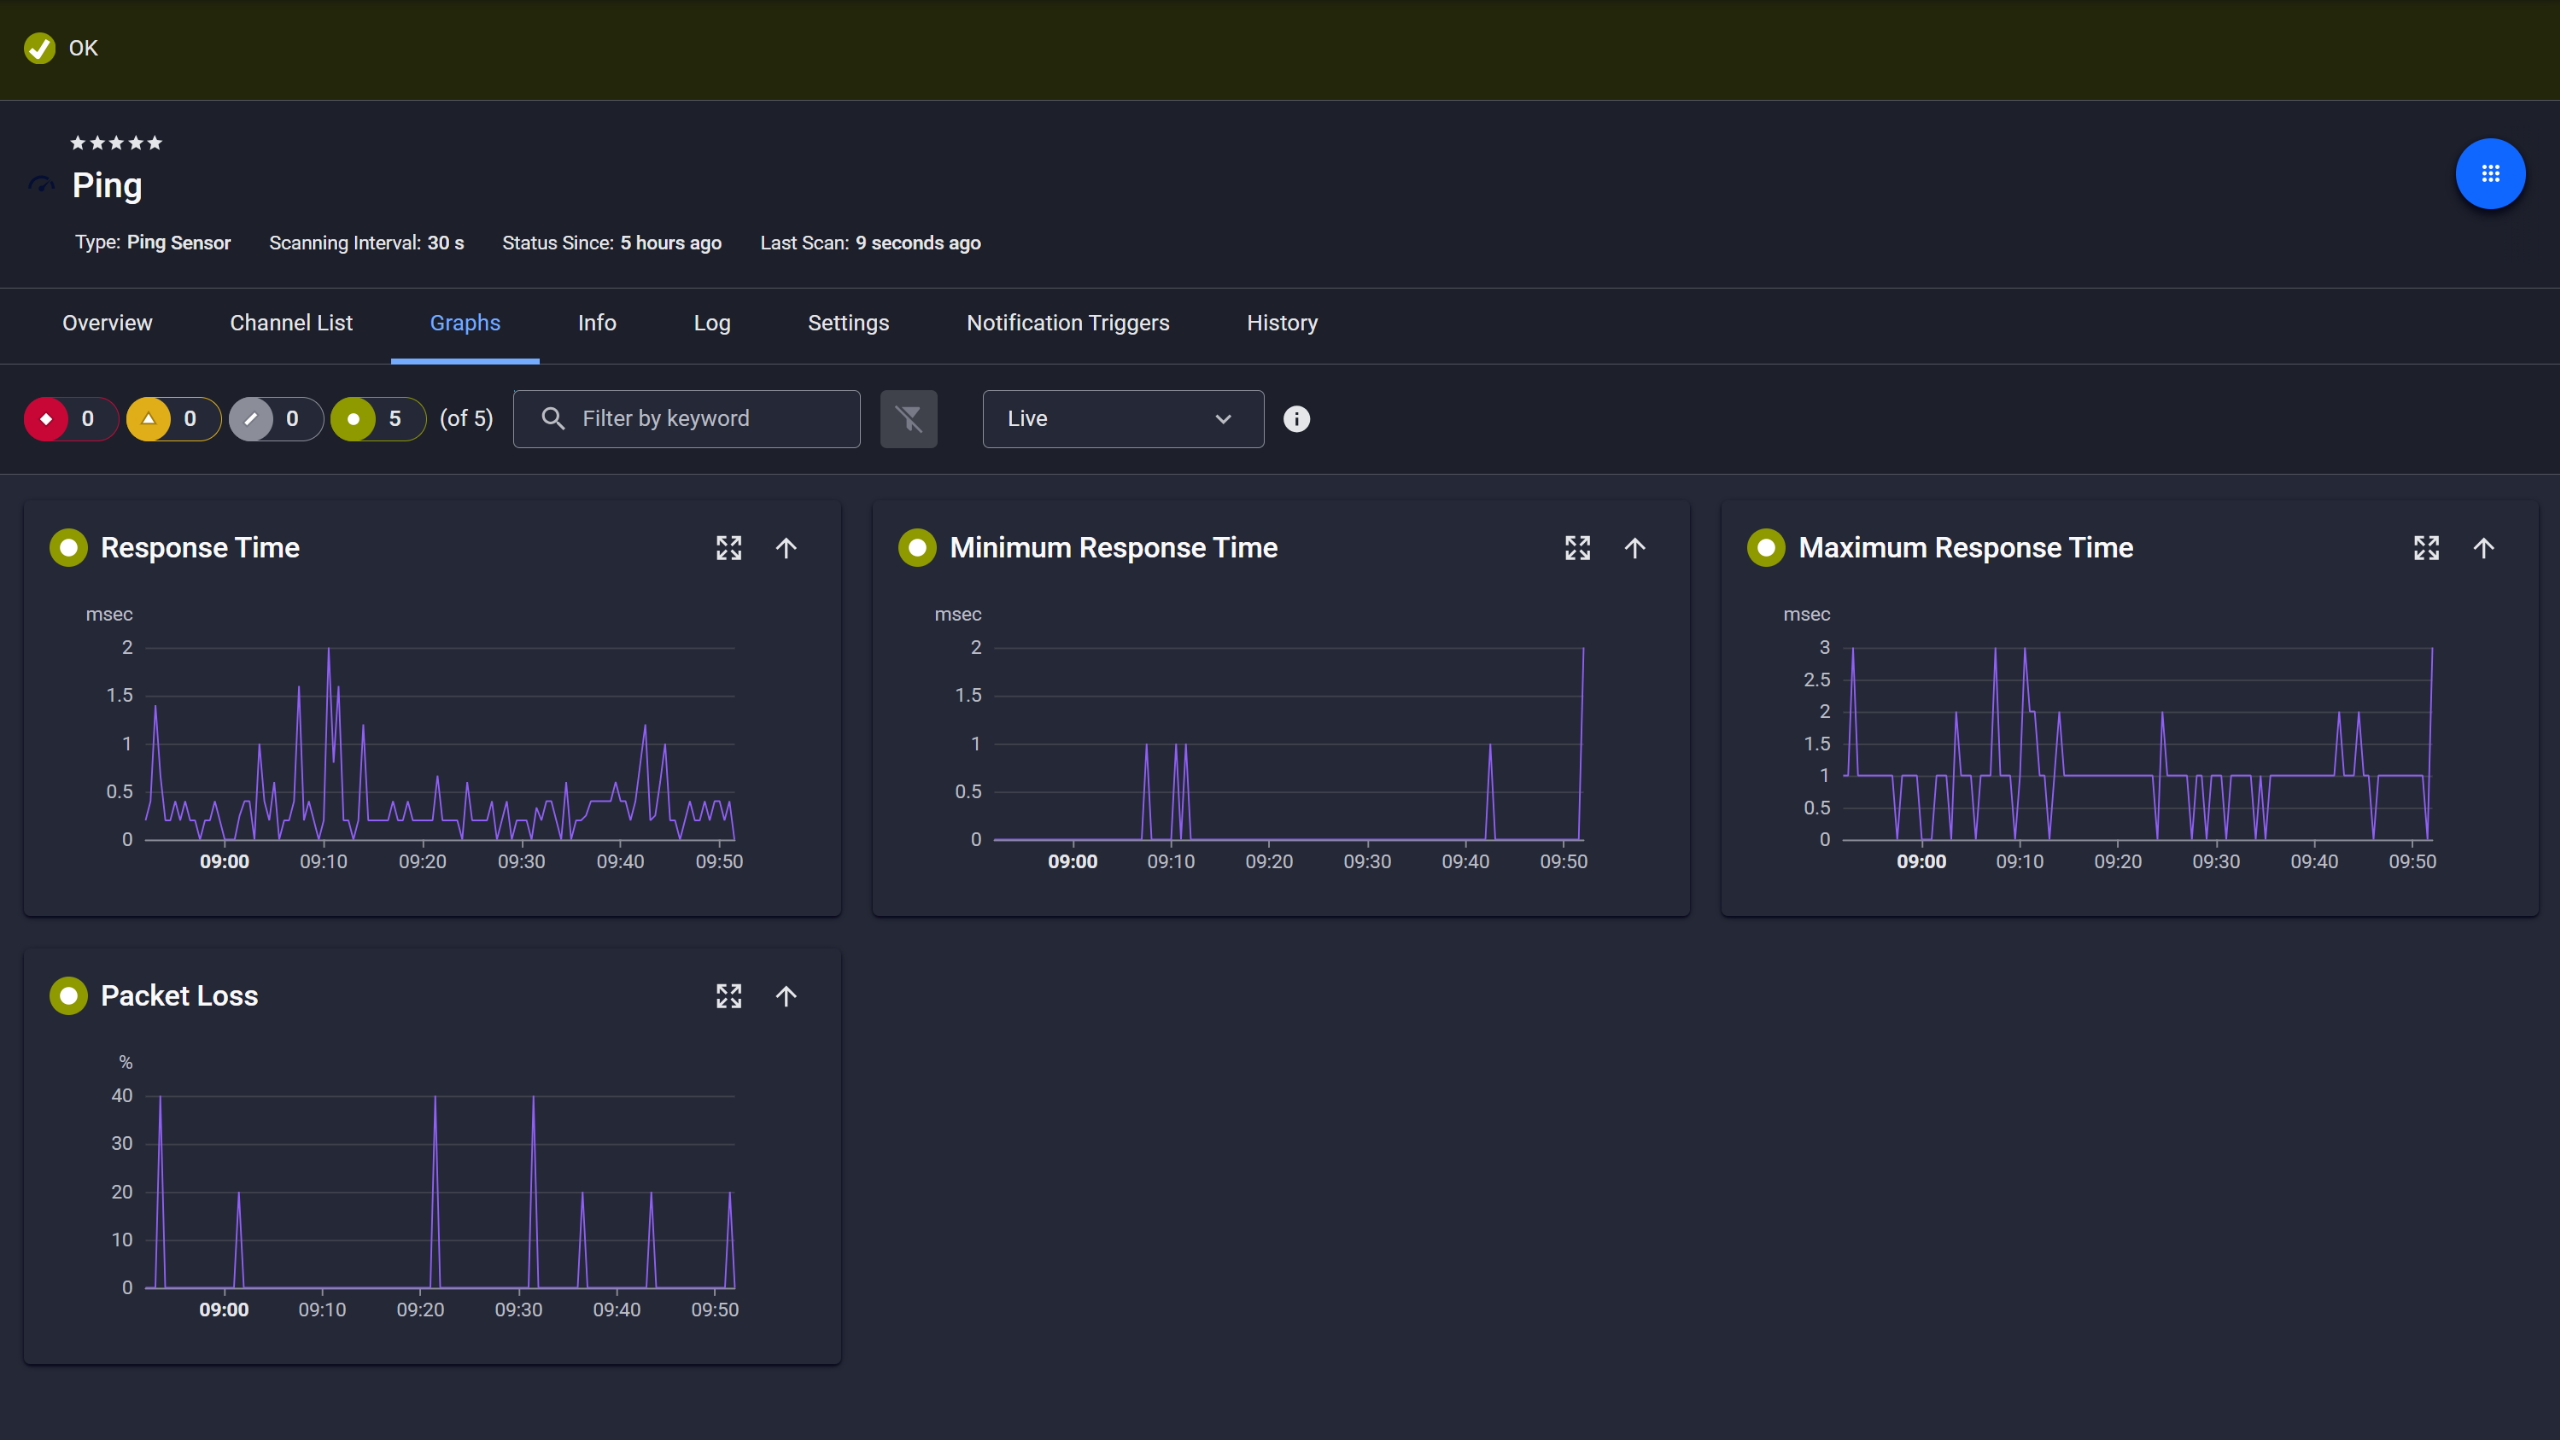
Ping response and packet loss

Live graphs, real-time performance data
Cloud-based network management doesn't mean self-healing. When a Meraki access point goes offline or a switch switches to an alerting state, users lose connectivity. The Meraki Dashboard shows what's happening, sure. It doesn't push proactive alerts to your monitoring tools or integrate with your existing workflows.
With PRTG you can monitor all your Cisco Meraki devices in real-time and triggers notifications based on state changes you define. If an MX appliance goes offline or uplinks fail, you know immediately through your standard channels: email, SMS, Microsoft Teams, ticketing system integration.
Start monitoring your infrastructure in minutes. No professional services, no complex configuration, no risk.
Your network isn't just Meraki. You've got servers, firewalls, non-Meraki switches, databases, SaaS apps, Microsoft 365 infrastructure, and IoT endpoints. If you decide to manage your Meraki monitoring separately from the rest of your infrastructure this just means fragmented observability. When troubleshooting connectivity issues, IT teams need the full picture, not just what's in the Meraki cloud.
When you integrate Meraki into PRTG you also make it accessible to your unified network management dashboard. View Cisco Meraki devices alongside SNMP-monitored infrastructure, server health, bandwidth usage, and application performance.
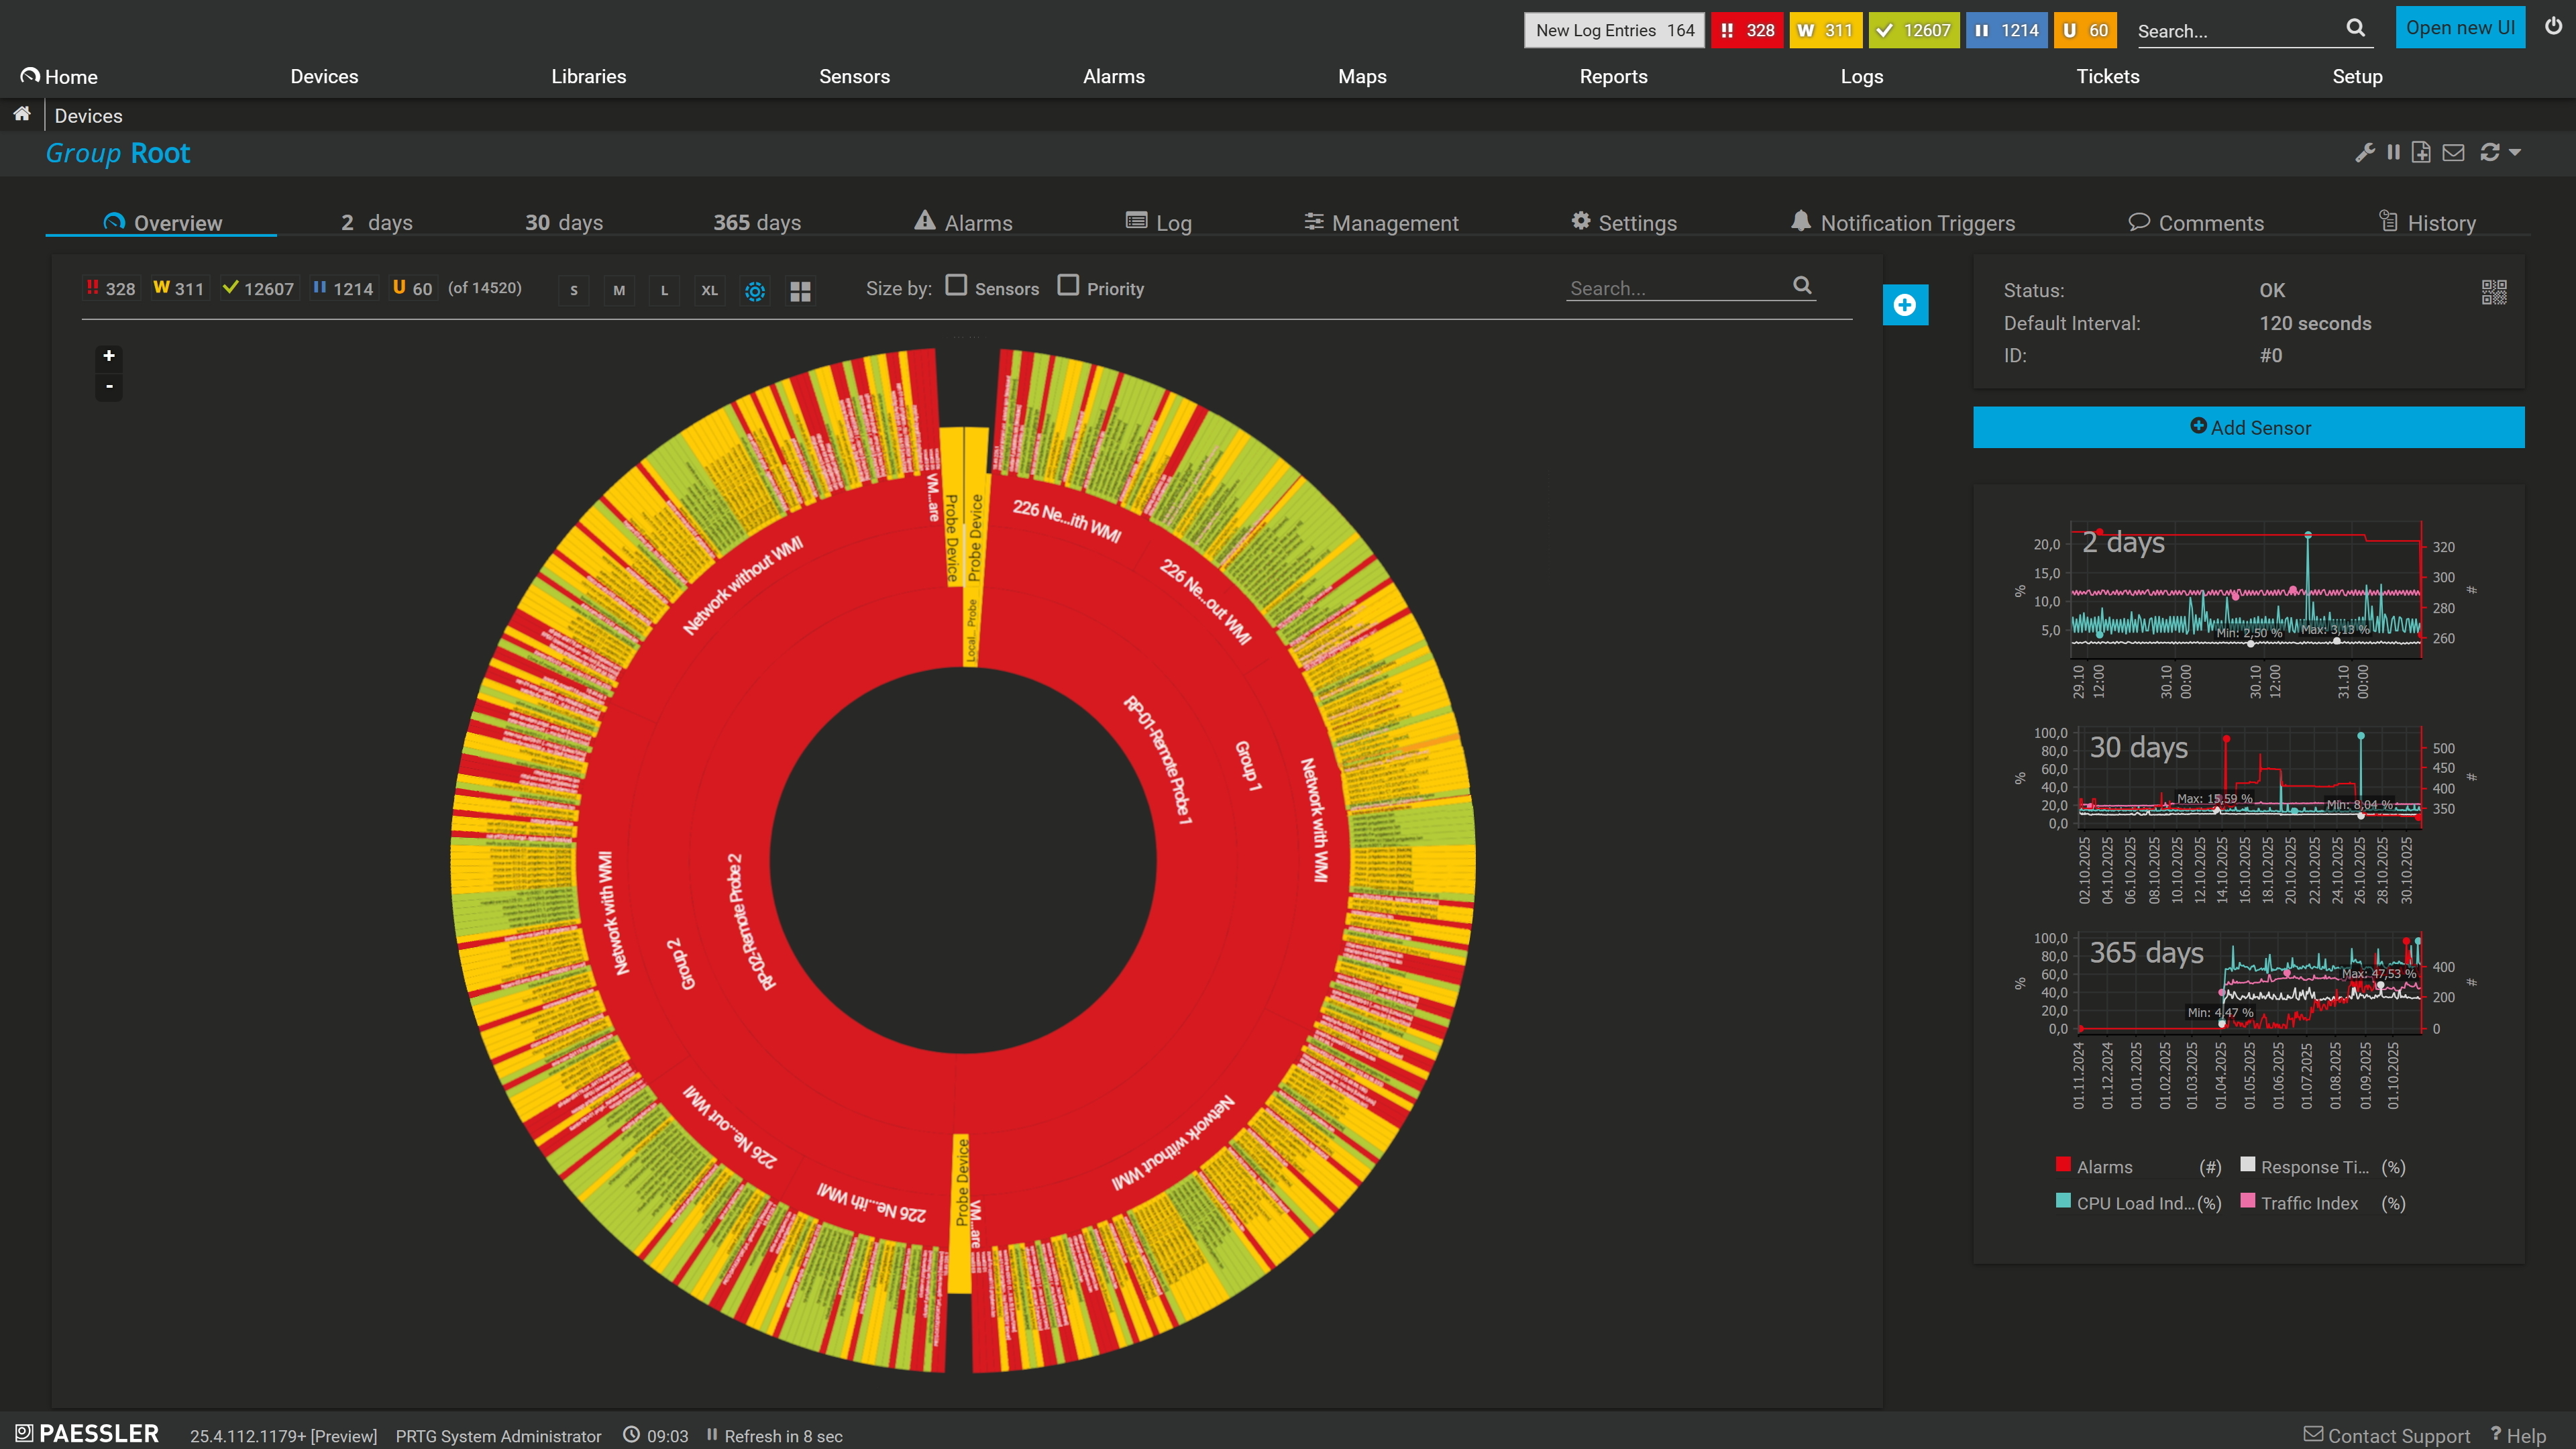
Custom maps with live status

Full device list, instant overview
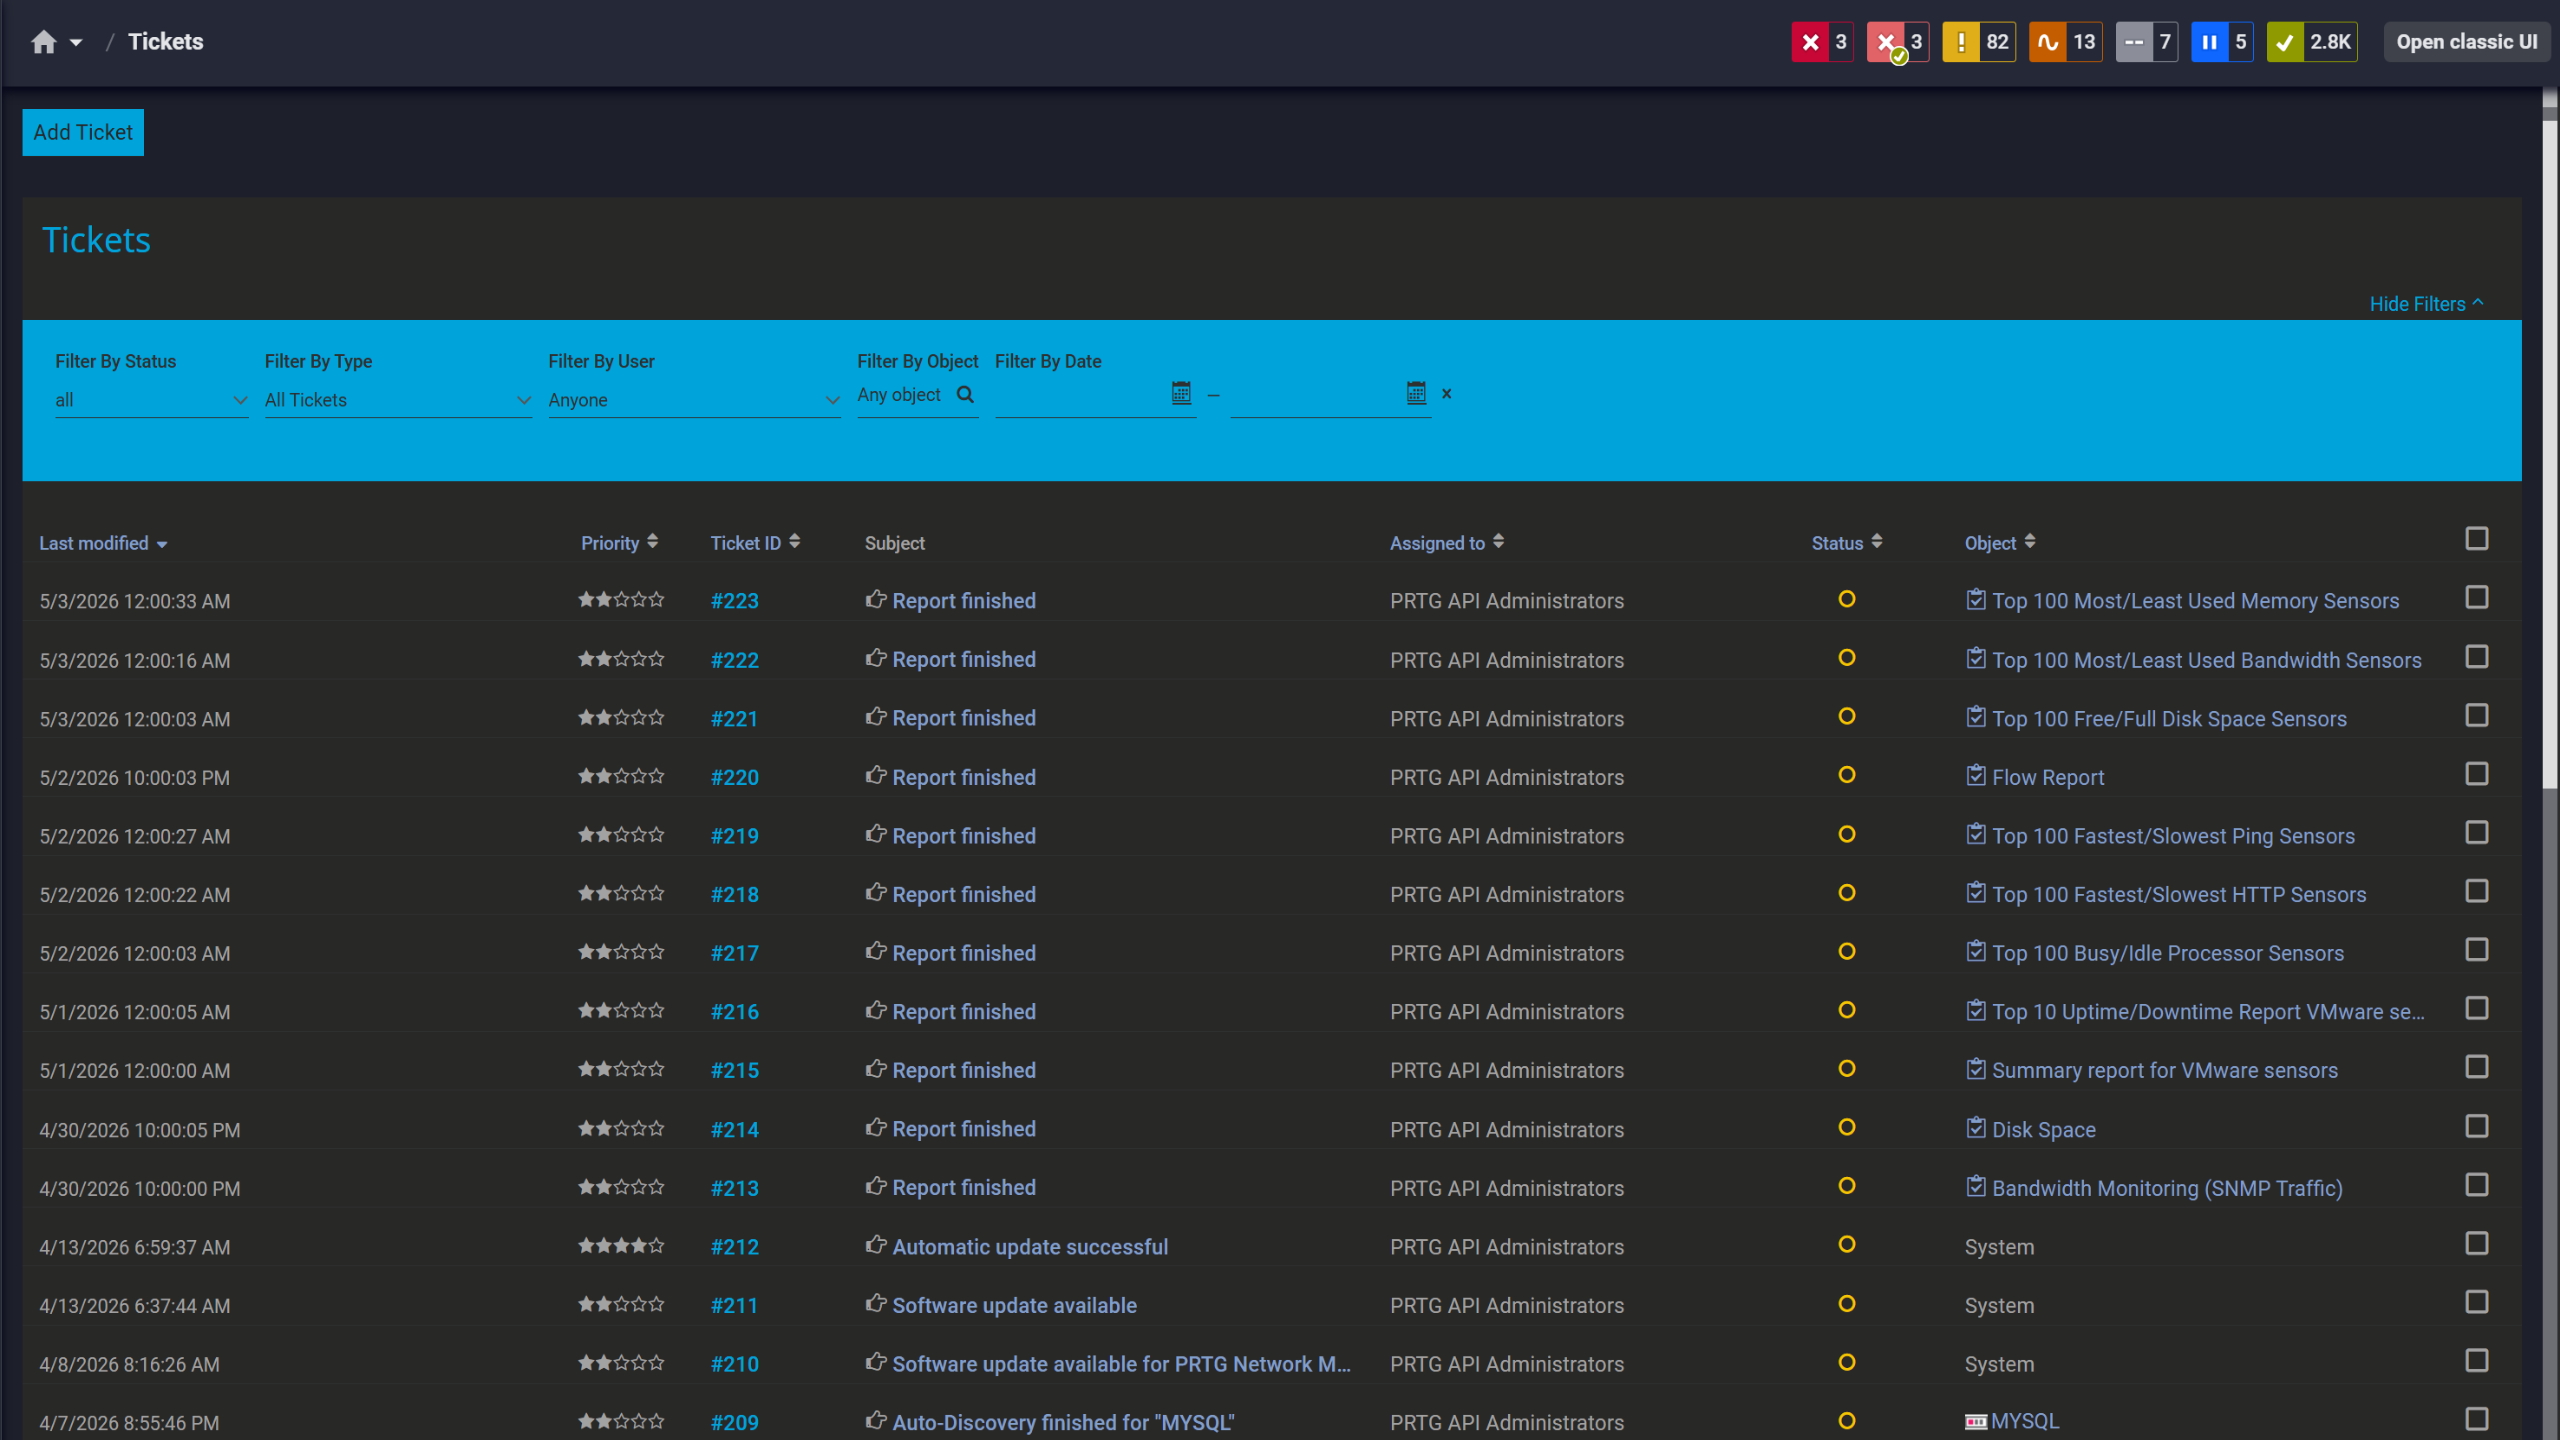
Tickets keep your team aligned
IT teams don't have time for complex integration projects. PRTG's Cisco Meraki Network Health sensor connects to your infrastructure using the Dashboard API. Enable API access in your Meraki organization settings, generate an API key from a Dashboard admin account with at least Read-only permissions, add the sensor in PRTG, and you're monitoring.
The Cisco Meraki Network Health sensor creates a predefined set of channels for MR, MS, and MX device states and uplink states. No manual channel configuration is required. Start monitoring your entire cloud-managed Meraki network in the time it takes to generate an API key.
PRTG monitors Cisco Meraki infrastructure through the Dashboard API, delivering complete observability into device health and uplink status across your cloud-managed network. Here's how the technical integration works.
FEATURE | Manual Dashboard Checks Manual Dashboard Checks | PRTG PRTG |
|---|---|---|
Device Status | Manual Dashboard Checks Log into Meraki Dashboard, select organization and network name, navigate to device list, review status manually | PRTG Automated API polling with real-time device status updates, graphs, and proactive notifications |
Multi-Site Observability | Manual Dashboard Checks Switch between Meraki organizations and network views to check each location | PRTG Single dashboard view of all Cisco Meraki devices across all organizations and sites with unified network management |
Alert Integration | Manual Dashboard Checks Meraki Dashboard email alerts only | PRTG Integration with existing notification channels (email, SMS, Microsoft Teams, ticketing, Slack, PagerDuty) |
Infrastructure Context | Manual Dashboard Checks Cisco Meraki devices visible only in Meraki Dashboard | PRTG Meraki status integrated with servers, bandwidth, SaaS apps, Microsoft environments, IoT devices, and non-Meraki network infrastructure |
Historical Reporting | Manual Dashboard Checks Export data from Meraki Dashboard manually | PRTG Automated reports with graphs, Meraki uptime metrics, and availability data alongside all other infrastructure SLA reporting |
Choose the PRTG Network Monitor subscription that's best for you.
| License Name | License description | Price | License Details | Get started | Pricing Details | |
|---|---|---|---|---|---|---|
| PRTG 500 | $200 | per month paid annually | Buy nowBuy now | Enough to monitor multiple aspects of 50 devices | ||
| PRTG 1000 | $358 | per month paid annually | Buy nowBuy now | Enough to monitor multiple aspects of 100 devices | ||
| PRTG 2500 | $742 | per month paid annually | Buy nowBuy now | Enough to monitor multiple aspects of 250 devices | ||
| PRTG 5000 | $1,300 | per month paid annually | Buy nowBuy now | Enough to monitor multiple aspects of 500 devices | ||
| PRTG 10000 | $1,642 | per month paid annually | Buy nowBuy now | Enough to monitor multiple aspects of 1000 devices |

No. PRTG monitors device health via the Dashboard API but doesn't configure Cisco Meraki devices. IT teams still use the Meraki Dashboard for all configuration tasks—Wi-Fi SSID settings, firewall rules, VPN setup, network name assignments. PRTG provides network monitoring and observability through read-only API access, which is why it requires API credentials with at least read-only admin permissions.
You need your Meraki organization API key, organization ID, and network name. Enable Dashboard API access in your organization settings, generate an API key from a Dashboard admin account with read permissions, and enter those credentials when you add the Cisco Meraki Network Health sensor in PRTG. The sensor automatically discovers and monitors all MR, MS, and MX devices in that organization without requiring individual IP address configuration.
The Cisco Meraki Network Health sensor monitors organization-level device health and the number of devices in each state: online, offline, alerting. It doesn't create individual sensors for each access point or switch. If you need per-device monitoring with specific IP address tracking, you can use SNMP sensors on Cisco Meraki devices if SNMP is enabled, though API-based monitoring is the recommended approach for cloud-managed infrastructure. IT teams can view status graphs for device groups without managing dozens of individual monitoring tools.
PRTG's Cisco Meraki Network Health sensor monitors uplink connectivity status (active, failed, ready) across your Meraki devices. Since VPN and SD-WAN tunnels run over these uplinks, monitoring uplink status gives you visibility into the WAN conditions that affect tunnel availability. However, PRTG does not provide dedicated per-tunnel metrics (tunnel throughput, per-tunnel latency, tunnel-specific packet loss) through the Network Health sensor. For deeper tunnel-level monitoring, you can use PRTG's SNMP sensors (if enabled on Meraki devices) or custom HTTP REST sensors to query specific Meraki Dashboard API endpoints.
The recommended scanning interval is 5 minutes. The minimum is 10 seconds, but frequent API polling isn't necessary for cloud-based device health monitoring and may count against Meraki API rate limits. Five-minute intervals provide timely status updates while keeping API call volume reasonable. PRTG stores historical data for graphs and reports, with resolution depending on your configured polling interval.
The Cisco Meraki Network Health sensor focuses on device health status (online/offline/alerting). It doesn't pull detailed metrics like per-AP client counts, bandwidth throughput, or RF analytics. For those metrics, IT teams would need to use the Meraki Dashboard or build custom sensors using PRTG's HTTP API sensor to query specific Dashboard API endpoints. This approach allows network management teams to extend PRTG's observability based on their specific monitoring requirements without overloading the cloud-based API.
Network Monitoring Software – Version 26.3.124.1727 (September 16, 2026)
Download for Windows and cloud-based version PRTG Hosted Monitor available
English, German, Spanish, French, Portuguese, Dutch, Russian, Japanese, and Simplified Chinese
Network devices, bandwidth, servers, applications, virtual environments, remote systems, IoT, and more
Choose the PRTG Network Monitor subscription that's best for you



