- English
- Deutsch
- Español
- Français
- Italiano
- Português
Paessler PRTG monitors your Microsoft Active Directory environment through WMI and performance counters, tracking Active Directory health, replication status, authentication performance, and Group Policy processing in real time. The integrated auto-discovery feature detects domain controllers (DC) across your network, while pre-configured sensors monitor critical AD services, LDAP queries, DNS integration, and resource utilization. You get instant visibility into account lockouts, failed logons, replication lag, and service availability without manual scripting or complex setup.
PRTG monitors Windows Server 2012 R2 and later, supporting Active Directory Domain Services (AD DS), Azure AD Connect, DNS, LDAP, Kerberos, and Group Policy. PRTG tracks domain controller performance, replication status, and security events alongside your network infrastructure, servers, and applications in one platform, so you're not switching between multiple tools to troubleshoot authentication issues or correlate AD problems with network outages.

Users locked out due to failed authentication attempts, password policy violations, or user account issues create helpdesk floods and productivity loss. When you're managing infrastructure with a lean IT team, you can't afford hours of troubleshooting login failures for one user at a time. PRTG monitors logon events, Kerberos authentication, account lockout thresholds, and service account status in real time. Detect authentication issues before users notice, reduce helpdesk tickets, and maintain business continuity.
• Real-time monitoring of failed logon attempts and lockout events
• Track Kerberos requests and authentication delays
• Alert on service account password expiration or failures
• Monitor LDAP query response times to catch directory access slowdowns before they impact application logins
• Customizable dashboards show authentication patterns across all DCs without manual log correlation
Domain controllers under resource pressure (CPU, memory, disk) cause slow authentication, Group Policy application delays, and service degradation. PRTG monitors DC performance metrics via WMI and performance counters, tracking CPU load, memory usage, disk I/O, and network throughput. Maintain responsive authentication and prevent infrastructure bottlenecks.
• Monitor CPU, memory, and disk utilization on domain controllers
• Track NTDS database size and growth trends
• Identify resource contention early for capacity planning
• Monitor DNS service availability and query response times
• Automated health check alerts on performance thresholds catch issues before users experience degradation
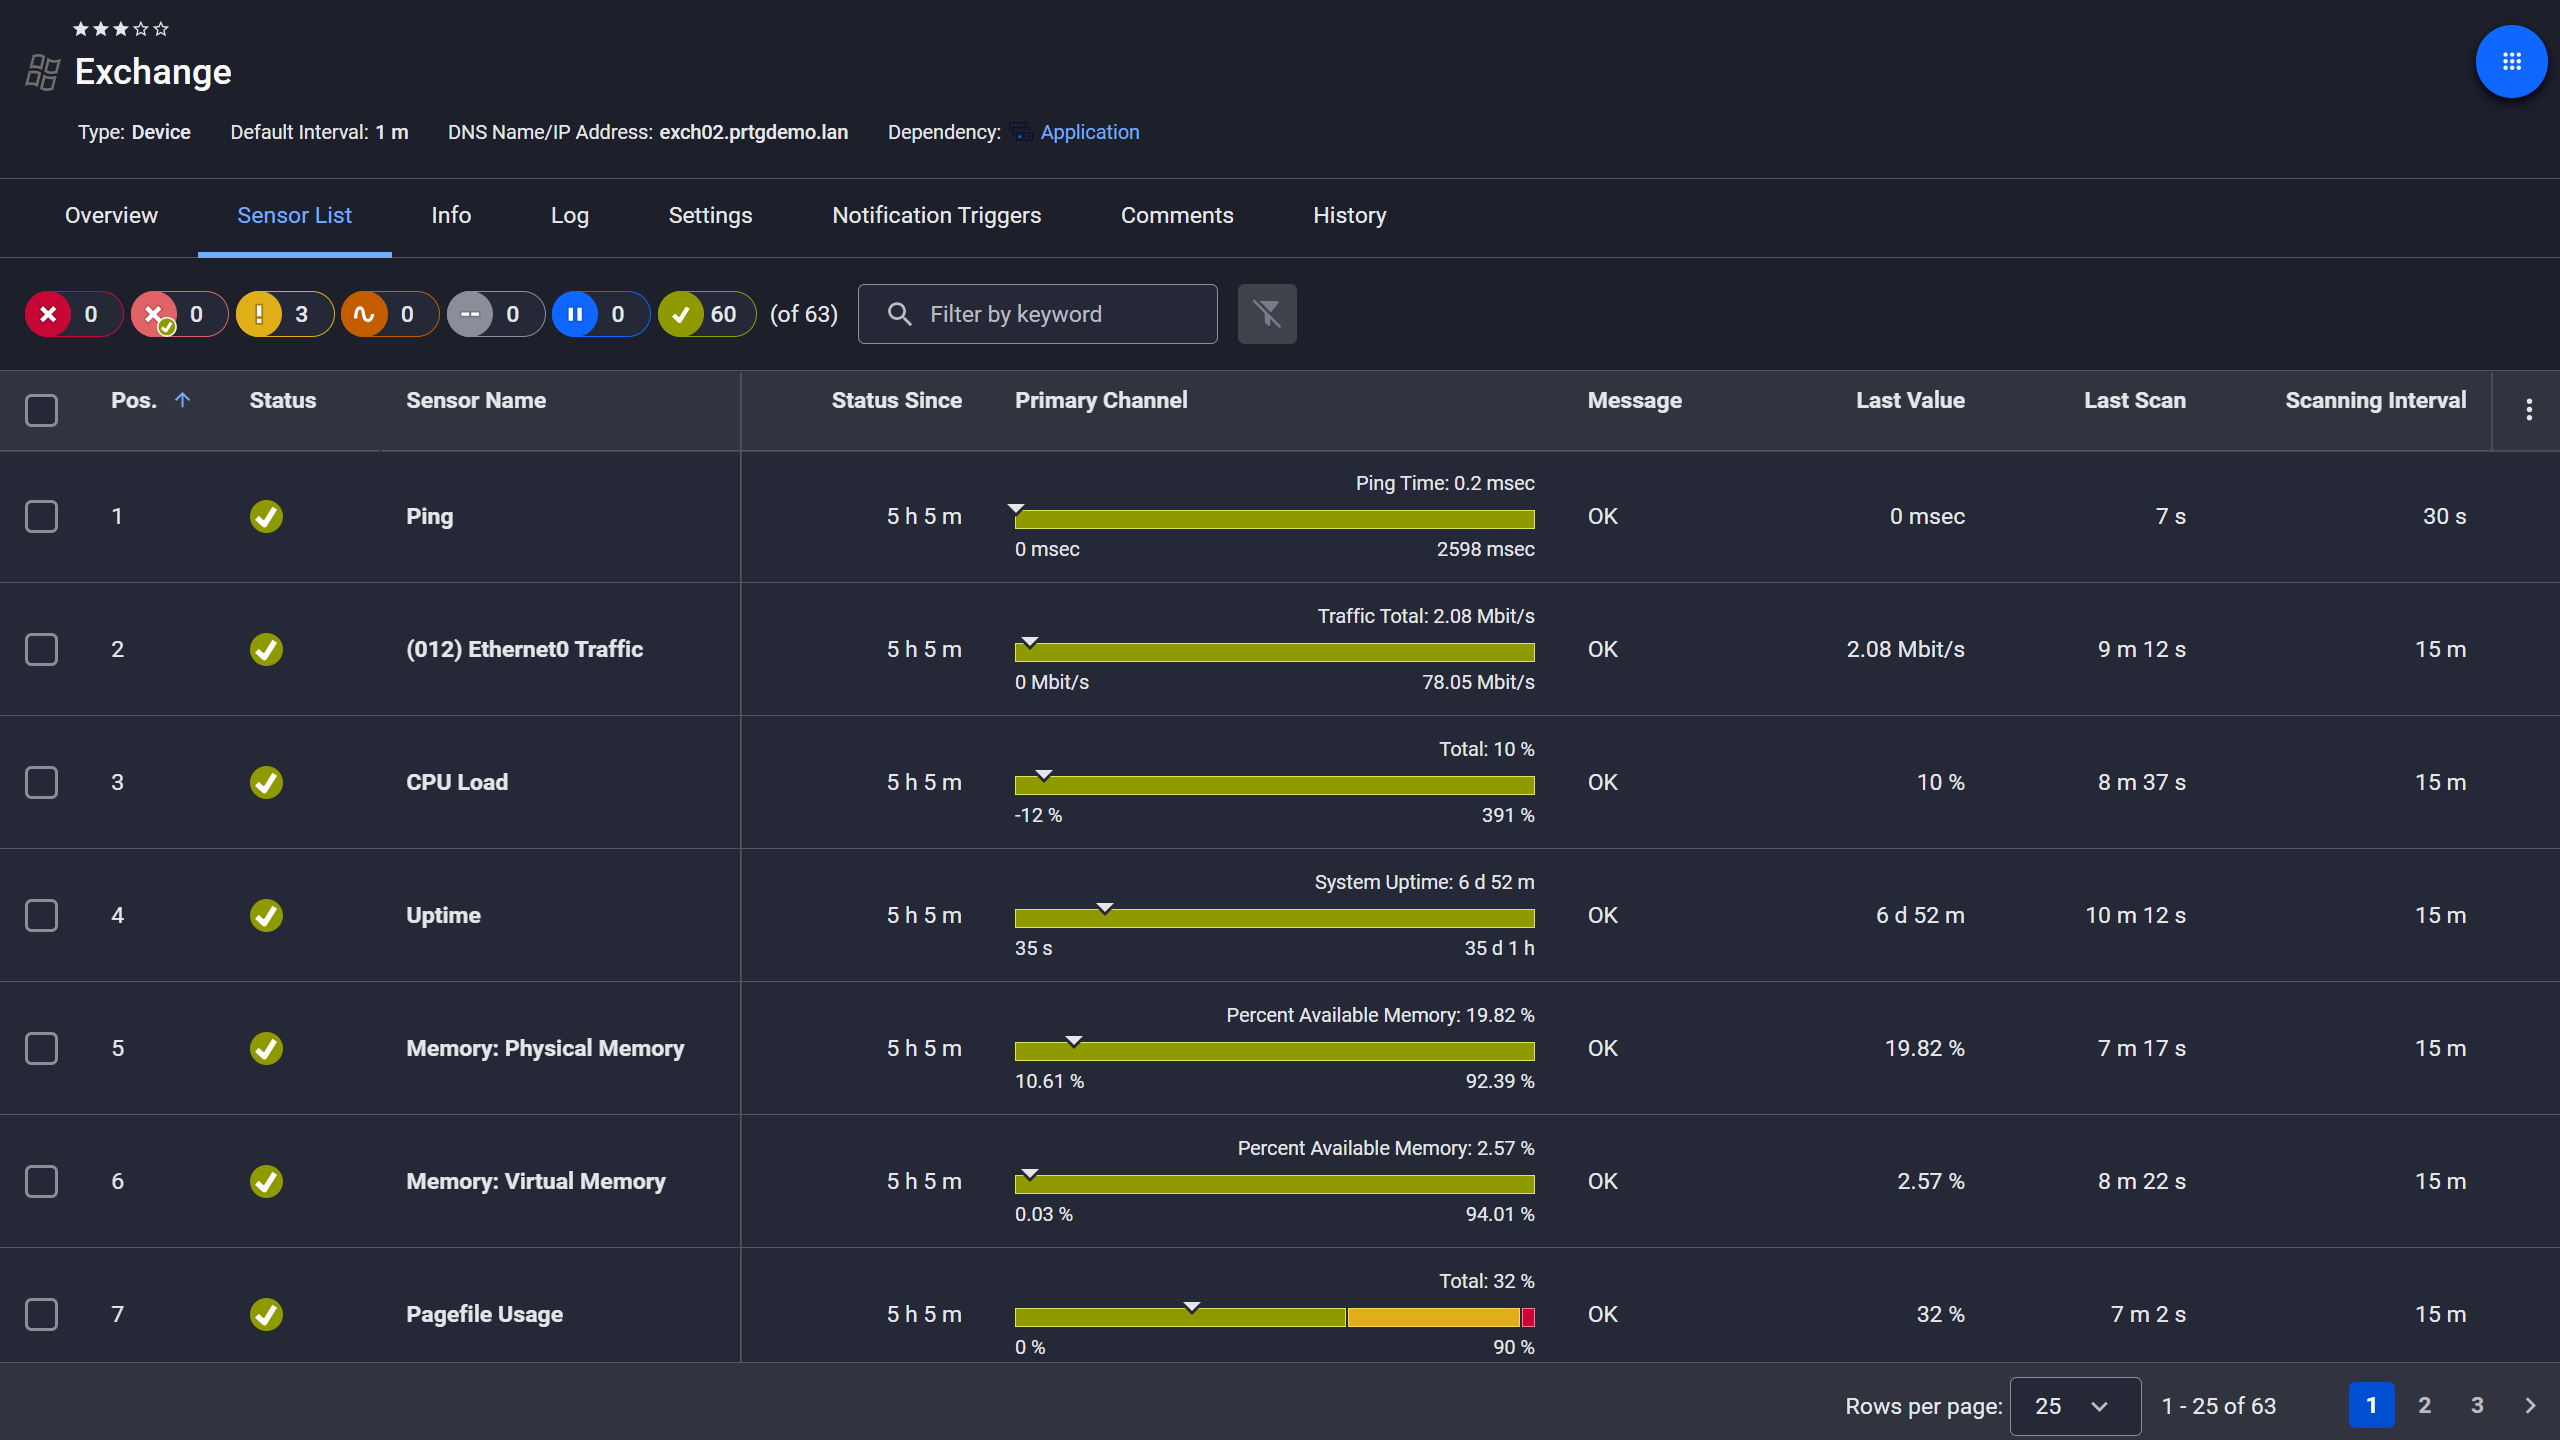
Exchange server, fully under control

Full device list, instant overview
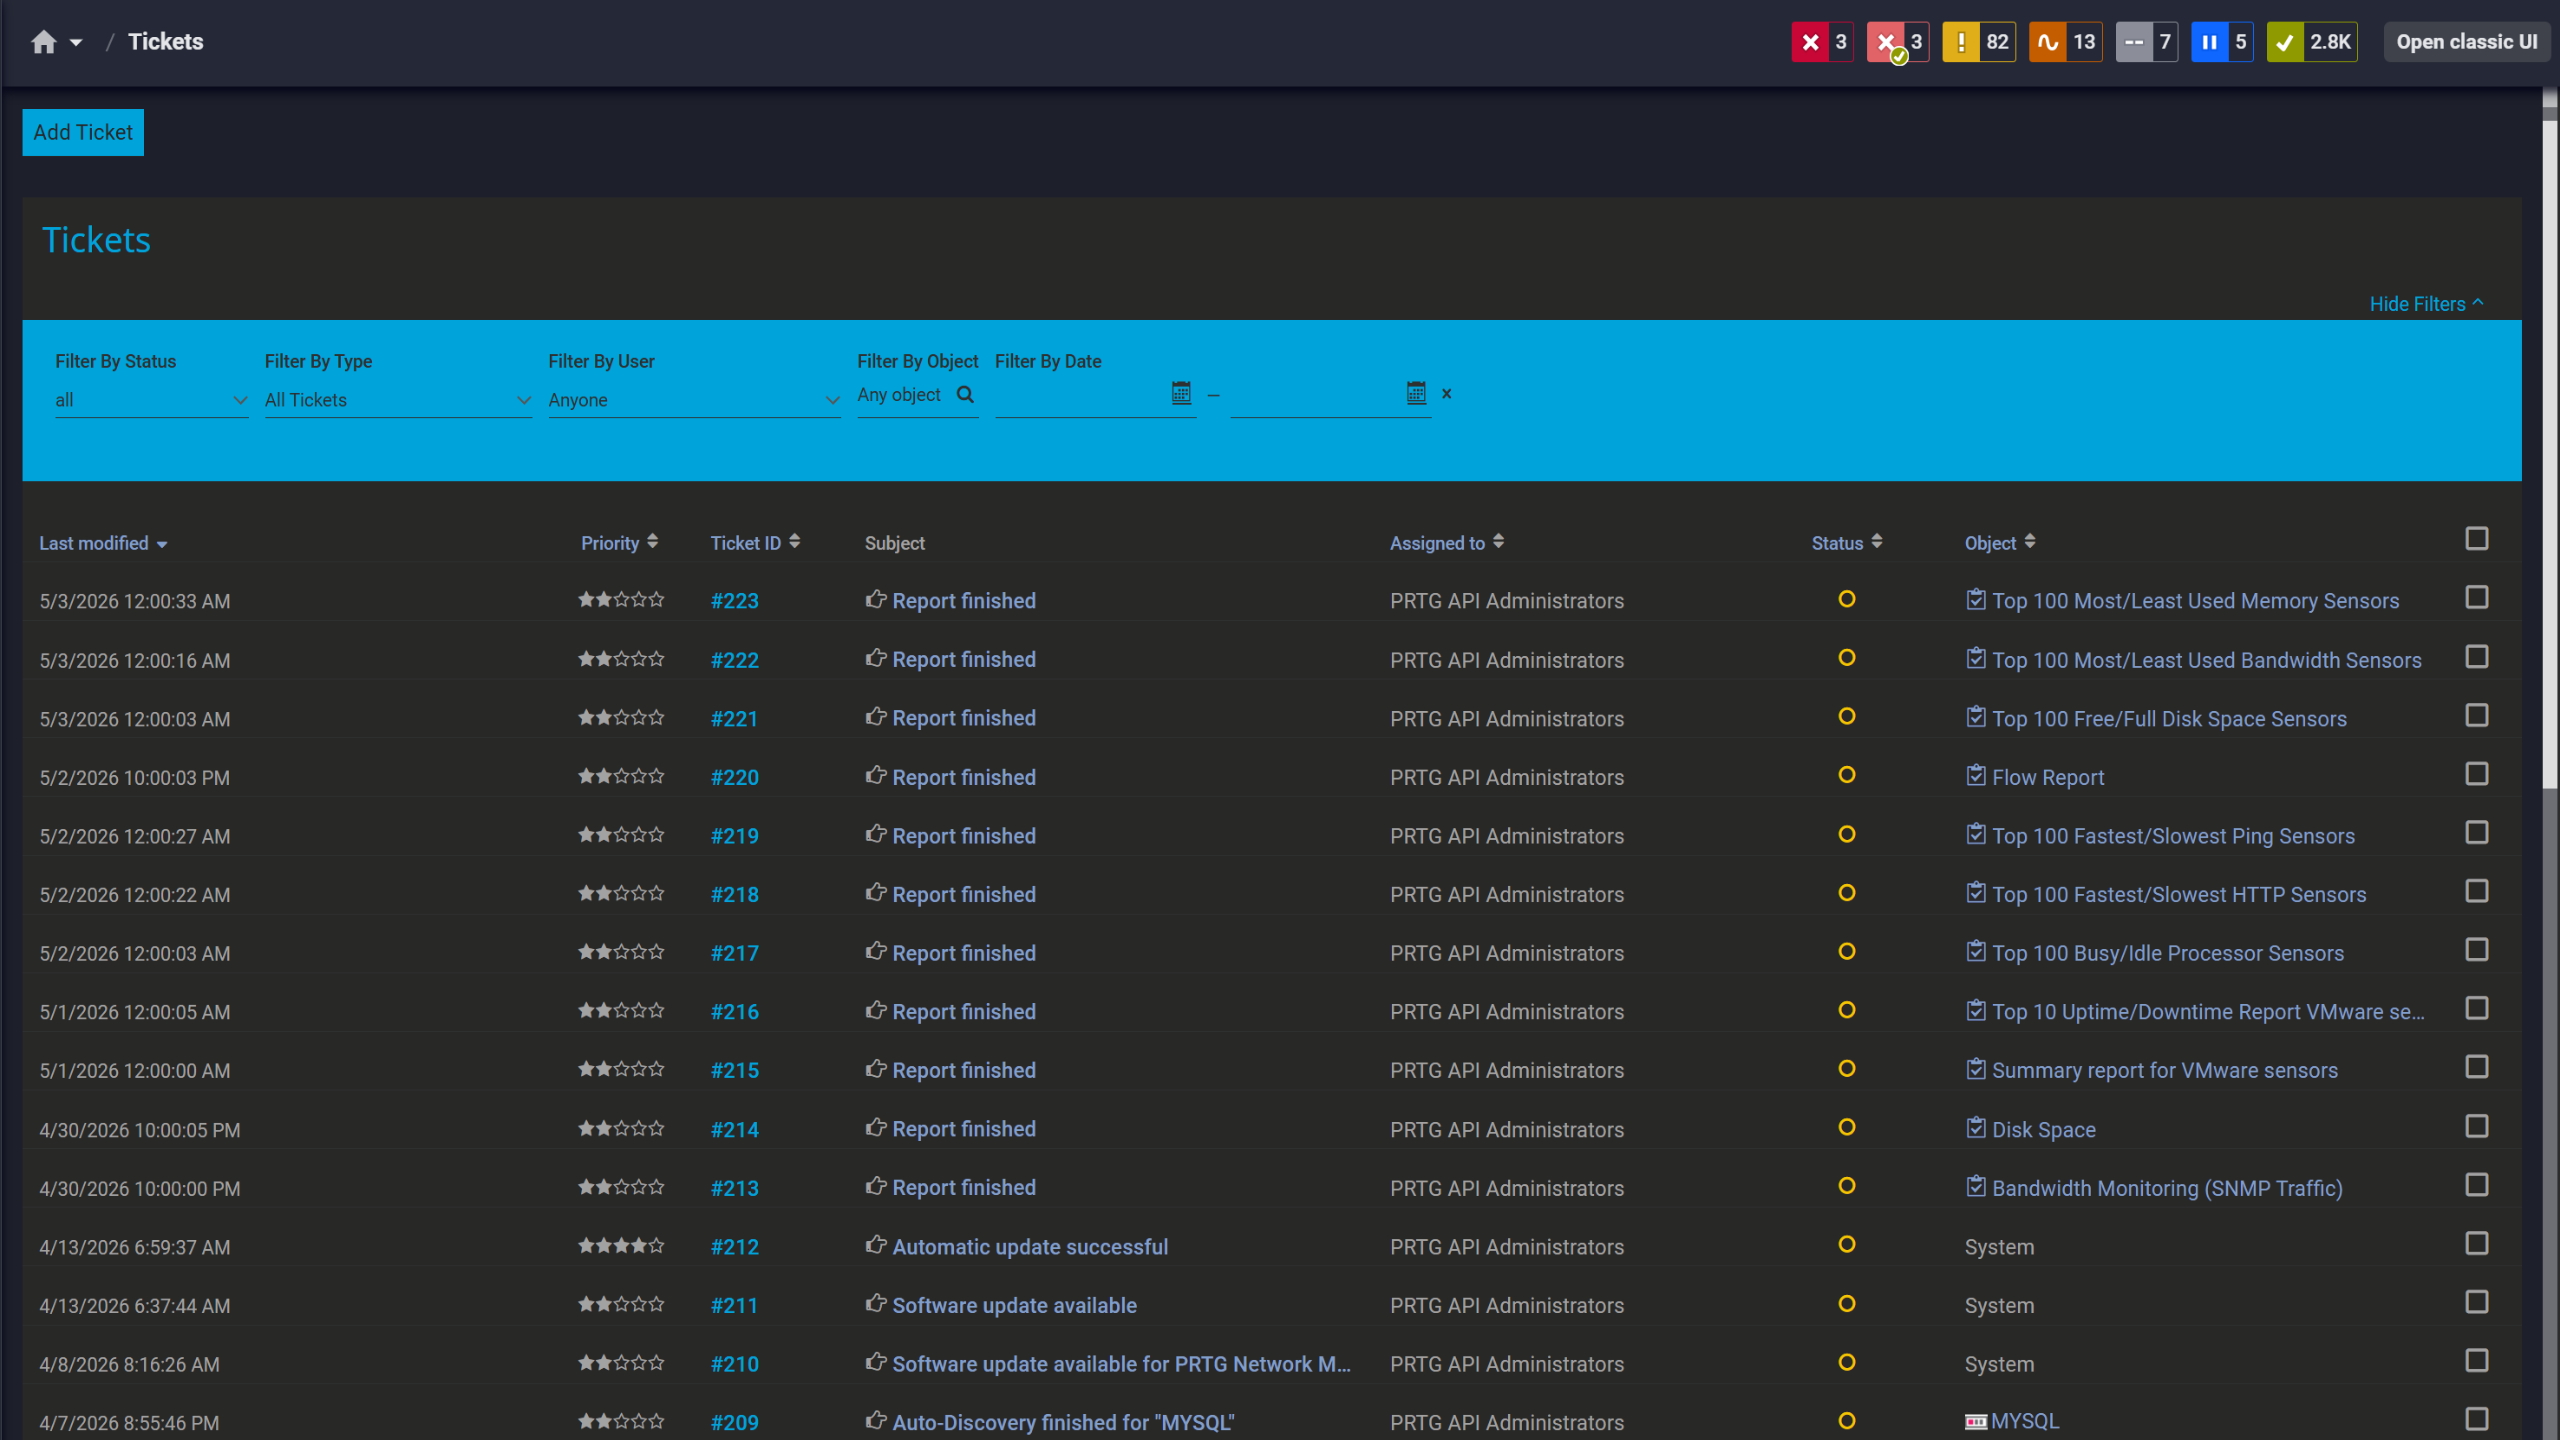
Tickets keep your team aligned
AD replication failures cause inconsistent directory data, authentication failures, and policy mismatches across sites, often going unnoticed until critical. In multi-site or distributed enterprises, these issues can cascade across branch offices before central IT even knows there's a problem. PRTG's Active Directory Replication Errors Sensor monitors replication status across naming contexts (Configuration, Schema, Domain) on all domain controllers. Detect replication lag or failures immediately, prevent data inconsistency and authentication issues.
• Monitor replication errors across Configuration, Schema, and Domain naming contexts
• Track replication lag between domain controllers
• Alert on failed directory updates or sync delays
• Identify topology issues before they affect site operations
• Prevent stale Group Policy or user credential mismatches
Start monitoring your infrastructure in minutes. No professional services, no complex configuration, no risk.
Malicious activity, privilege escalation, and unauthorized access attempts expose vulnerabilities and threaten sensitive data. These threats are often buried in event logs spread across multiple domain controllers, making manual detection nearly impossible for lean IT teams. PRTG monitors Windows Security Event Logs, tracking access management violations, privilege changes, and suspicious user activity across all DCs in one view. Detect cybersecurity threats early, support compliance audits, and reduce breach risk.
• Monitor failed access attempts and privilege escalation events
• Track group membership changes to sensitive groups (Domain Admins, Enterprise Admins)
• Alert on unusual user activity or after-hours authentication
• Audit Group Policy Object (GPO) modifications
• Forward event data to SIEM platforms for centralized threat detection without custom integrations

Scheduled reports, always on time
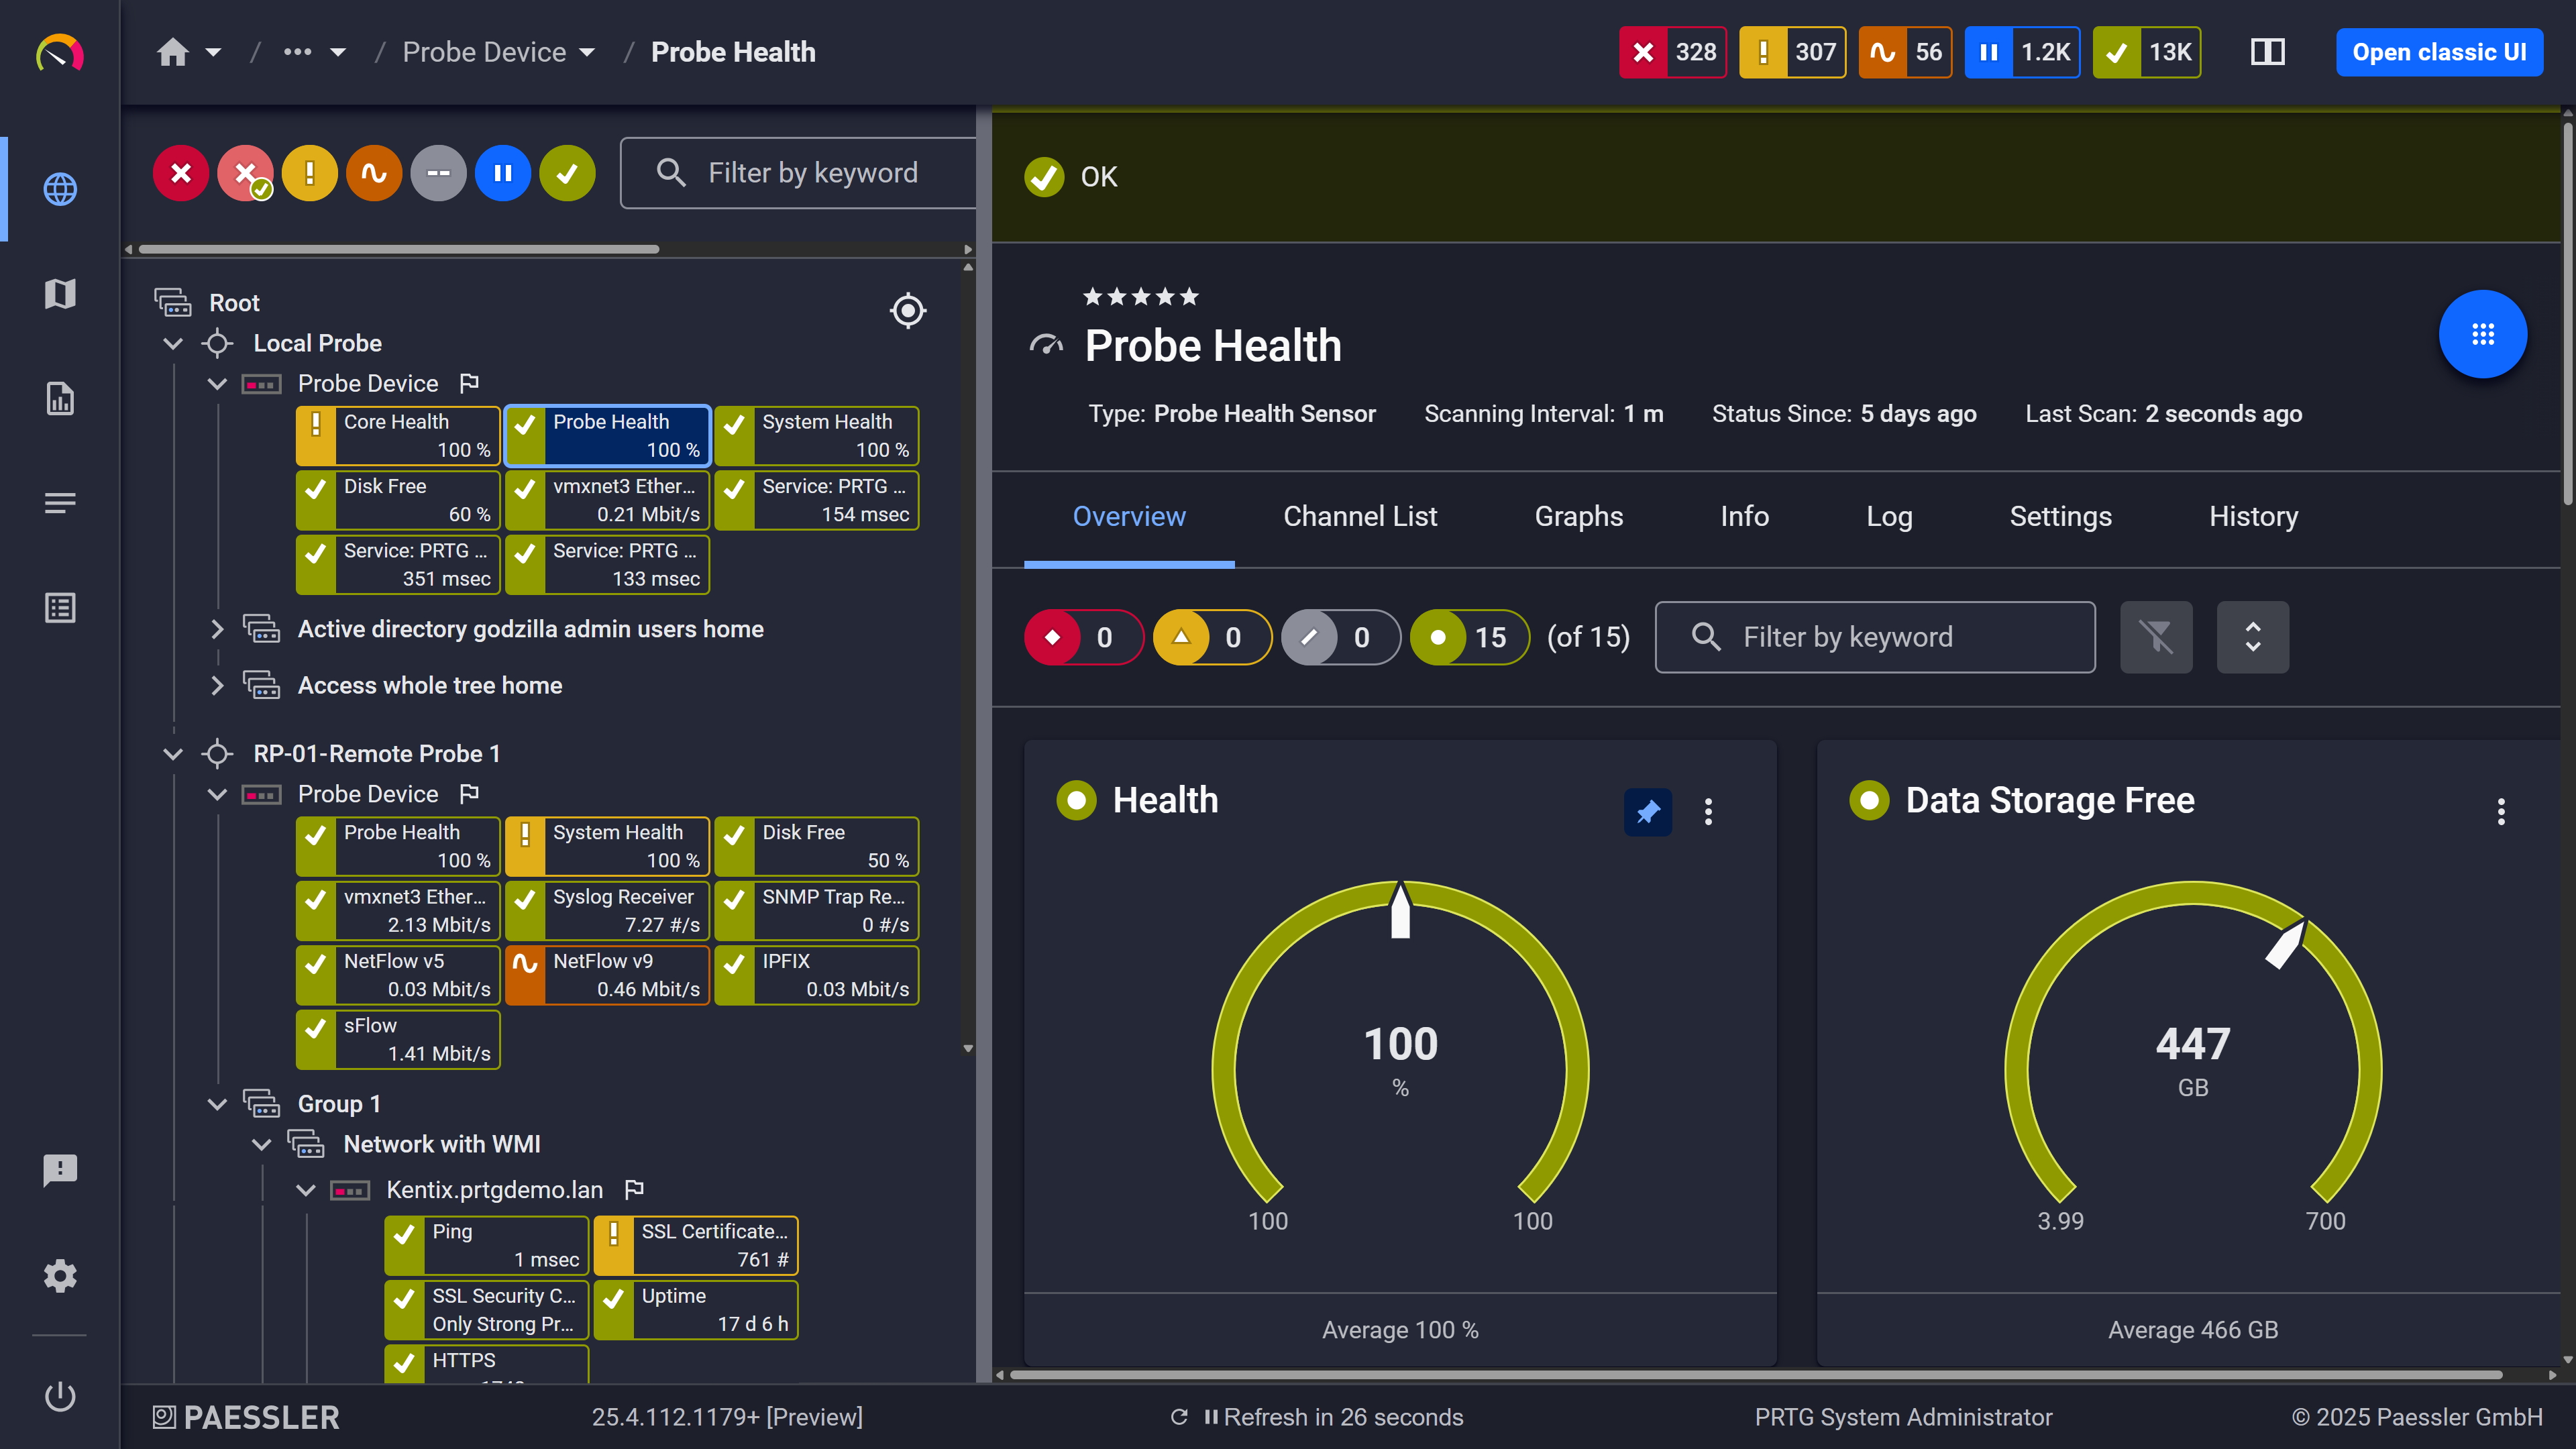
Probe health at a glance
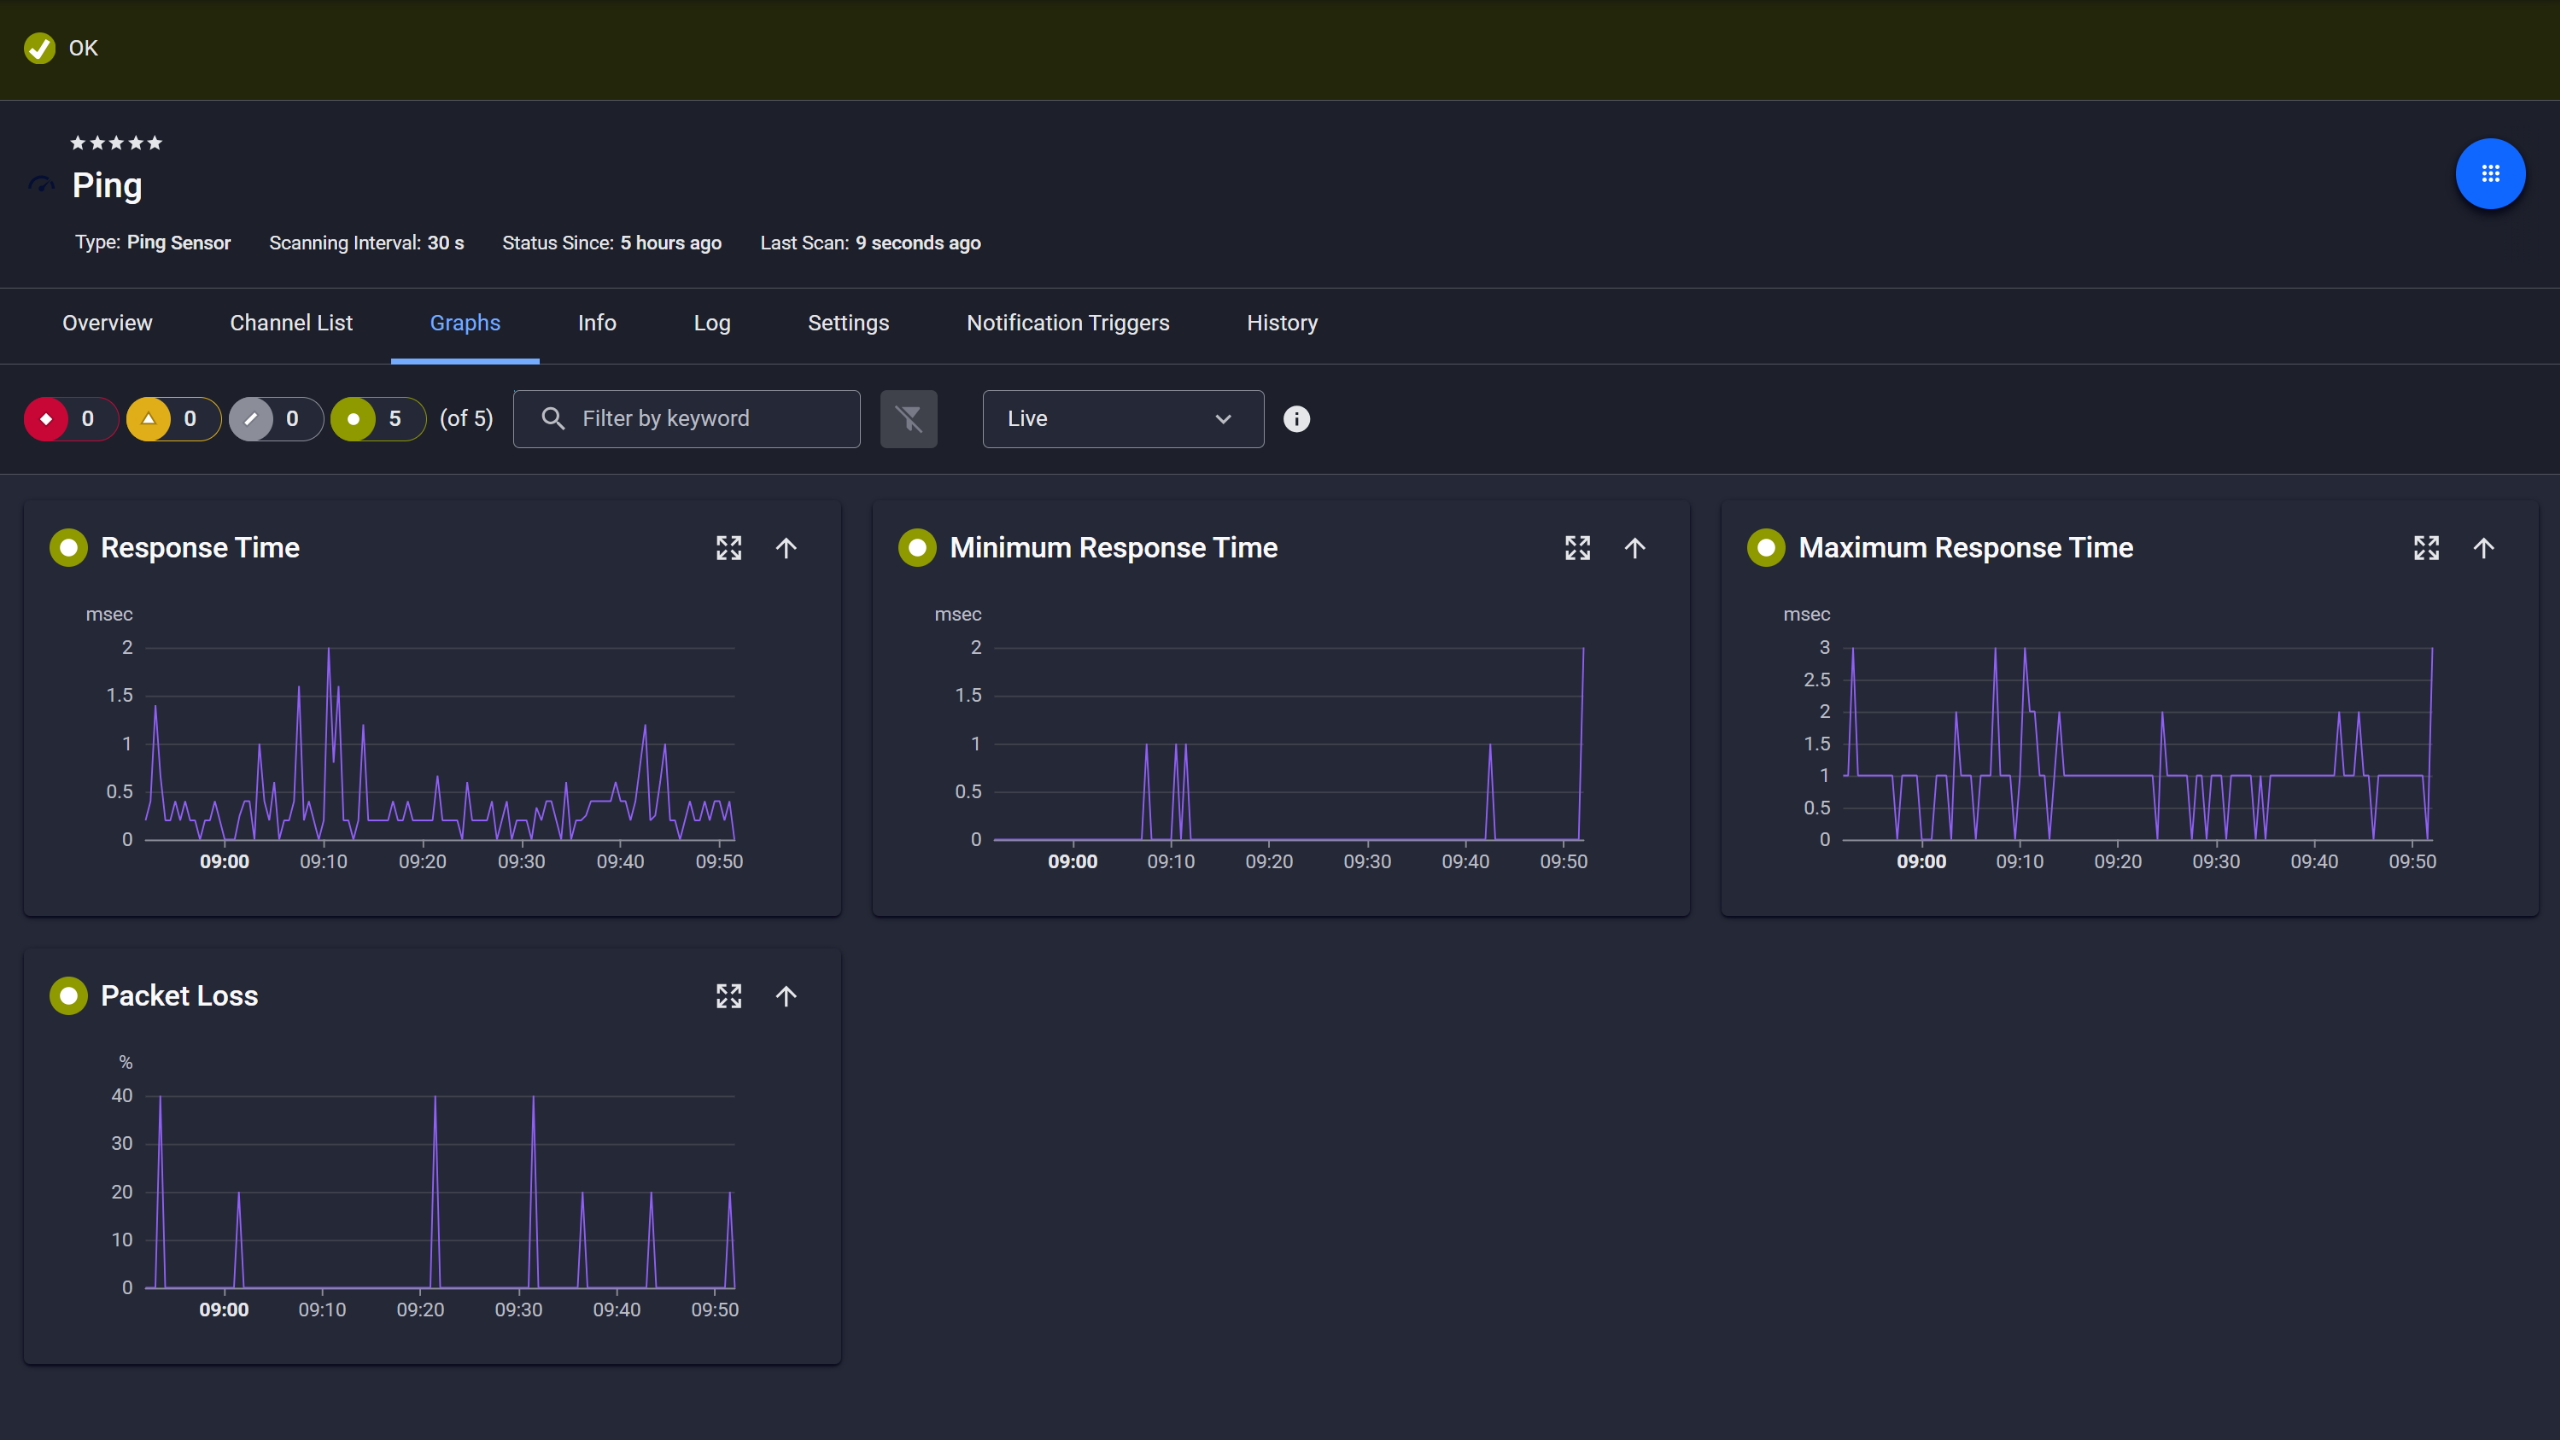
Ping response and packet loss
AD monitoring and troubleshooting typically require correlating data from Event Viewer, Performance Monitor, and replication tools across multiple domain controllers. PRTG centralizes AD metrics, event logs, and performance data into customizable dashboards with historical trends and alerting. Reduce mean time to resolution (MTTR),); empower teams with immediate visibility.
• Single-pane-of-glass view across all domain controllers
• Role-specific dashboards (security teams see threat events, infrastructure teams see DC performance, management sees uptime trends)
• Historical data for root cause analysis and trend identification
• Pre-configured alert templates for common AD issues
• No scripting or manual log parsing required
PRTG is a comprehensive Active Directory monitoring tool that uses WMI, Windows performance counters, and event log monitoring to provide full visibility into your Microsoft Active Directory environment. Pre-configured sensors track domain controller health, replication status, authentication services, and security events without requiring custom scripts or manual configuration. Auto-discovery detects your domain controllers and suggests relevant sensors automatically, so most teams are monitoring their full AD environment within an hour of installation. You can scale from a single-site deployment to complex multi-domain forests.
FEATURE | Without PRTG Without PRTG | With PRTG With PRTG |
|---|---|---|
Gather replication status across domain controllers | Without PRTG Log into each DC, run REPADMIN /SHOWREPL for each naming context, manually parse output for errors, export to spreadsheet for multi-DC tracking | With PRTG Automated sensor checks all DCs and naming contexts, centralized dashboard, instant alerts on failures |
Track authentication performance and failures | Without PRTG Review Event Viewer logs on each DC, correlate across sites | With PRTG Near real-time monitoring, pre-filtered event log sensors, unified view |
Monitor domain controller health and resource utilization | Without PRTG Open Performance Monitor on each DC, manually set counters | With PRTG Auto-configured WMI sensors, historical trends, threshold alerts |
Identify security threats and unauthorized access | Without PRTG Search Security logs manually, export to spreadsheets | With PRTG Event log filtering, SIEM integration, automated alerting |
Troubleshoot Group Policy application issues | Without PRTG Check event logs, run result, correlate timing | With PRTG Monitor GPO processing events, replication status, DNS resolution |
Choose the PRTG Network Monitor subscription that's best for you.
| License Name | License description | Price | License Details | Get started | Pricing Details | |
|---|---|---|---|---|---|---|
| PRTG 500 | $200 | per month paid annually | Buy nowBuy now | Enough to monitor multiple aspects of 50 devices | ||
| PRTG 1000 | $358 | per month paid annually | Buy nowBuy now | Enough to monitor multiple aspects of 100 devices | ||
| PRTG 2500 | $742 | per month paid annually | Buy nowBuy now | Enough to monitor multiple aspects of 250 devices | ||
| PRTG 5000 | $1,300 | per month paid annually | Buy nowBuy now | Enough to monitor multiple aspects of 500 devices | ||
| PRTG 10000 | $1,642 | per month paid annually | Buy nowBuy now | Enough to monitor multiple aspects of 1000 devices |

Yes. PRTG monitors on-premises Active Directory and can track Azure AD Connect synchronization status and hybrid identity components. You can monitor both your on-premises domain controllers and cloud-based Azure AD services from a single platform.
PRTG requires Windows domain credentials with read access to WMI, performance counters, and event logs on domain controllers. For replication monitoring, the account needs permissions to query Directory Service replication metadata. No schema modifications or Domain Admin rights are required.
Yes. PRTG monitors failed logon attempts, password policy violations, and authentication errors in real time. You can set thresholds to alert when failed attempts spike, allowing you to investigate potential brute-force attacks or credential issues before users are locked out.
PRTG's Active Directory Replication Errors sensor runs on each domain controller, checking replication status with all configured partners regardless of physical location. For multi-site deployments, this means you can detect site link failures, bridgehead server issues, and WAN connectivity problems that cause replication lag between branch offices and headquarters. The sensor tracks replication metadata including last sync success, consecutive failures, and pending operations for each partner connection. You get per-site visibility into which sites are syncing properly and which are experiencing delays or failures, all without logging into each location's DCs or running REPADMIN manually at each site.
Yes. PRTG can forward event data, alerts, and syslog messages to SIEM platforms for centralized security analysis. This allows you to correlate Active Directory events (failed logons, privilege escalations, GPO changes) with broader security telemetry for threat detection and compliance reporting.
Absolutely. PRTG monitors DNS service availability, query response times, and zone transfer status on Windows DNS servers that support Active Directory. Since AD authentication depends on DNS for service location (SRV records), monitoring DNS health is critical for preventing authentication failures. PRTG tracks DNS service status, query latency, and zone replication to ensure your directory services remain available.
PRTG immediately alerts you when a domain controller becomes unavailable, tracking uptime and service status. Since PRTG monitors all domain controllers independently, losing one DC doesn't affect monitoring of others, and you maintain visibility into your AD environment during outages.
After installing PRTG and running auto-discovery, you can have domain controllers monitored in minutes. PRTG automatically suggests Active Directory sensors based on detected services, and you can deploy pre-configured templates for consistent monitoring across multiple DCs. No scripting required, no manual configuration of each sensor. Most teams are fully operational with comprehensive AD monitoring within an hour.
Network Monitoring Software – Version 26.1.116.1532 (February 9th, 2026)
Download for Windows and cloud-based version PRTG Hosted Monitor available
English, German, Spanish, French, Portuguese, Dutch, Russian, Japanese, and Simplified Chinese
Network devices, bandwidth, servers, applications, virtual environments, remote systems, IoT, and more
Choose the PRTG Network Monitor subscription that's best for you


