Custom alerts and data visualization let you quickly identify and prevent website issues.
Are your customers or employees complaining about a slow website or service? This can be caused by a connectivity issue on their end, an unusually high server load, or not enough bandwidth resources.
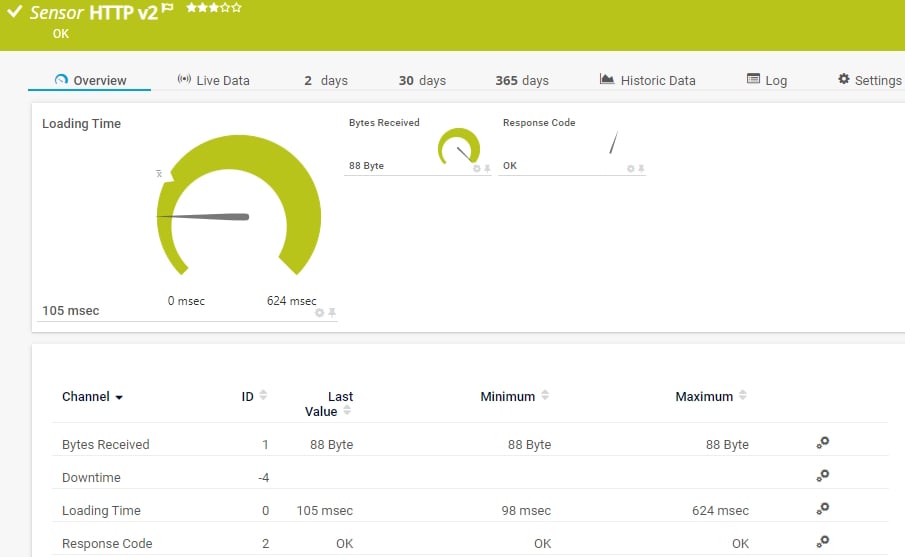
To determine the root cause of the issue, you must assess the symptoms. Is the web page really that slow? How much time does it need to load? It’s easy to get the answers with the HTTP v2 sensor included with PRTG.
It helps you precisely measure the load time of a web page and analyze dependencies to see if the problem stems from your web server or your hosting provider.
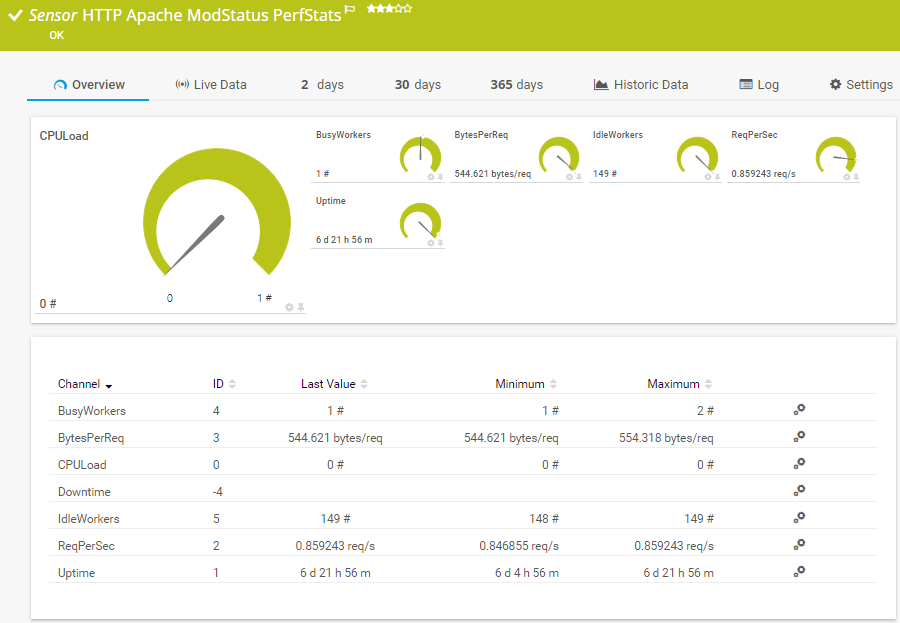
It is not enough to know if your web server is up or down. To ensure performance and availability, you need information like the CPU load on the web server, how many resources are available to handle incoming requests, the number of requests per second, and more.
If you run an Apache web server, for example, you can get all these metrics with the HTTP Apache ModStatus PerfStats sensor.
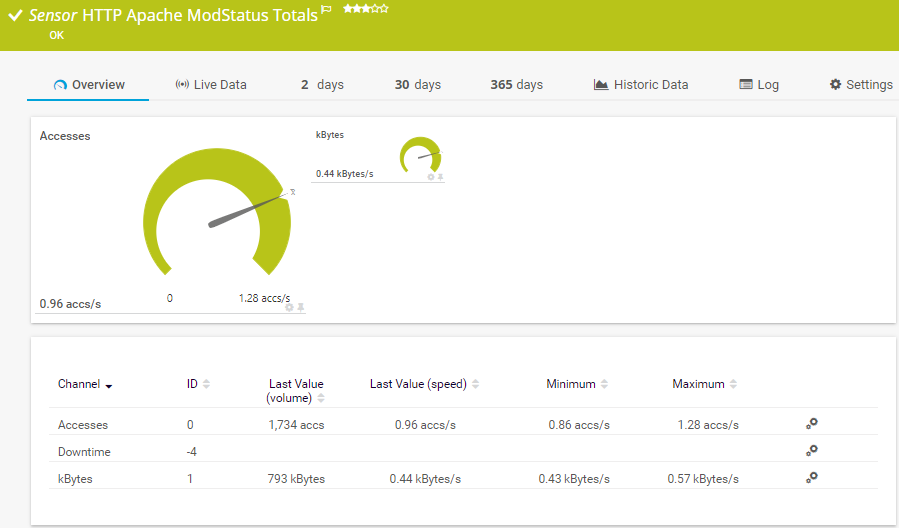
Combine it with the HTTP Apache ModStatus Totals sensor to get additional data like the total number of accesses or the amount of data transferred in a given time period.
The complex routing nature of the internet means a website that is reachable from your physical location may be unavailable elsewhere in the world, which can result in service outages and revenue loss from customers in the affected region.
Avoid costly downtime, ensure worldwide availability of your websites, and get timely alerts of interruptions by using the Cloud HTTP v2 sensor.
This sensor monitors the loading times and availability of a web page from four continents around the globe. You set the URL you want to monitor, provide the source locations, and PRTG does the rest for you.
You can use HTTP to push data from IoT devices to PRTG and use our various push sensors to process and display this information. In fact, we used Sigfox-enabled hardware sensors and the HTTP IoT Push Data Advanced sensor of PRTG to build a custom environmental monitoring solution for our Paessler headquarters in Nuremberg.
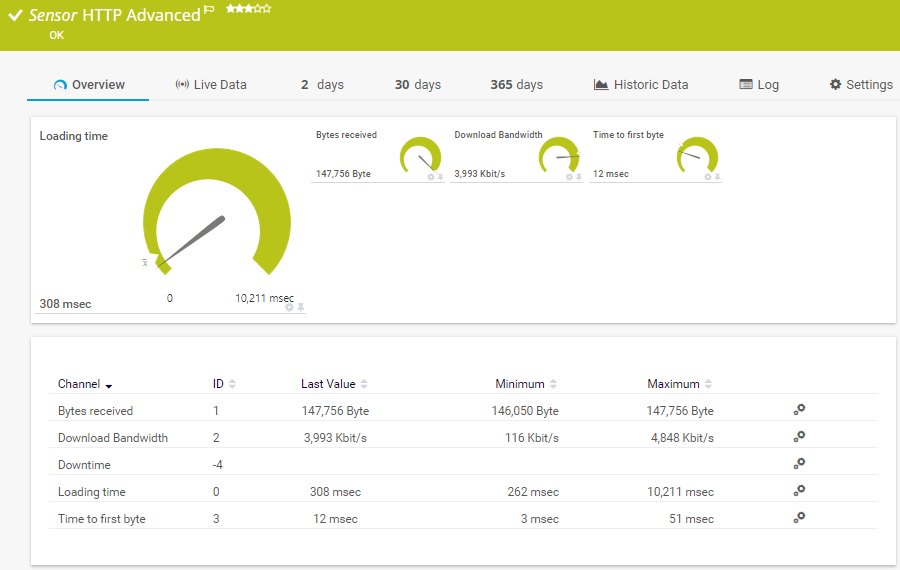
To monitor the source code of a web page, you can use the HTTP Advanced sensor. This flexible sensor supports authentication and content checks.
You can set it to trigger a notification if the content of a HTML file changes, for example, or to alert you if a specific keyword is present or missing.
Diagnose network issues by continuously tracking your web services, web servers, web applications, websites, and other endpoints via HTTP. Show web performance and availability, response times, HTTP status codes, DNS resolution, SSL certificate expiration dates, and other key metrics in real time. Visualize monitoring data in clear graphs and dashboards to identify problems more easily. Gain the overview you need to troubleshoot HTTP issues.
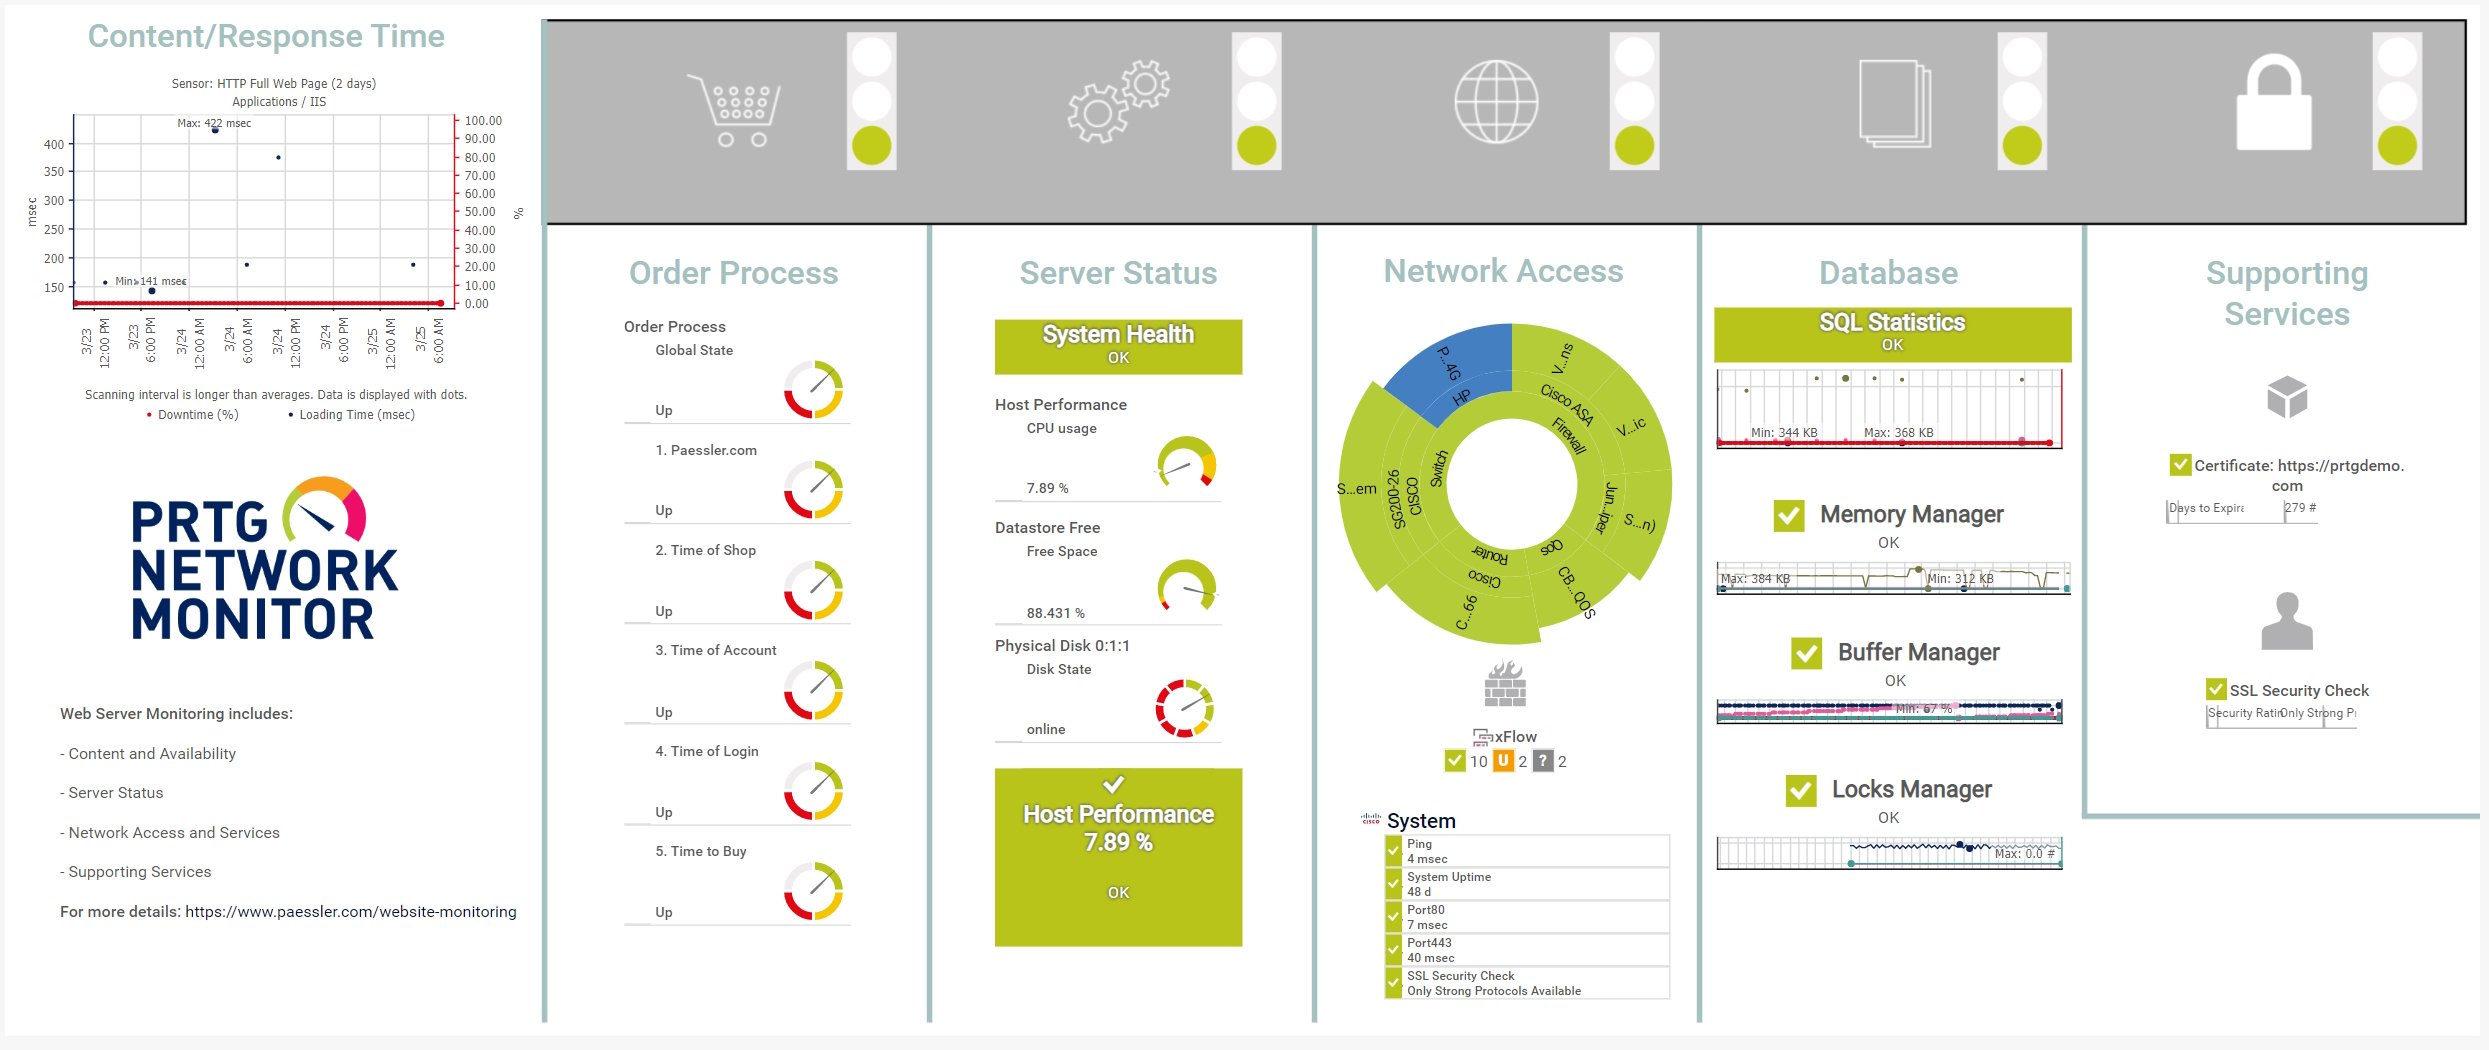
Custom dashboard for HTTP web server & website monitoring

Device tree view of the complete monitoring setup

Custom PRTG dashboard for keeping an eye on the entire IT infrastructure

Live traffic data graph in PRTG
“All-around winning
network monitor”
“The real beauty of PRTG is the endless possibilities it offers”
“PRTG Network Monitor
is very hard to beat”
PRTG comes with more than 250 preconfigured sensors for a variety of use cases, services, and devices from the most popular manufacturers and providers.
With our PRTG web server (HTTP) sensors you can monitor HTTP response codes, load times, HTTP server performance statistics, and more.
PRTG provides you with one central monitoring solution for all your needs, be it your HTTP content, your web servers – or your entire network.
Enjoy a quick overview of your whole IT infrastructure via our different user interfaces for web, desktop, or smartphone, and create custom dashboards with our easy-to-use drag-and-drop editor.
You can do any kind of HTTP monitoring with PRTG: availability monitoring (Is my web server up and running?), HTTP content monitoring (Are there unwanted HTML content changes?), web server performance monitoring (How are response and load times of my web pages?) and even HTTP/S security monitoring (Are my SSL certificates still valid?).
PRTG comes with more than 250 native sensor types for monitoring your entire on-premises, cloud, and hybrid cloud environment out of the box. Check out some examples below!
The HTTP v2 sensor monitors a web server. It can show the following:
The HTTP Advanced sensor monitors the source code of a web page using HTTP. It supports authentication, content checks, and other advanced parameters. It can show the following:
The HTTP Apache ModStatus PerfStats sensor monitors performance statistics of an Apache web server via mod_status over HTTP. It can show the following:
The HTTP Apache ModStatus Totals sensor monitors the activity of an Apache web server using mod_status over HTTP. It can show the following:
See the PRTG Manual for a list of all available sensor types.
Real-time notifications mean faster troubleshooting so that you can act before more serious issues occur.

PRTG helps ensure your servers are available and operating at peak performance, and that content is delivered in the shortest time possible – all crucial for the success of your business.
You no longer have to invest in different monitoring tools from multiple vendors.
Do it all with our all-in-one HTTP monitor, saving you effort and money. And ensuring that your web servers perform well and deliver content in the shortest time possible.
Custom alerts and data visualization let you quickly identify and prevent website issues.
PRTG is set up in a matter of minutes and can be used on a wide variety of mobile devices.


“Excellent tool for detailed monitoring. Alarms and notifications work greatly. Equipment addition is straight forward and server initial setup is very easy. ...feel safe to purchase it if you intend to monitor a large networking landscape.”
Partnering with innovative IT vendors, Paessler unleashes synergies to create
new and additional benefits for joined customers.
Combining PRTG’s broad monitoring feature set with IP Fabric’s automated network assurance creates a new level of network visibility and reliability.
Paessler and Plixer provide a complete solution adding flow and metadata analysis to a powerful network monitoring tool.
With ScriptRunner Paessler integrates a powerful event automation platform into PRTG Network Monitor.
Real-time notifications mean faster troubleshooting so that you can act before more serious issues occur.
Network Monitoring Software – Version 26.1.116.1532 (February 9th, 2026)
Download for Windows and cloud-based version PRTG Hosted Monitor available
English, German, Spanish, French, Portuguese, Dutch, Russian, Japanese, and Simplified Chinese
Network devices, bandwidth, servers, applications, virtual environments, remote systems, IoT, and more
Choose the PRTG Network Monitor subscription that's best for you


HTTP stands for Hypertext Transfer Protocol. It is the foundational communication protocol used on the World Wide Web to transfer data between a client (such as a web browser) and a server. HTTP enables the fetching of resources, such as HTML documents, images, videos, and other files, from a server to display on a user's device.
How it works
HTTP methods
Each HTTP transaction consists of:
The term HTTP Monitor can have various meanings. You can use it for a software that can monitor and analyze the performance and behavior of HTTP connections, like those between web servers and clients (web browsers) that communicate through the Hypertext Transfer Protocol (HTTP). It can also be applied to tools that are used to monitor the parameters of an HTTP server, for example, uptime, system load, or available resources, on an Apache HTTP Server instance.
In both of these contexts, HTTP monitoring tools can be used to assess server availability and content delivery performance, ensuring that the users who visit your websites have the best experience possible. However, the term can also be loosely applied to tools that use HTTP to monitor something else. For example, a tool that uses HTTP to fetch content from a server and acts on that information.
In the end, it doesn't matter how you define HTTP monitoring: PRTG has a sensor for every HTTP monitoring task.
There are different reasons why it is a good thing to invest in an HTTP monitoring software, for example:
There are 5 main features you need to look out for when you choose an HTTP monitoring tool. With PRTG, you get all of them:
In PRTG, “sensors” are the basic monitoring elements. One sensor usually monitors one measured value in your network, for example the traffic of a switch port, the CPU load of a server, or the free space on a disk drive. On average, you need about 5-10 sensors per device or one sensor per switch port.
Paessler conducted trials in over 600 IT departments worldwide to tune its network monitoring software closer to the needs of sysadmins. The result of the survey: over 95% of the participants would recommend PRTG – or already have.

Paessler PRTG is used by companies of all sizes. Sysadmins love PRTG because it makes their job a whole lot easier.
Bandwidth, servers, virtual environments, websites, VoIP services – PRTG keeps an eye on your entire network.
Everyone has different monitoring needs. That’s why we let you try PRTG for free.