- English
- Deutsch
- Español
- Français
- Italiano
- Português
Apache web server monitoring means tracking availability, performance, and resource usage continuously, so you catch problems before they affect users. The key metrics are HTTP response codes, response times, worker process utilization, CPU and memory load, throughput, and SSL certificate validity. PRTG collects all of these through multiple methods, giving you real-time observability into server performance, HTTP request handling, and resource consumption without requiring agents or complex configuration. Using Apache's built-in mod_status module, PRTG automatically pulls performance statistics including CPU load, worker processes, request throughput, and response times and alerts you instantly on degradation, capacity bottlenecks, or downtime.
What PRTG monitors: Apache HTTP Server (including Apache 2.x and open-source variants), response times, uptime/availability, CPU and memory usage, worker threads (busy and idle), requests per second, bytes per request, throughput, error rates, SSL/TLS certificate validation and expiration tracking (via SSL Security Check sensor), and access logs.

Web server downtime means lost revenue, frustrated users, and urgent late-night troubleshooting. Without continuous Apache monitoring, you're reacting to outages instead of preventing them. PRTG monitors Apache availability 24/7, checking HTTP response codes, connection times, and mod_status metrics to catch issues before they escalate. Get instant alerts when your web server stops responding, performance degrades, or worker processes max out.
When Apache slows down, you need answers fast. PRTG's mod_status sensors deliver real-time performance metrics showing exactly where bottlenecks occur: maxed-out worker processes, high CPU load, or excessive HTTP request handling times. Historical data lets you correlate performance issues with traffic spikes, application deployments, or infrastructure changes.
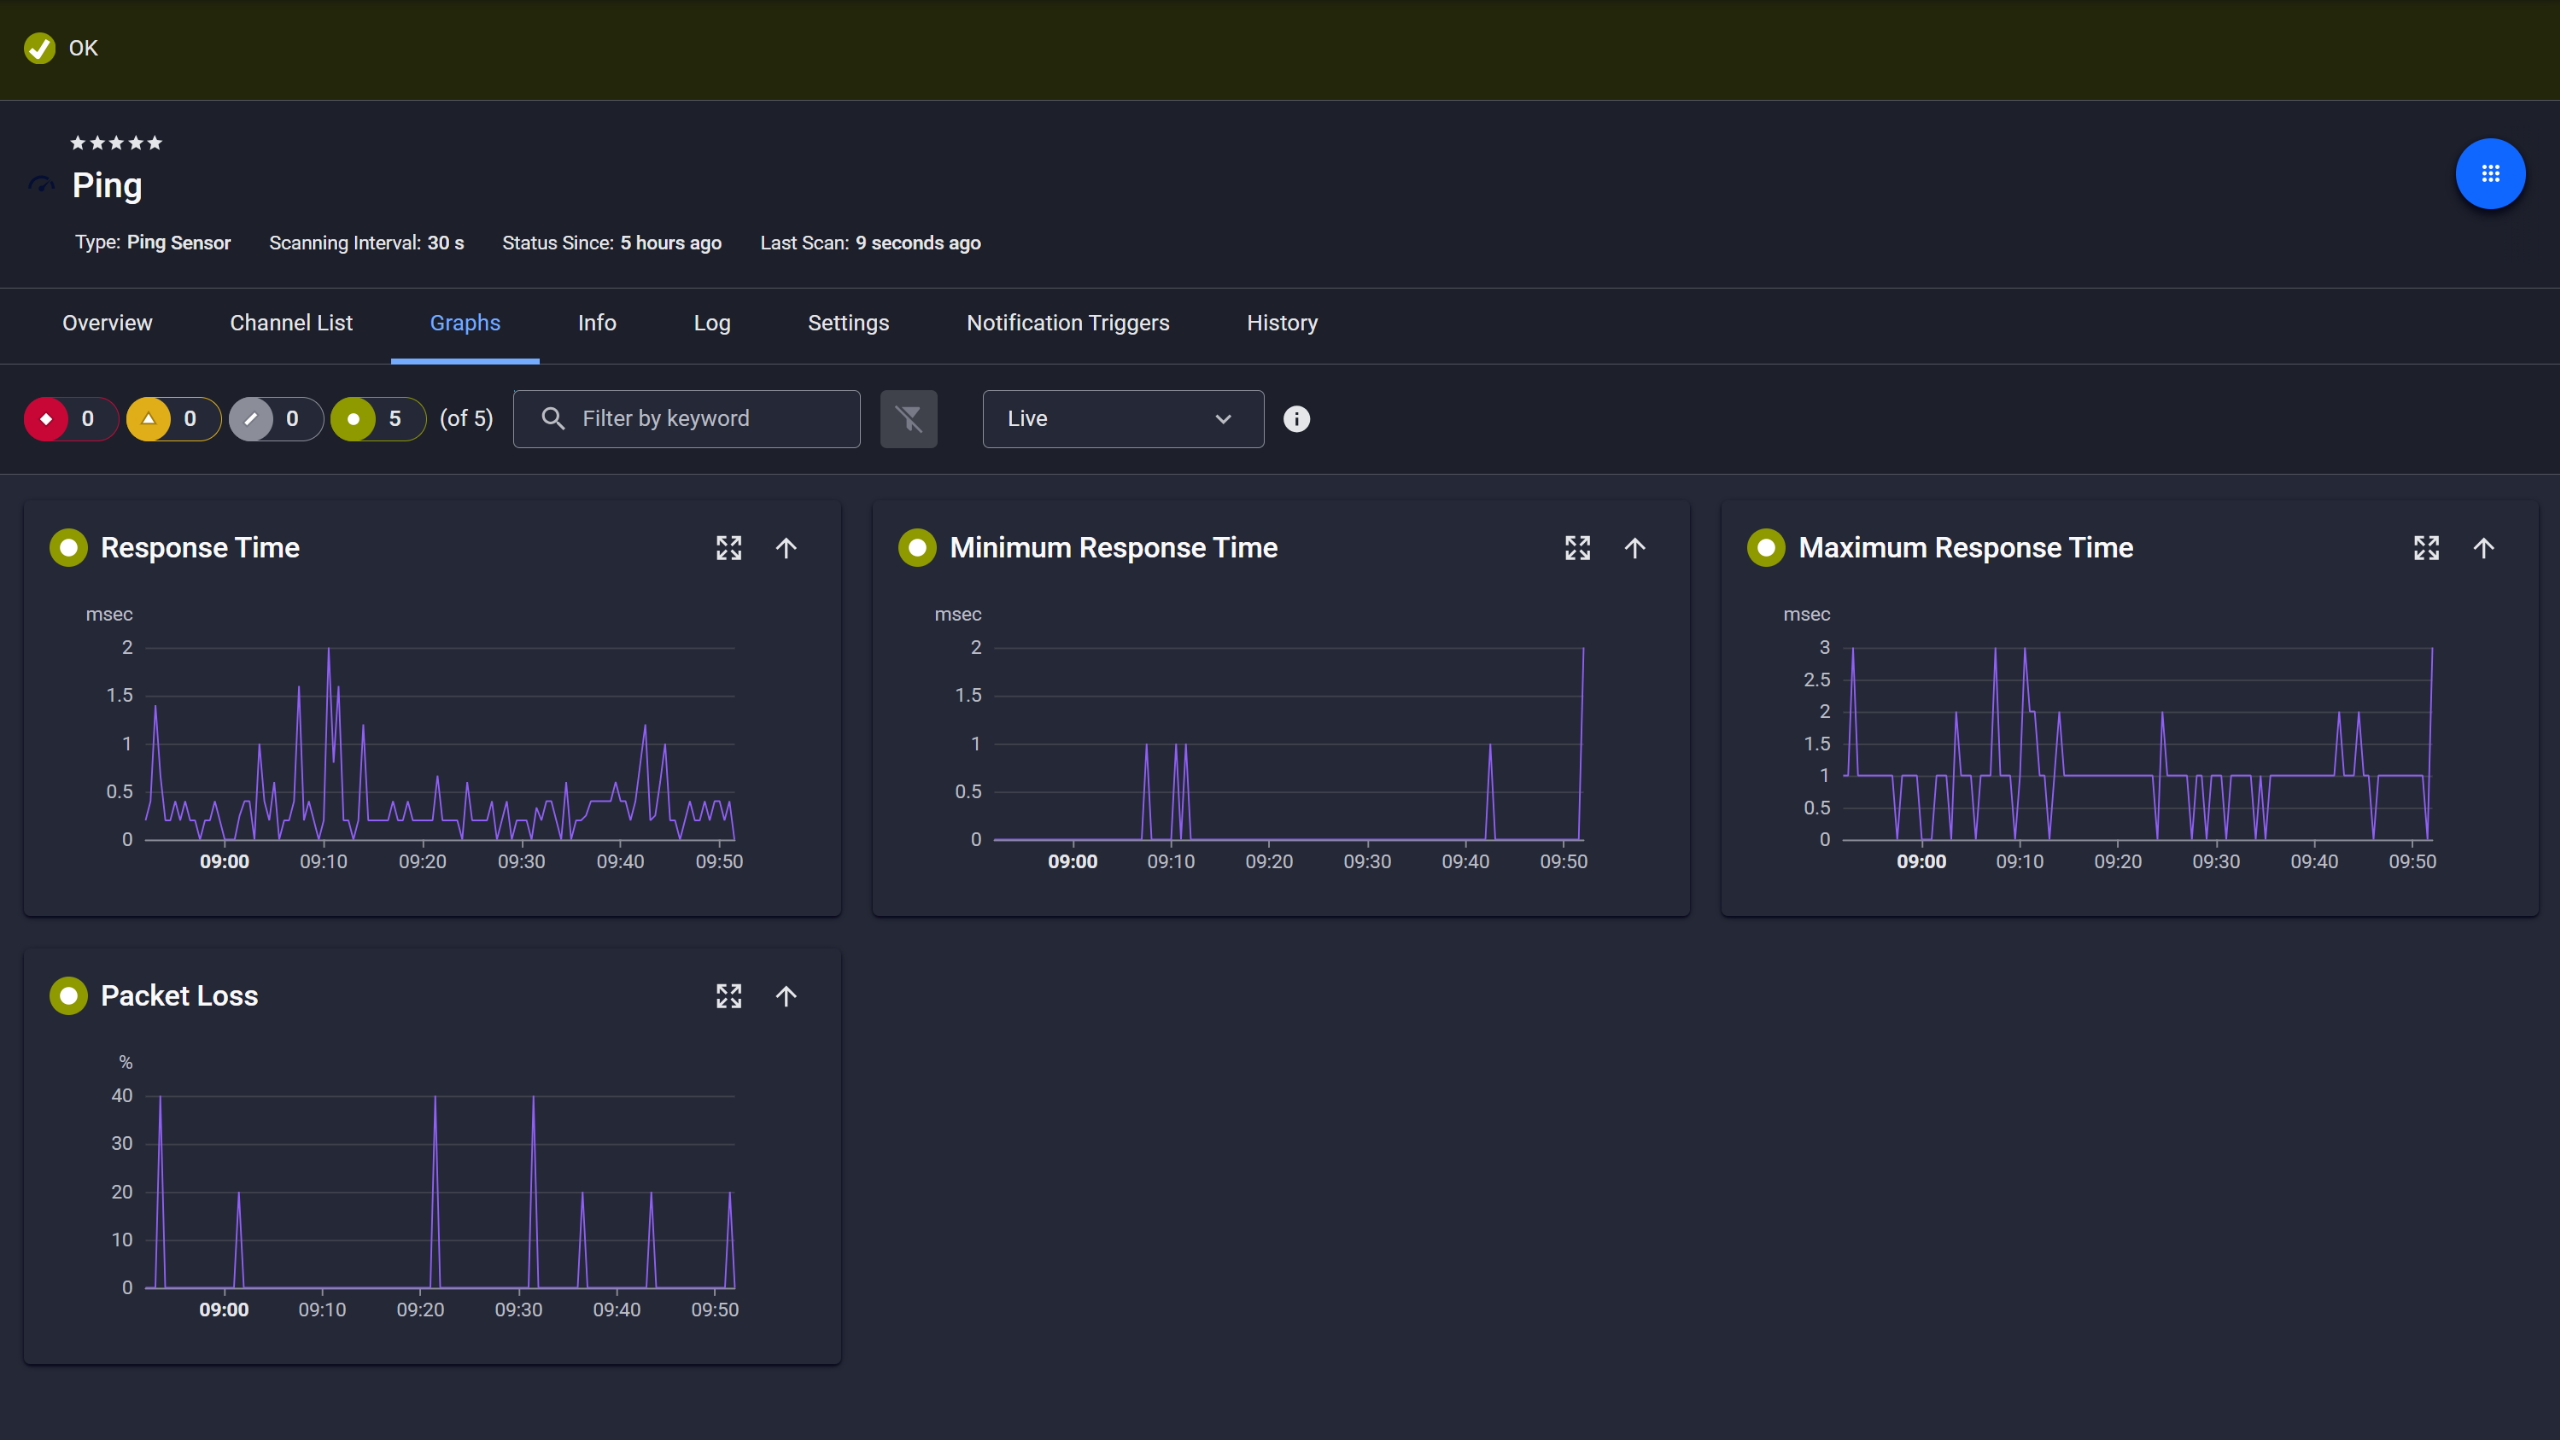
Ping response and packet loss

Live graphs, real-time performance data
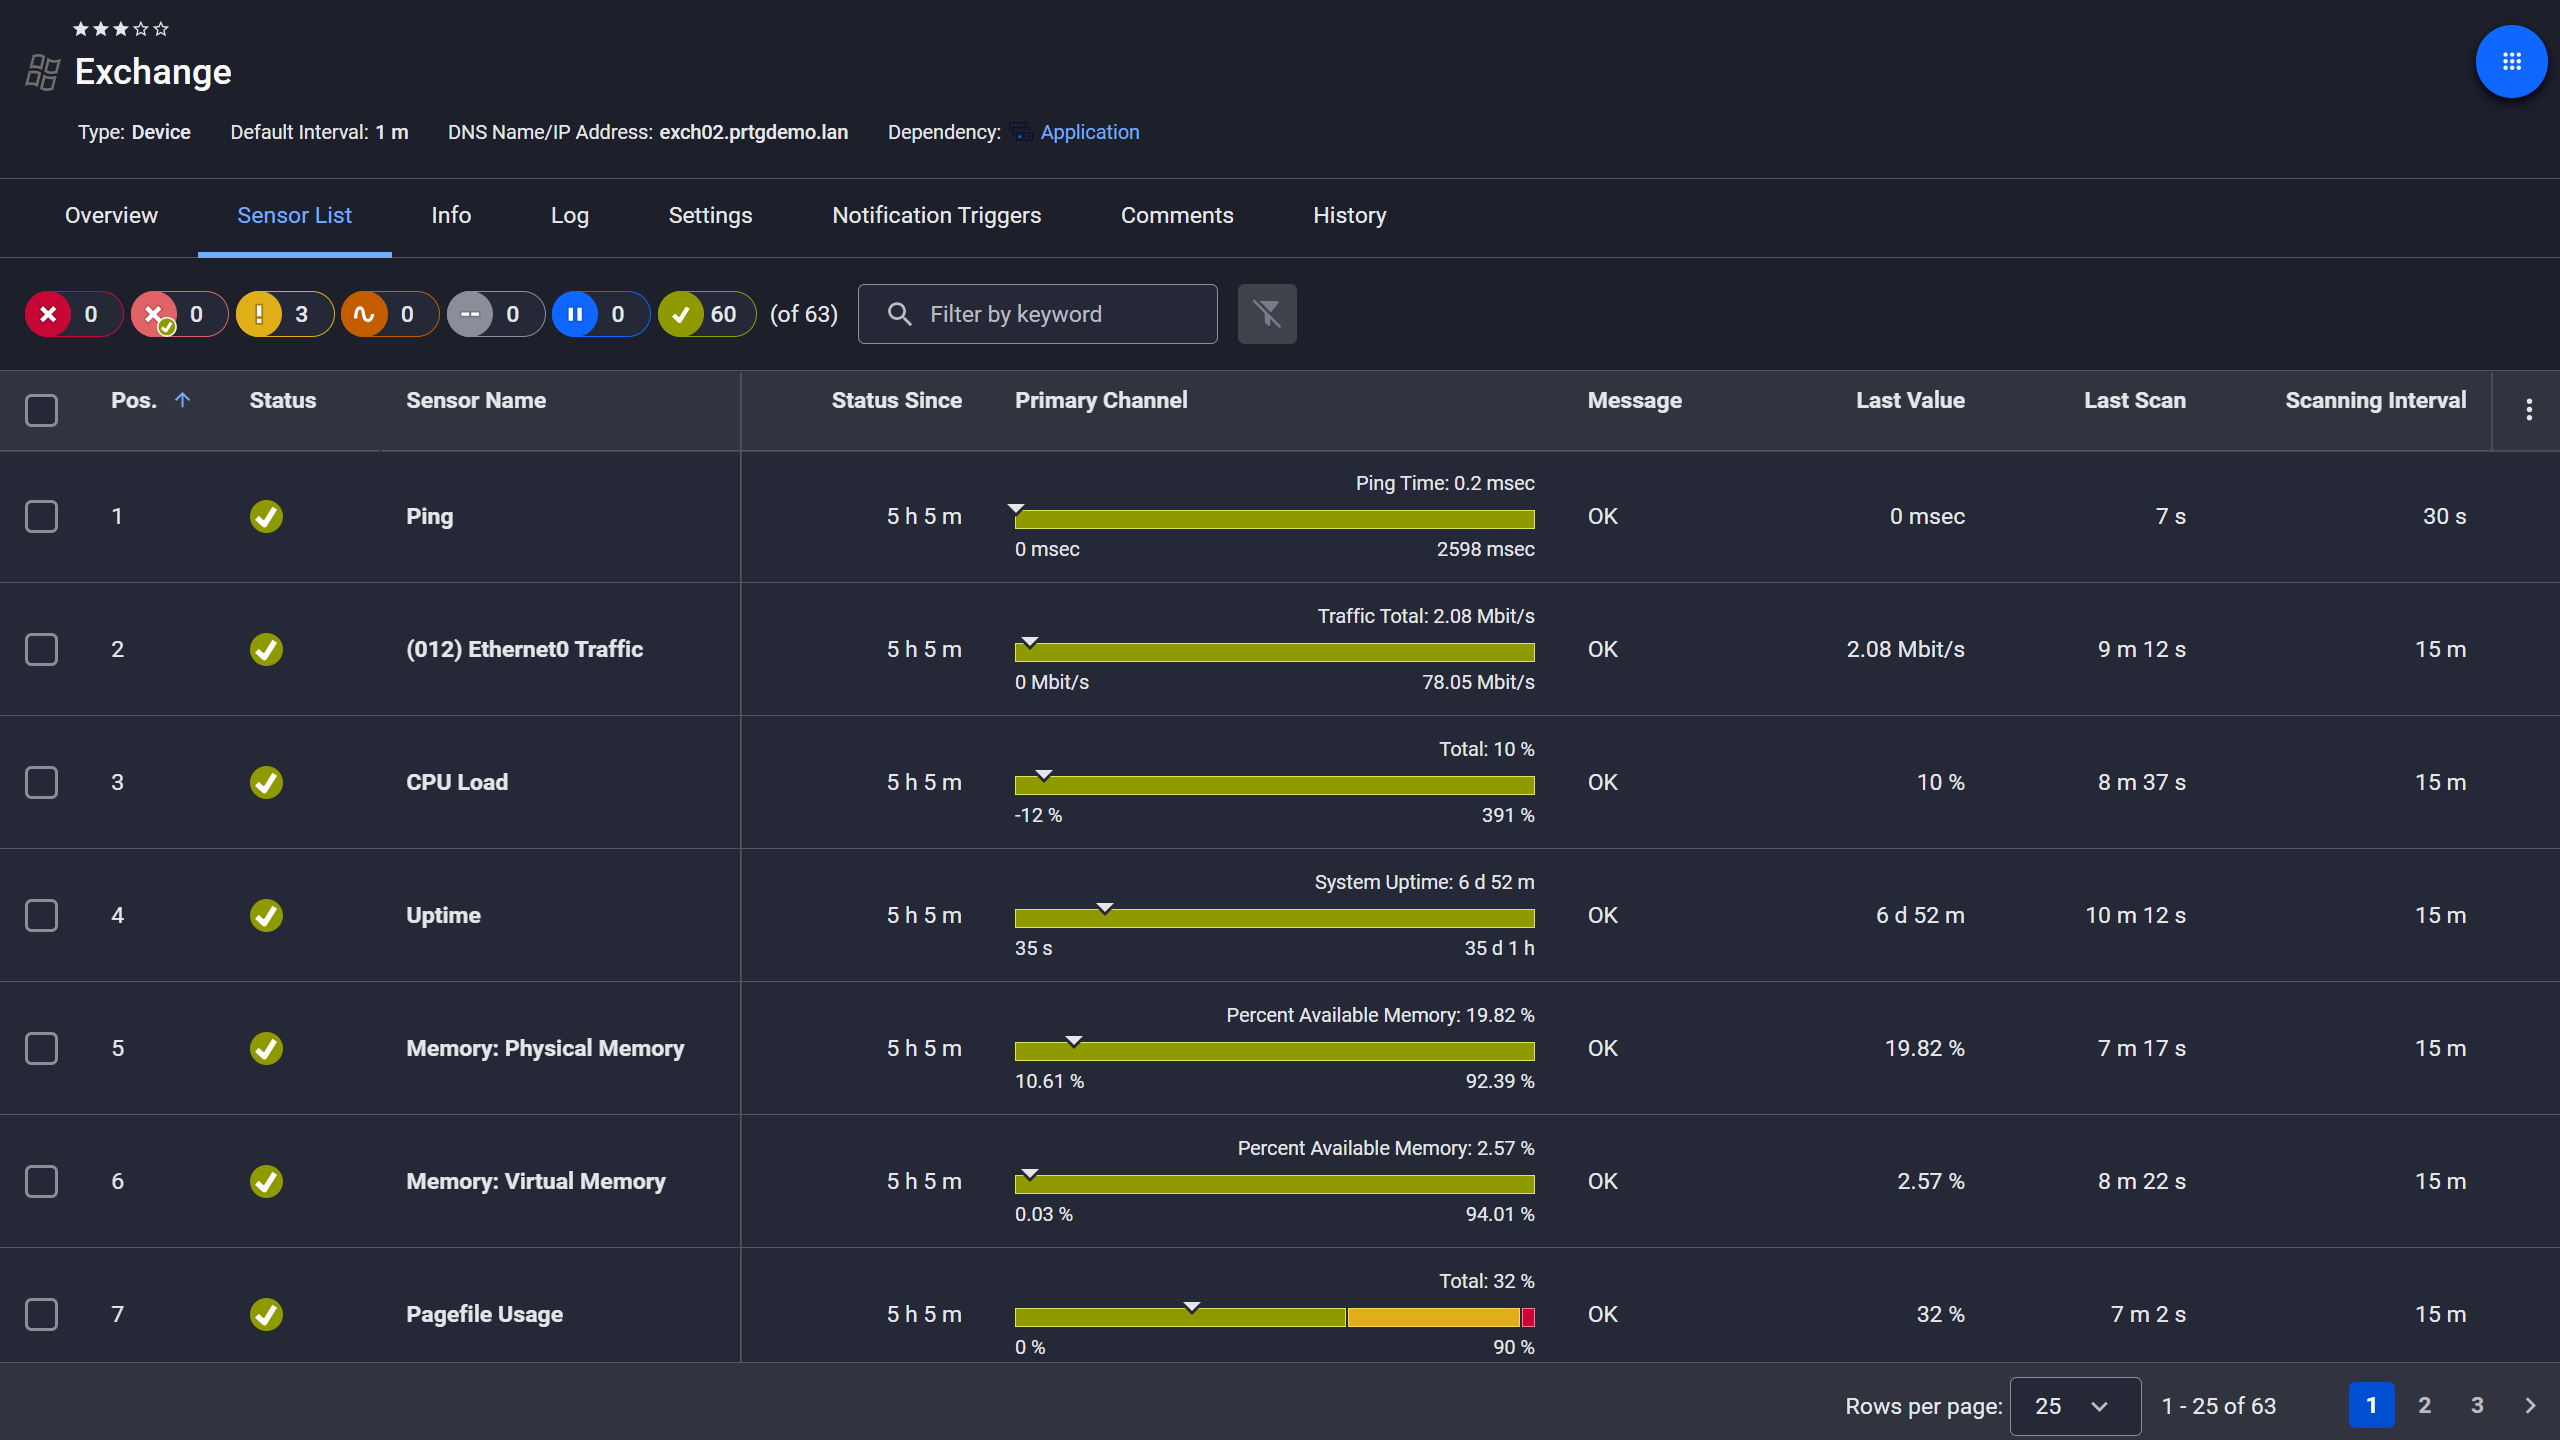
Exchange server, fully under control
Running too many Apache instances wastes resources. Running too few risks outages during traffic spikes. PRTG gives you the data to optimize Apache configuration based on real usage, not guesswork. Track memory consumption, throughput, and worker utilization to right-size your web server infrastructure.
Start monitoring your infrastructure in minutes. No professional services, no complex configuration, no risk.
Your Apache servers don't all live in one data center anymore. PRTG monitors Apache wherever it runs: on-premises Linux servers, cloud instances (AWS, Azure, GCP), containerized deployments, or remote edge locations. All from one unified monitoring solution. No need to deploy multiple tools or learn cloud-specific monitoring.
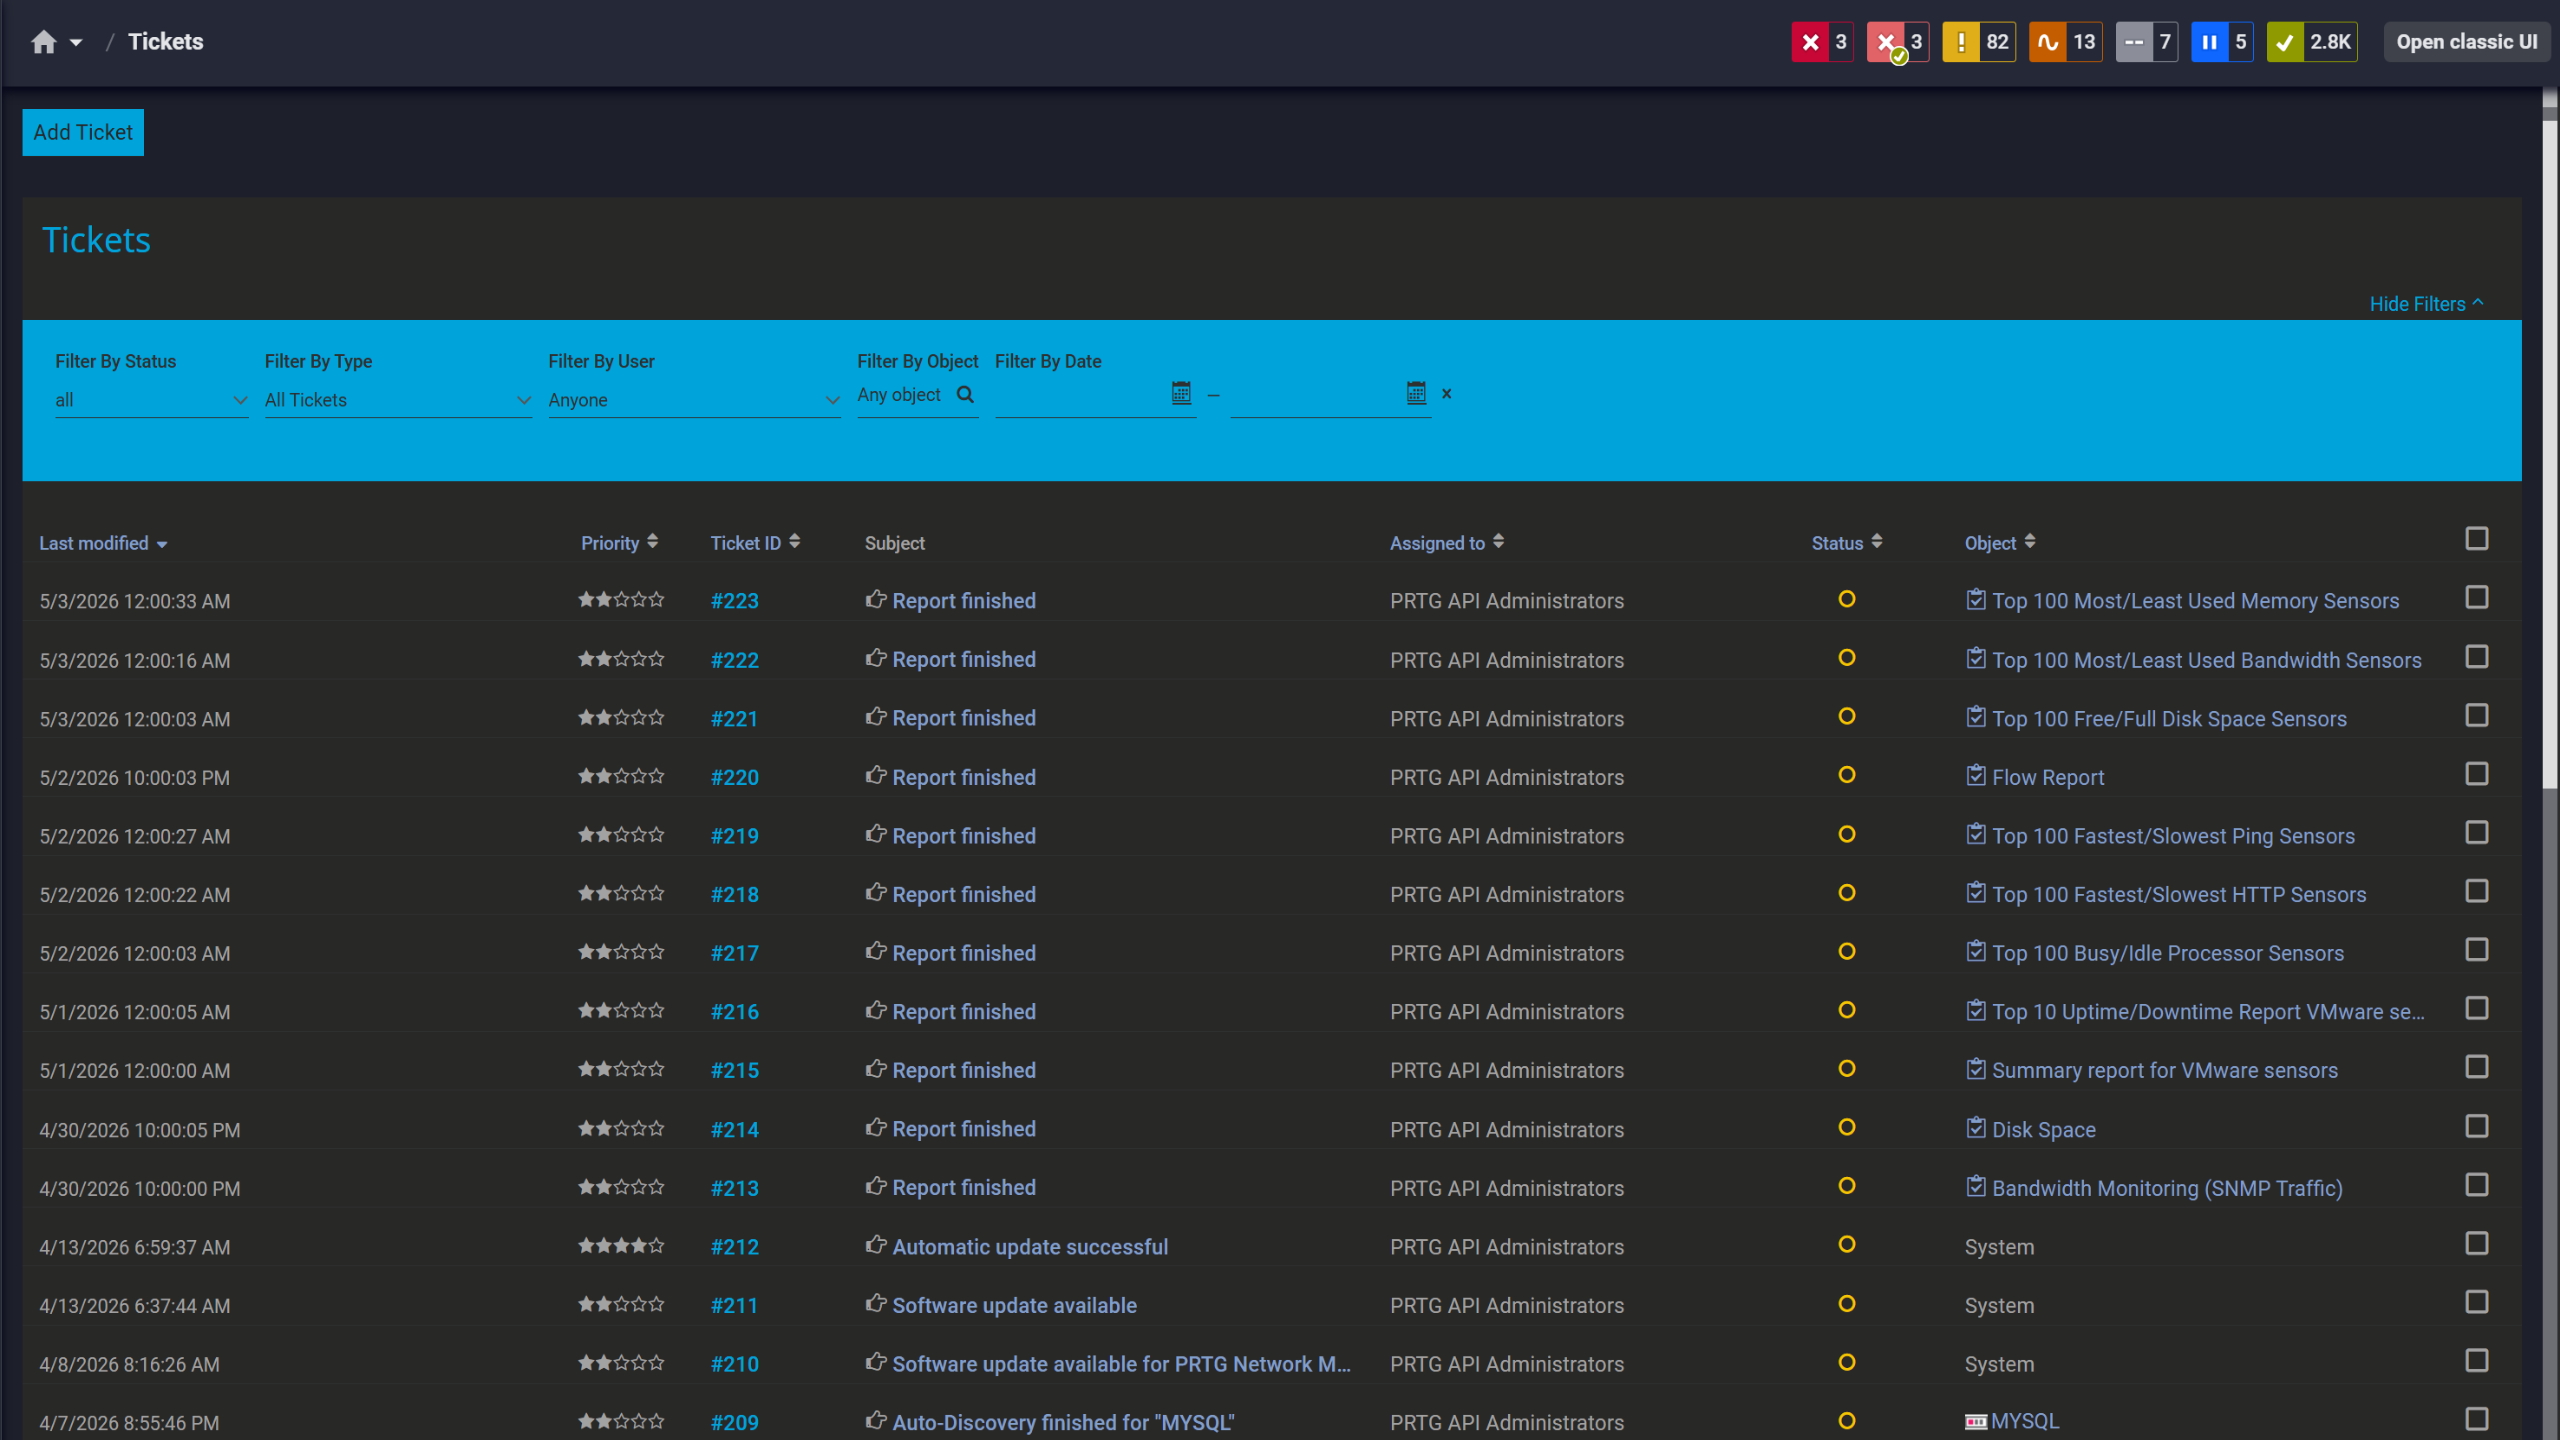
Tickets keep your team aligned
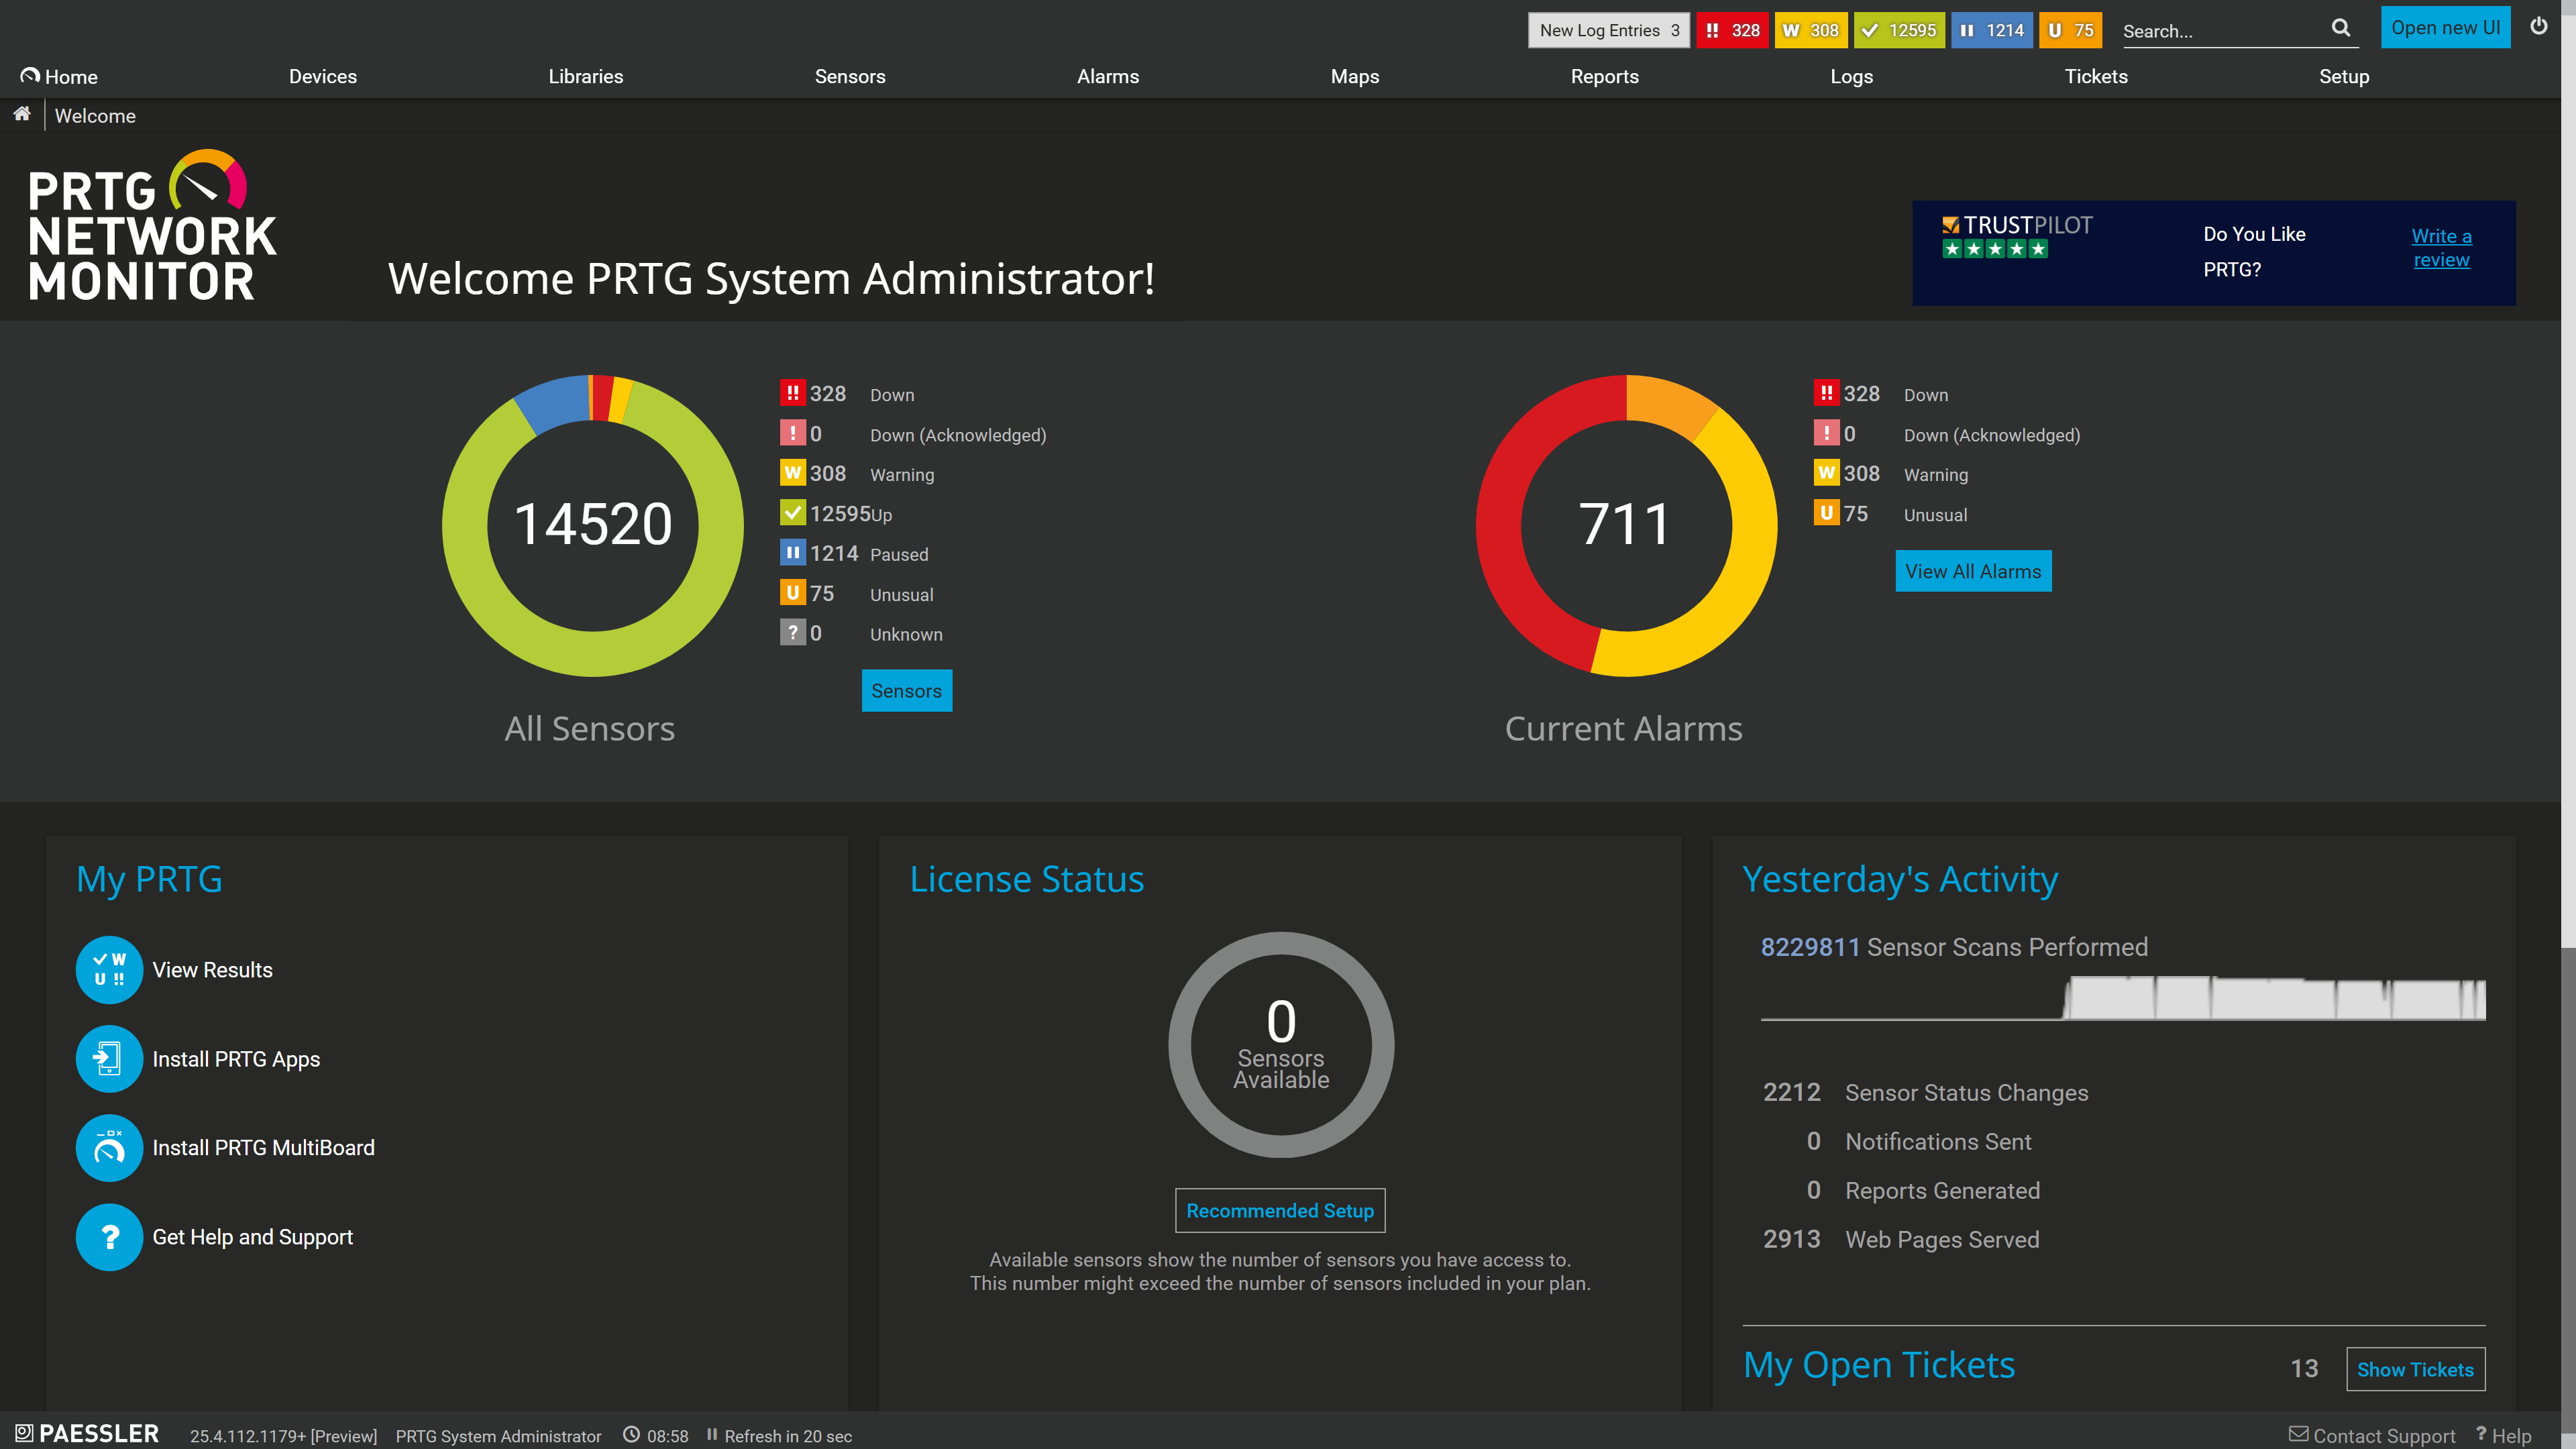
Full device list, instant overview

Scheduled reports, always on time
Manually checking Apache logs and running server-status queries doesn't scale. PRTG automates Apache monitoring with pre-configured sensors that collect metrics continuously, alert you only when action is needed, and generate reports for your team or stakeholders.
PRTG uses multiple monitoring methods to give you complete observability into Apache web server health and performance. From availability checks to deep performance analysis via mod_status, PRTG collects the metrics that matter without requiring agents on every server or complex manual configuration.
FEATURE | Without PRTG Without PRTG | With PRTG With PRTG |
|---|---|---|
Collect mod_status performance metrics | Without PRTG Log into each Apache server, run server-status queries, manually parse mod_status output, export CPU load and worker data to spreadsheet for tracking | With PRTG HTTP Apache ModStatus sensors collect metrics every 60 seconds from all servers, automated dashboards, near real-time visibility |
Set up Apache performance monitoring | Without PRTG Write custom scripts to extract Apache metrics, configure cron jobs for periodic checks, maintain scripts as Apache versions change | With PRTG Auto-discovery finds Apache servers, pre-configured sensors deploy in minutes, no scripting required |
Monitor Apache access and error logs | Without PRTG SSH into servers, tail log files, grep for errors or patterns, manually correlate log events with performance issues | With PRTG File Content and Syslog Receiver sensors monitor logs continuously, automated alerts on error patterns, anomalies, or security events |
Track Apache servers across multiple locations | Without PRTG Check each Apache server individually, juggle multiple SSH sessions or consoles for different cloud/on-prem environments, no unified view | With PRTG Unified dashboard shows all Apache servers (on-prem, cloud, remote sites), distributed remote probes, single-pane-of-glass visibility |
Analyze historical Apache performance trends | Without PRTG No historical data or trending, troubleshoot based on current state, incomplete log archives, limited capacity planning insight | With PRTG Long-term historical trending, capacity planning reports, root cause analysis with correlated Apache, network, and infrastructure metrics |
Choose the PRTG Network Monitor subscription that's best for you.
| License Name | License description | Price | License Details | Get started | Pricing Details | |
|---|---|---|---|---|---|---|
| PRTG 500 | $200 | per month paid annually | Buy nowBuy now | Enough to monitor multiple aspects of 50 devices | ||
| PRTG 1000 | $358 | per month paid annually | Buy nowBuy now | Enough to monitor multiple aspects of 100 devices | ||
| PRTG 2500 | $742 | per month paid annually | Buy nowBuy now | Enough to monitor multiple aspects of 250 devices | ||
| PRTG 5000 | $1,300 | per month paid annually | Buy nowBuy now | Enough to monitor multiple aspects of 500 devices | ||
| PRTG 10000 | $1,642 | per month paid annually | Buy nowBuy now | Enough to monitor multiple aspects of 1000 devices |

No. PRTG monitors Apache using agentless methods. HTTP checks, mod_status queries over HTTP/HTTPS, and SNMP or SSH for server-level metrics. There's no need to install software on your web servers. As long as mod_status is enabled (or you're monitoring via standard HTTP), PRTG can collect metrics immediately.
Yes. PRTG monitors Apache on any operating system: Linux, Windows, BSD, or others. PRTG's mod_status sensors work over HTTP/HTTPS regardless of platform. You can use SSH-based sensors or SNMP to monitor Linux server resources alongside Apache performance.
PRTG's Apache ModStatus sensors monitor CPU load, busy workers, idle workers, requests per second, bytes per request, uptime, total accesses, and total data transferred (kBytes). These metrics give you real-time observability into Apache performance, capacity utilization, and throughput.
Yes. PRTG monitors Apache wherever it runs: on-premises, AWS, Azure, Google Cloud, or hybrid environments. Use PRTG's cloud sensors or deploy remote probes in your cloud VPC/VNet to monitor Apache instances locally while managing everything from a central PRTG server.
PRTG sends instant notifications via email, SMS, push notification, Slack, Microsoft Teams, or integrates with ticketing systems (ServiceNow, Jira, PagerDuty). You define thresholds for response time, worker utilization, error rates, or uptime. PRTG alerts you only when those thresholds are breached, reducing alert noise.
Yes. PRTG monitors as many Apache servers as your license allows (from 500 sensors to unlimited) and displays them in unified dashboards. You can create multi-server performance comparisons, track server-to-server metrics, and identify under-performing or over-utilized instances across your entire Apache fleet.
Yes. PRTG monitors Apache, Nginx, Microsoft IIS, and other web servers in the same platform. You can compare performance across different web server types, manage hybrid environments, and get unified visibility into your entire web infrastructure regardless of technology stack.
Minutes. PRTG's auto-discovery scans your network, identifies Apache servers, and adds HTTP uptime sensors automatically. You can then add ModStatus sensors in seconds using pre-built templates. No manual configuration or scripting required. You'll have visibility into Apache performance within 5-10 minutes of installation.
Yes. PRTG can monitor Apache running in Docker containers, Kubernetes clusters, or other containerized environments. Use HTTP-based sensors to monitor Apache services and integrate with container orchestration platforms via APIs for comprehensive visibility into both the application and the infrastructure.
Yes. PRTG includes pre-built and customizable reports showing Apache uptime, performance trends, capacity utilization, and incident history. Schedule automated reports for stakeholders, compliance audits, or SLA documentation. Export reports in PDF, HTML, or CSV formats for executive summaries or technical deep-dives.
Network Monitoring Software – Version 26.1.116.1532 (February 9th, 2026)
Download for Windows and cloud-based version PRTG Hosted Monitor available
English, German, Spanish, French, Portuguese, Dutch, Russian, Japanese, and Simplified Chinese
Network devices, bandwidth, servers, applications, virtual environments, remote systems, IoT, and more
Choose the PRTG Network Monitor subscription that's best for you


