• Company
    • About Us
    • Case Studies
    • Press Center
    • Careers
    • Blog
    • Contact us
  • Contact us
  • Login
 
  • English
    • Deutsch
    • Español
    • Français
    • Italiano
    • Português
Paessler
                    - The Monitoring Experts
  • Products
    • Paessler PRTG
      Paessler PRTGMonitor your whole IT infrastructure
      • PRTG Network Monitor
      • PRTG Enterprise Monitor
      • PRTG Hosted Monitor
      • PRTG UVexplorer
      • PRTG extensionsExtensions for Paessler PRTGExtend your monitoring to a new level
    • Icon Features
      FeaturesExplore all monitoring features
      • Maps & dashboards
      • Alerts & notifications
      • Multiple user interfaces
      • Distributed monitoring
      • Customizable reporting
  • Solutions
    • Industries
      IndustriesMonitor various industry sectors
      • Industrial
      • Healthcare
      • Data Center
      • Education
      • Finance
      • Government
    • IT Topics
      IT TopicsMonitor all areas of IT
      • Network Monitoring
      • Bandwidth Monitoring
      • SNMP Monitor
      • Network Mapping
      • WiFi Monitoring
      • Server Monitoring
  • Pricing
  • Resources
    • Getting Started
      Getting StartedModules for self-paced learning
    • How-to Guides
      How-to GuidesGet the most out of PRTG
    • Videos & Webinars
      Videos & WebinarsLearn from Paessler experts
    • IT  Knowledge
      IT KnowledgeExpand your IT knowledge
    • PRTG Manual
      PRTG ManualFull documentation
    • Knowledge Base
      Knowledge BaseShare community knowledge
    • PRTG Sensor Hub
      PRTG Sensor HubGet sensors, scripts & templates
    • Trainings
      PRTG TrainingLearn how to work with PRTG
  • Partners
    • Icon Handshake
      Become a PartnerFor resellers and channel partners
    • Icon MSP
      Become an MSPDeliver monitoring as a managed service
    • icon partner
      Partner PortalLog in to your partner account
    • Deal Registration
      Deal RegistrationRegister your sales opportunities
    • icon search
      Find a PartnerFind partners selling Paessler products
    • icon technology
      Technology AlliancesSee Paessler technology partnerships
    • Partner HubTools for Your Success
  • Company
    • About Us
    • Case Studies
    • Press Center
    • Careers
    • Blog
    • Contact us
  • Contact us
  • Login
  • English
    • Deutsch
    • Español
    • Français
    • Italiano
    • Português
  • Get a quote
  • Free trial

Proactive Website Availability Monitoring

Website availability means more than a server that responds  

Free download
PRODUCT OVERVIEW

What should website availability monitoring actually tell you?  

Most monitoring tools tell you whether your server responded. That's a start, but it's not the full picture. A complete website availability monitoring setup tracks response times, verifies that page content is actually correct, monitors SSL certificate validity, and checks reachability from locations outside your own network. Paessler PRTG covers all of this with preconfigured sensors, so you don't need separate tools for uptime, performance, and SSL monitoring.  

PRTG monitors HTTP/HTTPS endpoints and common web server platforms including IIS, Apache, and nginx. SSL certificates, DNS resolution, TCP ports, and IP addresses are covered by dedicated sensors. Web server resource monitoring is available via WMI and SNMP.  

Download PRTG Trial

What you will find on this page

  • Monitor All of Your Website Availabilty Metrics
  • How to Monitor Website Availabilty
  • Manual Availability Monitoring vs. PRTG
  • FAQs

PRTG is compatible with all major vendors, products, and systems

compatible with all major vendors, products, and systems

Website Availability Monitoring, From the URL to the Server

Know If Users in Other Regions Can Reach Your Site  

An internal availability check confirms the server responds from your network. External users reach your site through DNS resolution, public routing, and CDN edge nodes, all of which need separate coverage to get the full picture. PRTG's Cloud HTTP v2 and Cloud Ping v2 sensors check from 5 external locations across 4 continents: Singapore, Sydney, Ireland, Northern Virginia, and Northern California. Per-location response data comes in continuously, so you can tell whether an outage is global or confined to one region. The probe needs internet access to the PRTG Cloud API. No external infrastructure to deploy or maintain. 
  • Per-location HTTP response codes and loading times
  • Average global response time across all check locations
  • TCP ping times per location via Cloud Ping v2
  • Real-time status per geographic endpoint
  • No external infrastructure required beyond internet access on the probe
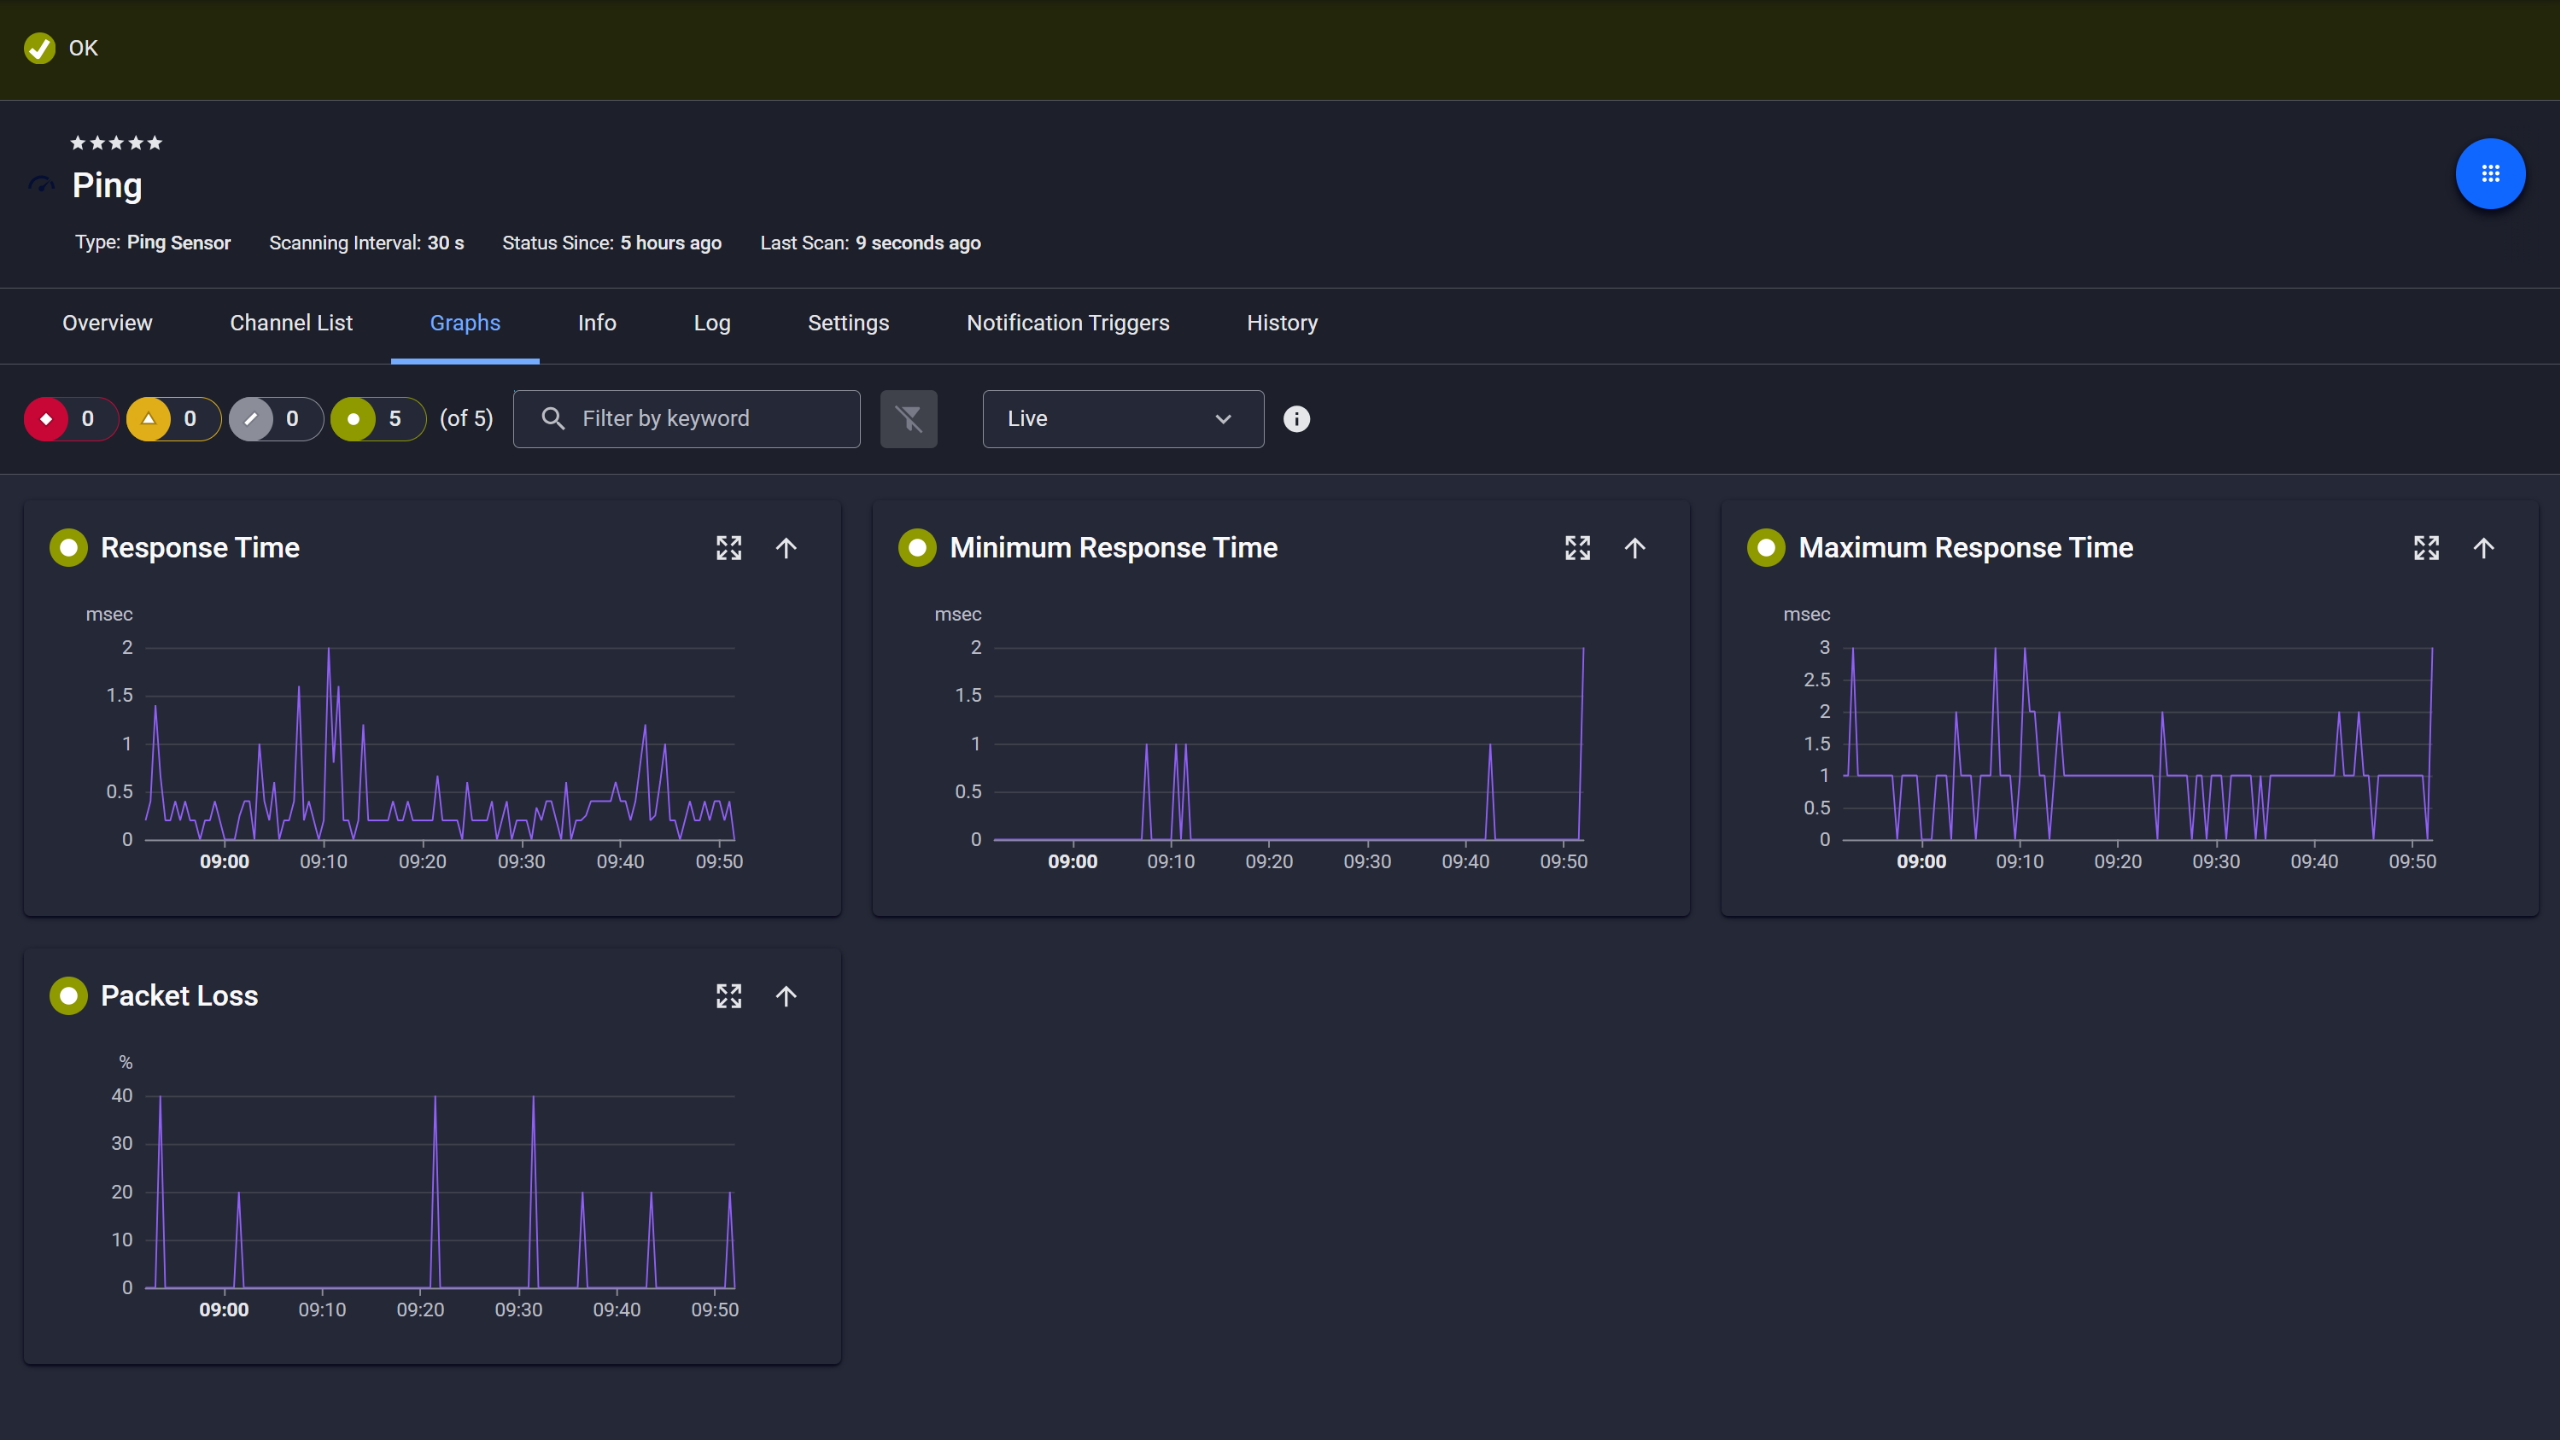
PRTG Ping sensor graphs showing response time, min, max, and packet loss over time

Ping response and packet loss

PRTG web interface showing live performance graphs for a Probe Health sensor

Live graphs, real-time performance data

PRTG reports list showing scheduled monitoring reports with run times and sensor counts

Scheduled reports, always on time

HTTP 200 Doesn't Mean the Page Works  

The HTTP Advanced sensor doesn't stop at response codes. It fetches the page and checks the actual HTML source against keywords you configure. Define what must be present, define what must not appear, and the sensor alerts when either condition is violated. That covers database errors returning 200 with a blank body, deployments that wipe main content, and any other case where the server responds but the page doesn't deliver what it should. Set it up once, and every check from that point confirms the page returns what it's supposed to. 

  • Must-include and must-exclude keyword checks on HTML page source
  • Bytes Received, Loading Time, and Time To First Byte tracked as separate channels
  • Configurable warning and error thresholds per channel
  • Supports HTTP Basic and Digest authentication
  • Reduces false positives from response-code-only monitoring

See Why IT Professionals Trust PRTG

Start monitoring your infrastructure in minutes. No professional services, no complex configuration, no risk.

Free download
PRODUCT OVERVIEW

Track SSL Expiration Before It Becomes a Visitor-Facing Outage  

SSL certificates across multiple domains each have their own expiry date, and keeping track of all of them manually adds up fast. Add one SSL Certificate sensor per domain or subdomain and PRTG takes it from there. PRTG tracks validity and days to expiration for each certificate. The default thresholds are a warning at 90 days and an error at 30 days, and both are adjustable to fit your renewal process. Alerts go out via email, SMS, or push notification. Routing to Slack or another tool works through webhook configuration. 
  • Days to Expiration tracked as a numeric channel 
  • Default warning at 90 days, error at 30 days (both configurable) 
  • One sensor per domain or subdomain 
  • Notifications via email, SMS, push notifications, or webhooks (Slack via webhook) 
  • SSL Certificate sensor sits alongside HTTP sensors on the same device in PRTG 
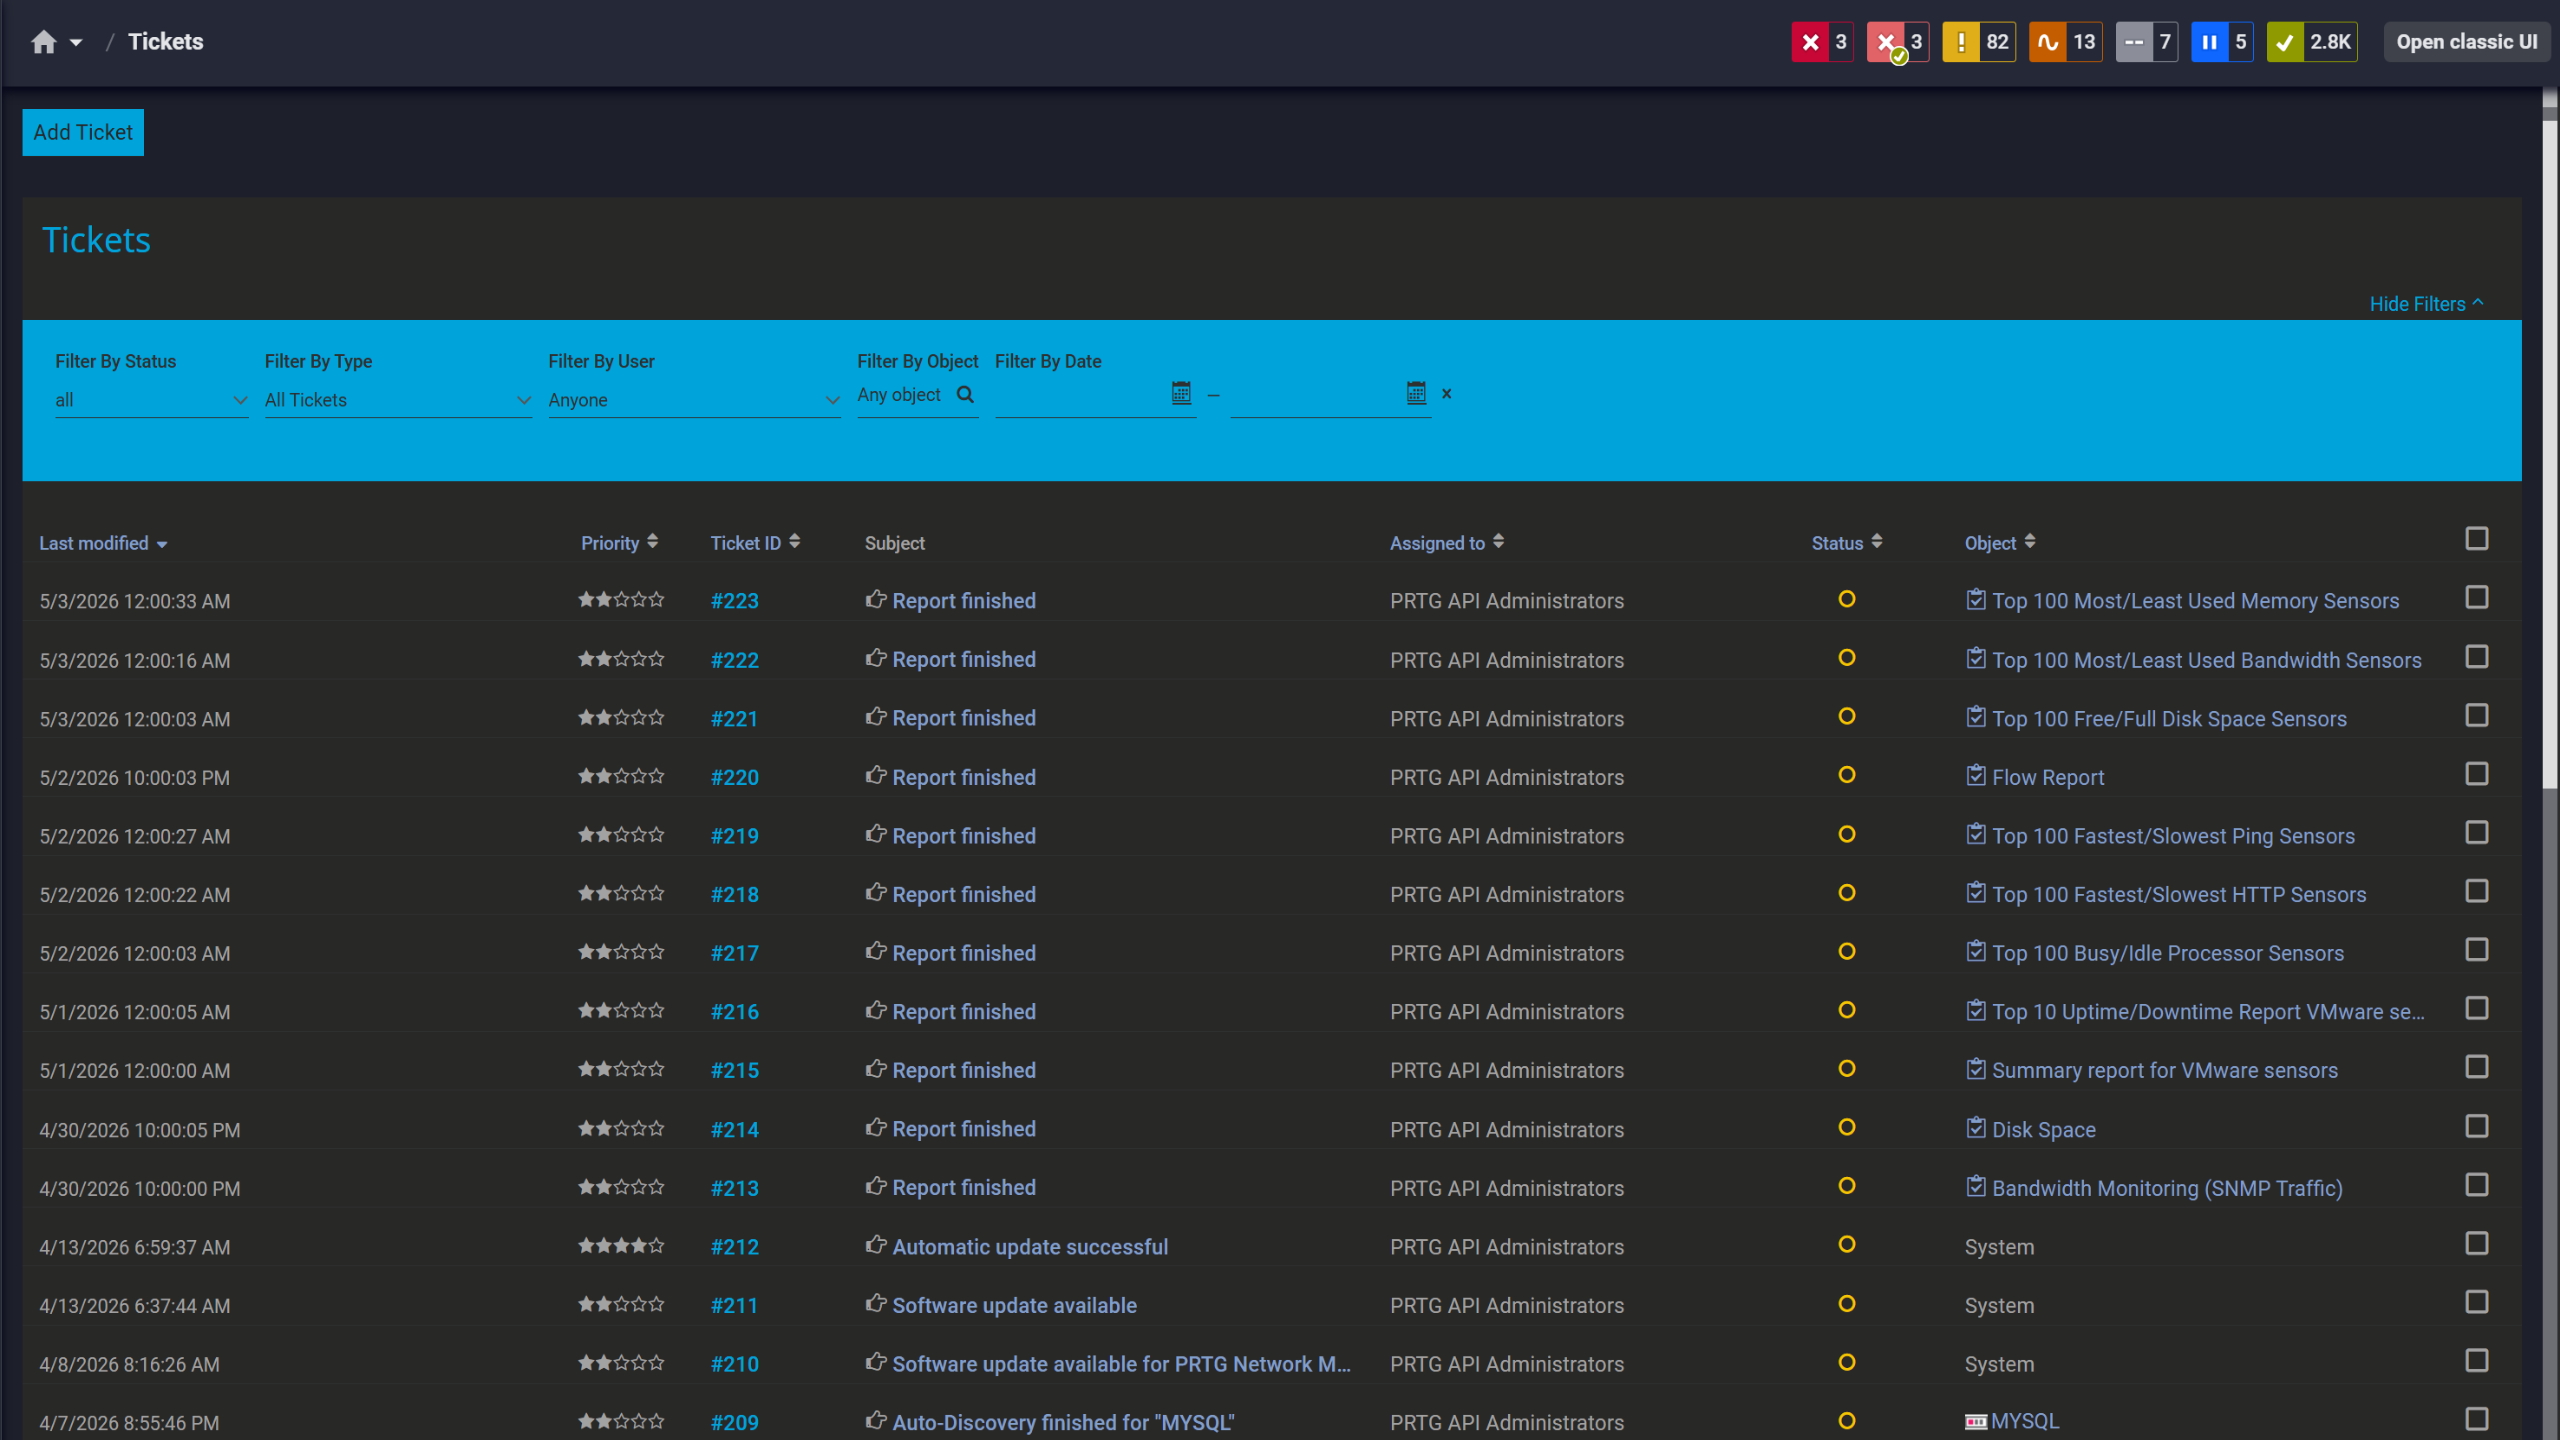
PRTG tickets list showing system notifications, report completions, and update alerts

Tickets keep your team aligned

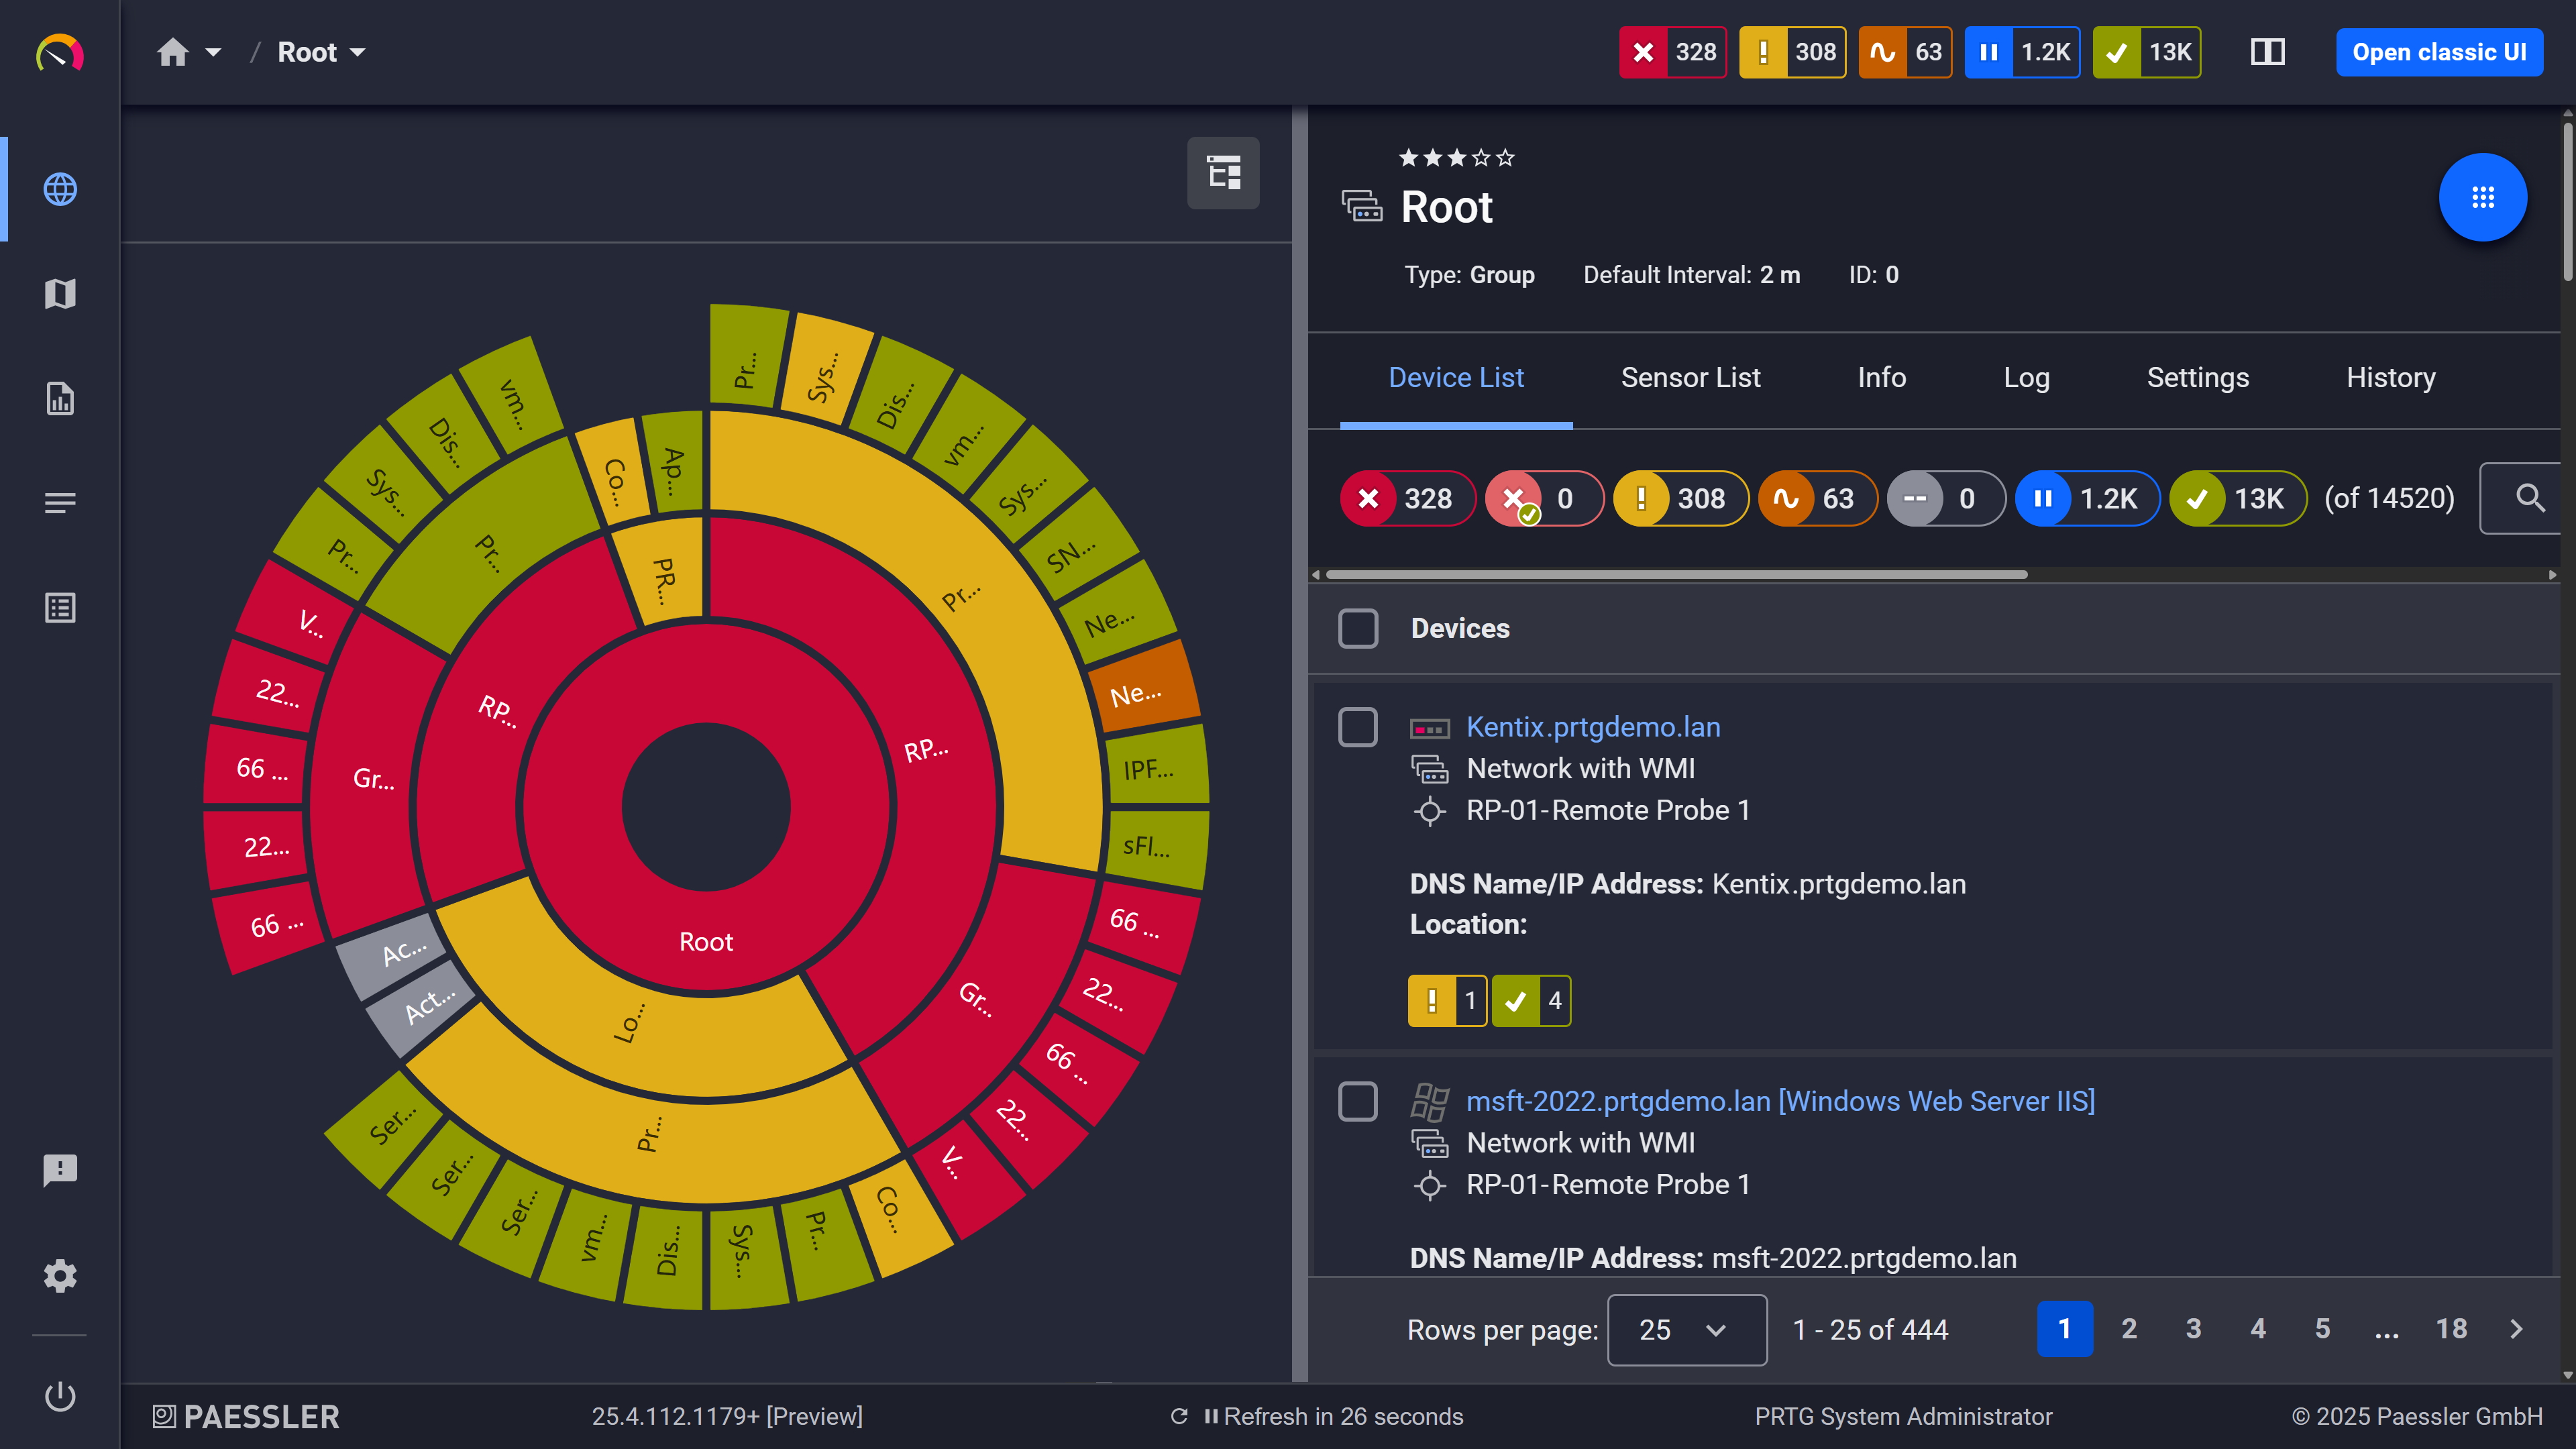
PRTG web interface showing device tree and full device list with sensor status badges

Full device list, instant overview

PRTG sunburst chart visualizing the full network hierarchy with color-coded sensor status

Your entire network, visualized instantly

Catch Performance Degradation Before Users Notice  

A site that loads in 400ms this month and 2 seconds next month is technically 'up' the entire time. Setting thresholds on loading time or TTFB means that drift produces an alert as soon as it crosses a defined limit. Historical data is stored and graphed over days, weeks, or months, so when there's a troubleshooting conversation to have, the full performance trend is already there. PRTG's HTTP sensors track Loading Time and Bytes Received as dedicated channels. The HTTP Advanced sensor adds Time To First Byte as a separate channel. 

  • TTFB tracked as an independent channel (HTTP Advanced sensor) 
  • Separate warning and error thresholds on loading time 
  • Configurable check intervals 
  • Historical graphs show the full performance trend over time 
  • Stored metrics give you a starting point for root cause analysis 

How PRTG Monitors Website Availability

PRTG uses dedicated sensors for each layer of website availability monitoring: HTTP response, content integrity, SSL validity, DNS, TCP, and server health. Each sensor runs independently and reports into the same device object in PRTG's device tree.  

HTTP Availability Checks  

The HTTP v2 sensor monitors a web server using HTTP and confirms whether a specific website or website element is reachable. It tracks three channels: Bytes Received, Loading Time, and Response Code. Performance impact is low. Smart URL replacement lets you monitor multiple similar endpoints from a cloned device setup, so you're not reconfiguring each one manually.  

Web Server Monitoring 

PRTG monitors the server running your website using WMI or SNMP, covering CPU load, memory utilization, and active connections for IIS, Apache, and nginx. These sensors go on the same device as your HTTP sensors in PRTG's device tree. When something's wrong, HTTP-layer data and server-side metrics are visible in the same dashboard view. No second tool needed to check whether the issue is in the application or the infrastructure. 

DNS Resolution Monitoring

A site can be fully operational at the server level and still unreachable if DNS resolution fails. The DNS v2 sensor monitors resolution for configured domains and alerts if it fails. HTTP checks alone don't cover this, and it's worth including in any complete website monitoring setup alongside your HTTP and TCP sensors.  

TCP Port Availability  

The TCP sensor checks whether a service is listening on a specific port: 80, 443, or any custom port. When an HTTP check fails, a TCP check on the same port tells you quickly whether the problem is at the application layer or whether the service isn't responding at all. It also works for adjacent services on the same host, such as SMTP or custom application ports. 

Alerting and Notification 

PRTG sends alerts via email, SMS, and push notifications for iOS and Android. HTTP-based notifications let you route alerts to webhooks, which is how integrations with tools like Slack or external incident management systems work. Notifications are configurable per sensor and per state, so you can route warning and error alerts differently. Scheduled maintenance windows suppress alerting during planned downtime without requiring any manual action during the window itself. 

free downLoad

Website Availability Monitoring: Without It vs. With PRTG 

Task

Without PRTG

Without PRTG

With PRTG

With PRTG

Detecting a broken page that returns HTTP 200 

Without PRTG
not included

Manual spot-checking or waiting for user reports 

With PRTG
included

HTTP Advanced sensor checks page content on every interval and alerts if expected content is missing 

Knowing if the site is unreachable in a specific region 

Without PRTG
not included

No visibility without setting up your own external test infrastructure 

With PRTG
included

Cloud sensors check from 5 external locations across 4 continents 

SSL certificate expiry tracking 

Without PRTG
not included

Calendar reminders, spreadsheets, or discovered after HTTPS already broke 

With PRTG
included

SSL Certificate sensor tracks Days to Expiration and alerts before it becomes an outage 

Response time trend data for troubleshooting 

Without PRTG
not included

No historical baseline; degradation goes unnoticed until complaints arrive 

With PRTG
included

Loading time and TTFB stored per check interval, graphed over time, threshold-alertable 

Connecting HTTP issues to web server health 

Without PRTG
not included

Two separate tools, manual cross-referencing 

With PRTG
included

HTTP and server sensors on the same device, visible in one dashboard view 

free downLoad

“I would recommend PRTG because it has helped us significantly improve service uptime by highlighting important alerts that would otherwise result in a system failure or service disruption if action was not taken. Thanks to PRTG, we can ensure that The Ritz London’s network and IT systems are five-star, just like the hotel.”

Richard Isted, IT Manager
The Ritz London

”GESAC increasingly focuses on innovation to improve the quality of services offered and the experience of passengers handled every day by Naples Airport. Thanks to PRTG, we finally have unified, automatic, and continuous monitoring of the airport network and can guarantee quick and timely interventions.”

Domenico Ciervo, GESAC ICT Manager
Naples International Airport

Adopting PRTG has been like going from being in the dark to being in the light. Before, we had limited visibility into what was happening in the infrastructure and in the network. Now, however, thanks to the comprehensive dashboard and real-time notifications, we receive constant updates on the status of facilities and services, and our way of working has gone from passive to proactive.

Luca Meneghesso, senior IT infrastructure and security specialist
Banca Profilo

Paessler PRTG Network Monitor licenses & pricing

Choose the PRTG Network Monitor subscription that's best for you.

License NameLicense descriptionPriceLicense DetailsGet startedPricing Details
PRTG 500$200per month paid annuallyBuy nowBuy now

Enough to monitor multiple aspects of 50 devices

PRTG 1000$358per month paid annuallyBuy nowBuy now

Enough to monitor multiple aspects of 100 devices

PRTG 2500$742per month paid annuallyBuy nowBuy now

Enough to monitor multiple aspects of 250 devices

PRTG 5000$1,300per month paid annuallyBuy nowBuy now

Enough to monitor multiple aspects of 500 devices

PRTG 10000$1,642per month paid annuallyBuy nowBuy now

Enough to monitor multiple aspects of 1000 devices

Over 100,000 Customers Worldwide Love Paessler  

customer success stories

 Website Availability Monitoring: Frequently Asked Questions


What's the difference between uptime monitoring and website availability monitoring?

Uptime monitoring checks whether a server or service responds. Website availability monitoring goes further: it tracks whether the page actually works, how fast it loads, whether the SSL certificate is valid, and whether the site is reachable from different geographic locations. Uptime is one metric. Website availability is the full picture. 

How does external website availability monitoring work, and why does checking from inside your own network miss problems?

When you check availability from inside your own network, you're confirming that your server responds to your own infrastructure. External users reach your site through DNS resolution, public routing, and potentially CDN edge nodes, none of which your internal checks cover. External monitoring runs uptime checks from locations outside your network and tells you what users outside your building actually see. PRTG's Cloud sensors do this in real time from 5 locations across 4 continents, with no additional external infrastructure to maintain. 

Can a monitoring tool detect a page that's broken but still returning HTTP 200?

Yes, if it checks more than just the response code. A basic uptime check stops at "did the server respond?" That's where false positives come from. PRTG's HTTP Advanced sensor checks the actual page source for content you define. If the expected content is missing, it alerts regardless of what the response code says. That's how you catch broken deployments and application errors that a response-code-only check would miss entirely. 

Does PRTG offer synthetic monitoring or real user monitoring (RUM)?

No. Synthetic monitoring simulates scripted user journeys through a browser; real user monitoring (RUM) collects data from actual browser sessions. PRTG does neither. What it does is active HTTP checking: it requests the URL, measures loading time, checks the response code, and with the HTTP Advanced sensor, verifies page content. If your requirement is full synthetic transaction testing or browser-side RUM, PRTG isn't the right fit for that. For availability, response time, and content integrity checks, it covers what most infrastructure teams actually need. 

Can PRTG monitor API endpoints and third-party service dependencies for availability?

PRTG can make HTTP/HTTPS requests to any reachable endpoint, including REST APIs. The HTTP v2 and HTTP Advanced sensors work with API endpoints the same way they work with web pages, checking reachability, response codes, and loading times. For JSON or XML responses, the HTTP Data Advanced sensor can parse and extract specific values. Third-party providers and external dependencies can be monitored this way as long as they expose an HTTP endpoint. 

How is PRTG different from standalone uptime tools like UptimeRobot?

Standalone uptime tools tell you whether a URL responds. PRTG is a broader infrastructure monitoring platform that includes website monitoring as part of a larger set of capabilities. The practical difference shows up when something breaks: in PRTG, you can check the HTTP response, the web server's CPU and memory, DNS resolution, and TCP port availability from the same interface. You're not limited to knowing something is down. You have more context for understanding why. Pricing is sensor-based, so you pay for what you monitor. No credit card is required to try it. 

Can PRTG generate uptime and availability reports for SLA documentation?

PRTG stores historical availability data and includes built-in reporting. You can generate reports on sensor status, uptime, and performance metrics over custom time ranges, which works well for internal visibility and team reporting. For formal SLA documentation with defined SLA parameters, compliance tracking, and dedicated SLA dashboards, the PRTG SLA Reporter is a separate component built specifically for that. It connects to PRTG data and gives you the structure needed for customer-facing or compliance-grade SLA reporting. 

Paessler PRTG

Paessler PRTG

Network Monitoring Software – Version 26.1.116.1532 (February 9th, 2026)

Hosting icon

Hosting

Download for Windows and cloud-based version PRTG Hosted Monitor available

Languages icon

Languages

English, German, Spanish, French, Portuguese, Dutch, Russian, Japanese, and Simplified Chinese

test

Monitor everything

Network devices, bandwidth, servers, applications, virtual environments, remote systems, IoT, and more

test

Pricing

Choose the PRTG Network Monitor subscription that's best for you

Discover more monitoring insights and stories

Content illustration

Powerful stories from the monitoring world

  • 10 Critical Website Performance Indicators You Should Monitor
  • Uptime vs Availability: Why IT Teams Need Both Metrics for True ...
  • Website transaction monitoring: Your first line of defense against lost ...
Support illustration

Resources to master your monitoring challenges

  • PRTG Manual: Monitoring via HTTP - Paessler
  • monitor external site
  • Login Monitor for Website using LDAP
Solution illustration

Solutions for all your monitoring needs

  • Website Availability Monitoring
  • Availability Monitoring
  • Free Website Monitoring
PRTG Logo

Start Monitoring with PRTG and see how it can make your network more reliable and your job easier.

Free download
PRODUCT OVERVIEW

Products

  • Paessler PRTG
    Paessler PRTGMonitor your whole IT infrastructure
    • PRTG Network Monitor
    • PRTG Enterprise Monitor
    • PRTG Hosted Monitor
    • PRTG UVexplorer
    • PRTG extensions
      Extensions for Paessler PRTGExtend your monitoring to a new level
  • Icon Features
    FeaturesExplore all monitoring features

Monitoring with PRTG

  • Network monitoring
  • Bandwidth monitoring
  • SNMP monitoring
  • Network mapping
  • Wi-Fi monitoring
  • Server monitoring
  • Network traffic analyzer
  • NetFlow monitoring
  • Syslog server

Useful Links

  • PRTG Manual
  • Knowledge Base
  • Customer Success Stories
  • About Paessler
  • Subscribe to newsletter
  • PRTG Support
  • PRTG Consulting
  • PRTG Feedback & Roadmap

Contact

Paessler GmbH
Thurn-und-Taxis-Str. 14, 
90411 Nuremberg 
Germany

[email protected]

+49 911 93775-0

  • Contact us
©2026 Paessler GmbHTerms & ConditionsPrivacy PolicyImprintReport VulnerabilityDownload & InstallSitemap
SNMP, MIBs and OIDs SNMP, MIBs and OIDs SNMP, MIBs and OIDs