- English
- Deutsch
- Español
- Français
- Italiano
- Português
jFlow is Juniper Networks' built-in flow monitoring protocol. Juniper routers, switches, and firewalls running JunOS collect data on every traffic flow passing through them and export that data as flow records to a flow collector. The result is a detailed breakdown of network traffic by IP address, port number, protocol, and application group. Interface totals alone don't show you which conversations are actually happening on your network.
Paessler PRTG acts as the flow collector, receiving jFlow data via UDP and making it available for analysis, alerting, and reporting. Beyond jFlow v5, PRTG also supports IPFIX, NetFlow, and sFlow, so it works across mixed-vendor environments without requiring separate tools for each protocol. Supported devices and protocols include: Juniper MX routers, EX switches, SRX firewalls, vSRX, and vMX (JunOS); Cisco routers and switches (NetFlow); multi-vendor environments via IPFIX and sFlow; plus SNMP Traffic v2 monitoring as a complementary method for devices without flow export.

jFlow goes deeper than SNMP interface counters by breaking traffic down to the IP, port, and application level. That means you see exactly which conversations are driving bandwidth utilization on any monitored interface. PRTG's jFlow v5 sensor receives flow records exported from your Juniper devices via UDP and organizes the data into Toplists (Top Talkers, Top Connections, and Top Protocols), breaking traffic down by sender and destination IP, port, and protocol. Traffic is also categorized by application group: web, file transfer, mail, network infrastructure, and remote access applications. No CLI queries, no guesswork, just the traffic analysis you need to act on.
Most networks run multiple vendors. Juniper handles core routing, Cisco covers access, and other network devices export sFlow. A unified flow collector brings all of that into one place, giving you consistent visibility across every device regardless of the protocol it exports. PRTG includes dedicated sensors for jFlow v5, NetFlow, IPFIX, and sFlow, so all flow data is processed in one monitoring tool and visible in a single dashboard. No additional collector software needed, no manual correlation between data sources.

Live graphs, real-time performance data
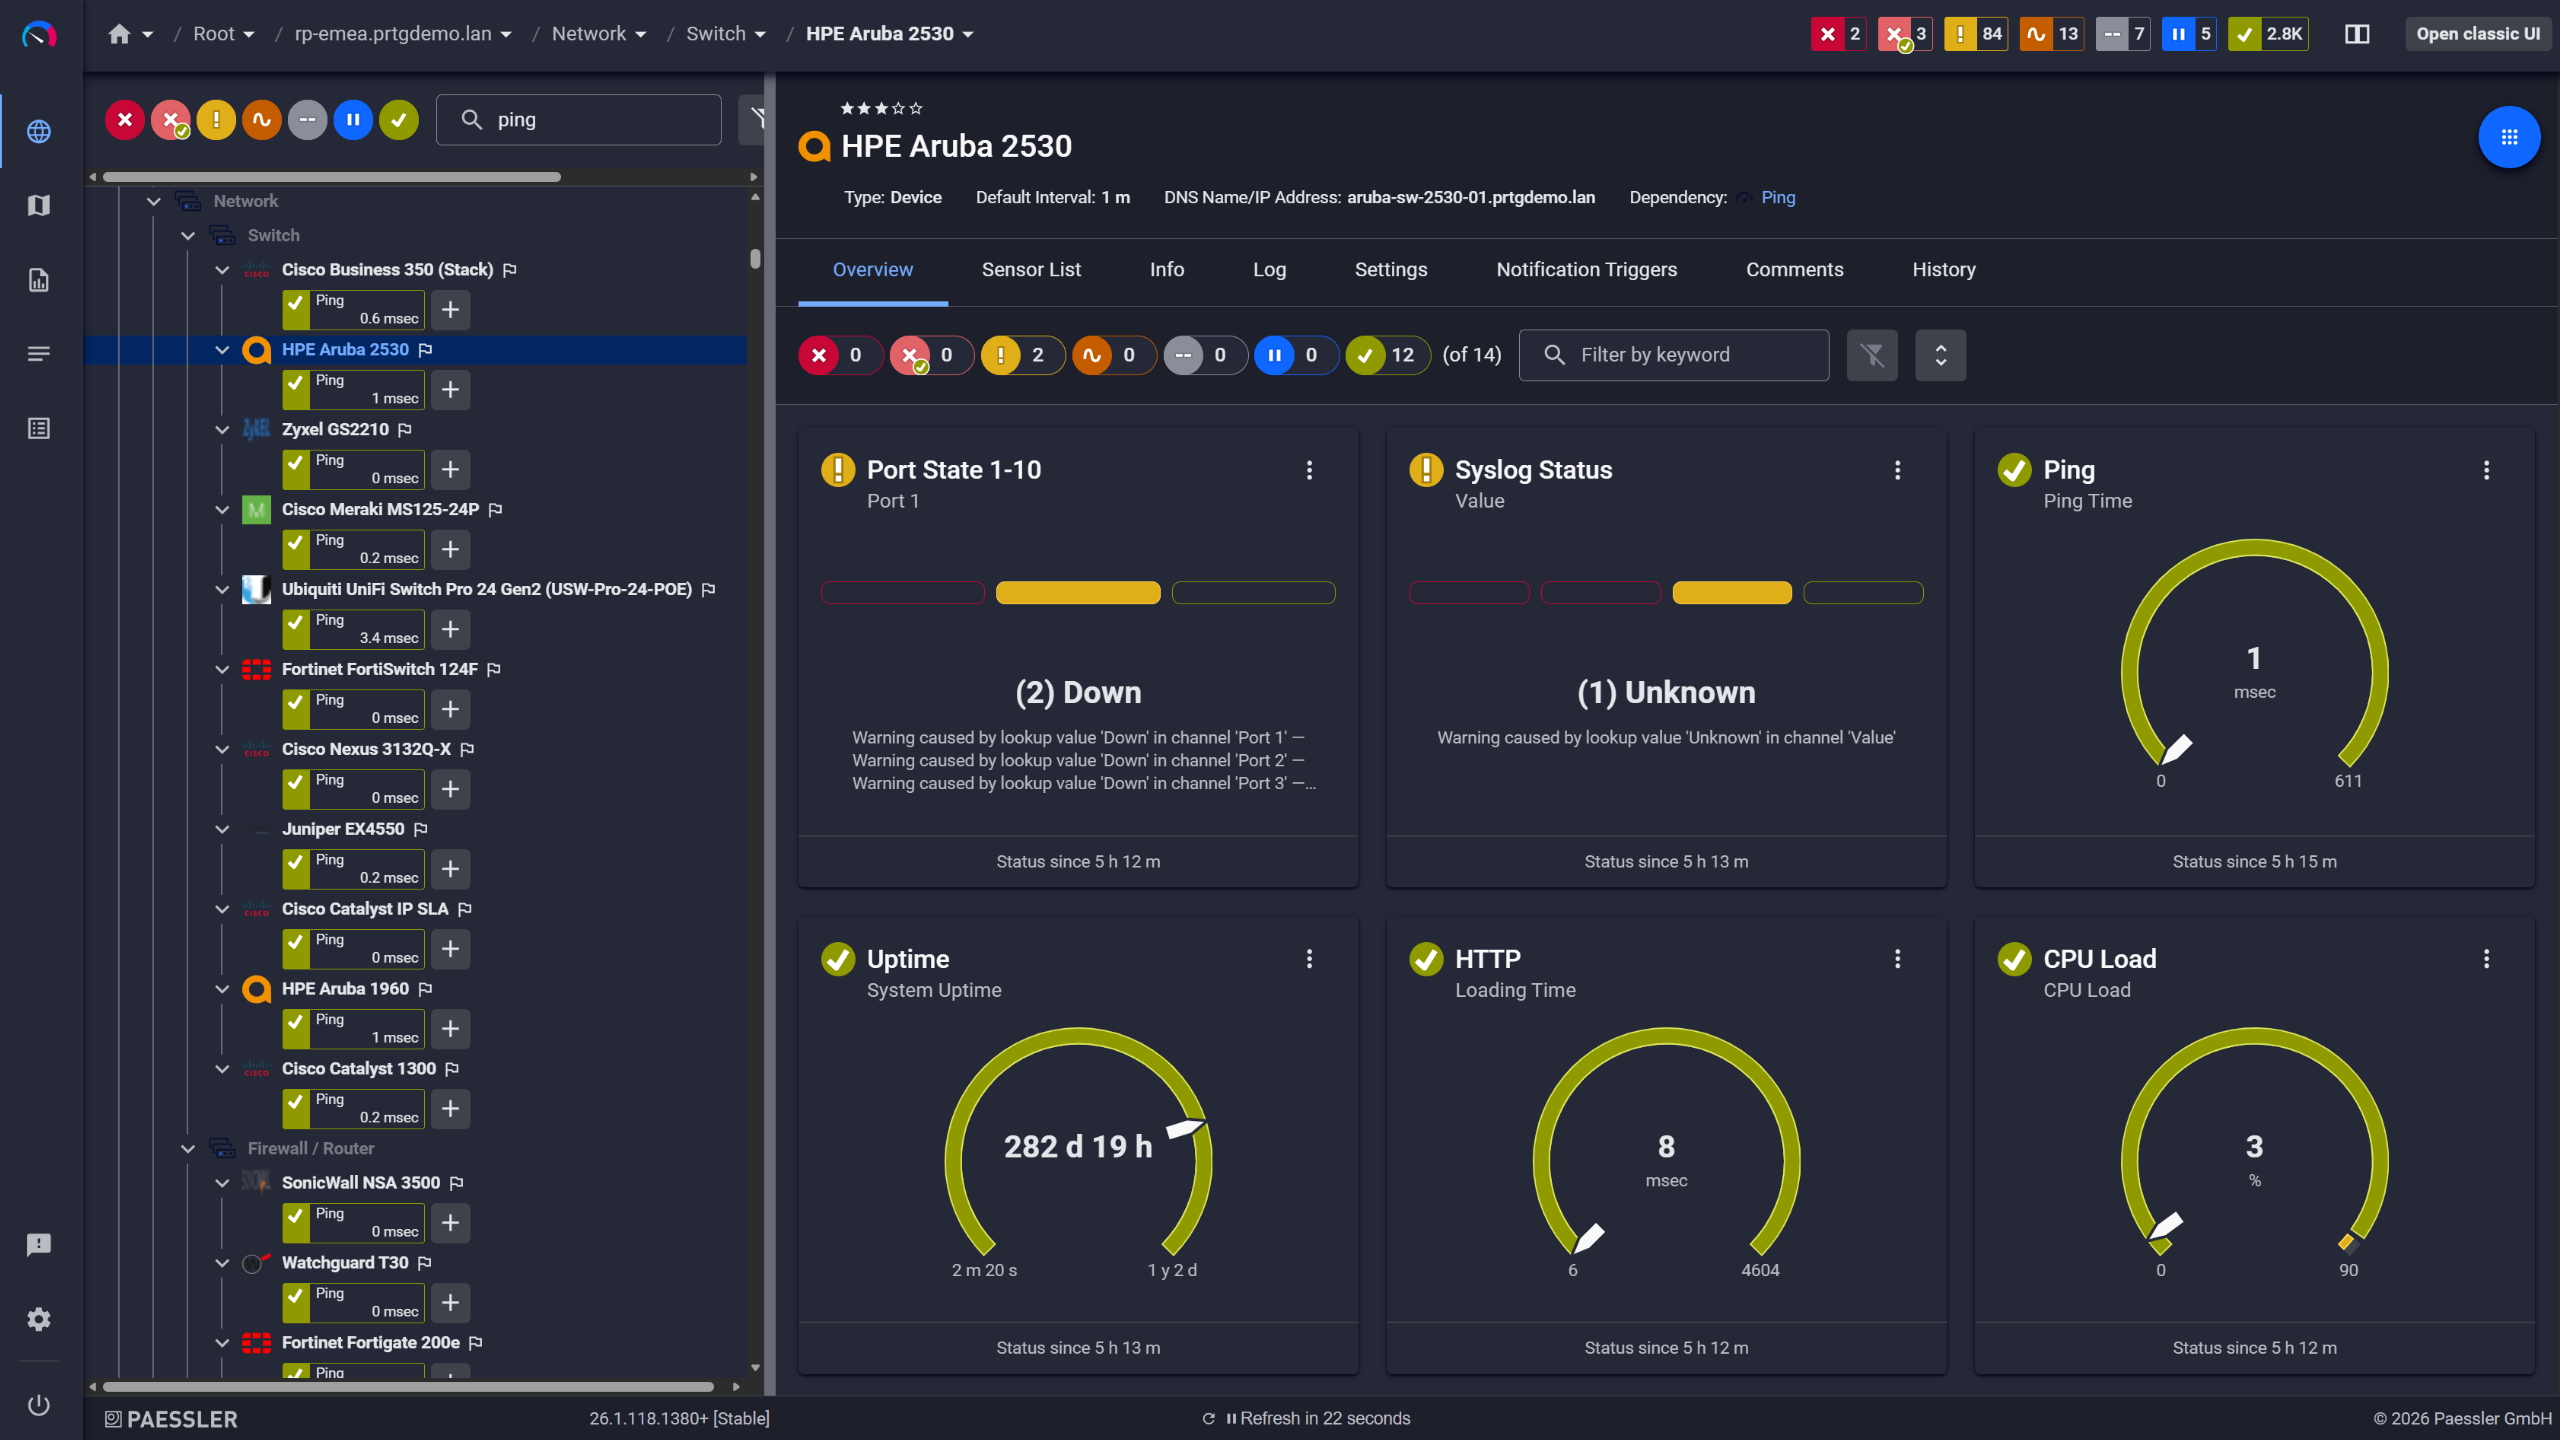
Network switches monitored across vendors

Full device list, instant overview
Active alerting on traffic thresholds means your team sees bandwidth changes as they happen and can respond while application performance is still intact, rather than reacting after the fact. PRTG monitors jFlow data continuously and sends alerts when traffic on a monitored interface or IP address crosses a defined threshold, via email, SMS, or push notification. If an issue persists, PRTG can repeat notifications at configured intervals. Monitoring covers WAN links, firewall interfaces, and internal segments equally.
Start monitoring your infrastructure in minutes. No professional services, no complex configuration, no risk.
Justifying a WAN upgrade, or arguing against one, requires more than a current utilization snapshot. You need peak usage patterns, sustained load over time, and growth trends that are hard to pull together manually. PRTG retains historical jFlow data per interface, so bandwidth utilization trends over days, weeks, or months are always available on any monitored connection. That data is exportable, making it practical to share with leadership or service providers when backing up a capacity planning decision with real numbers.

Scheduled reports, always on time
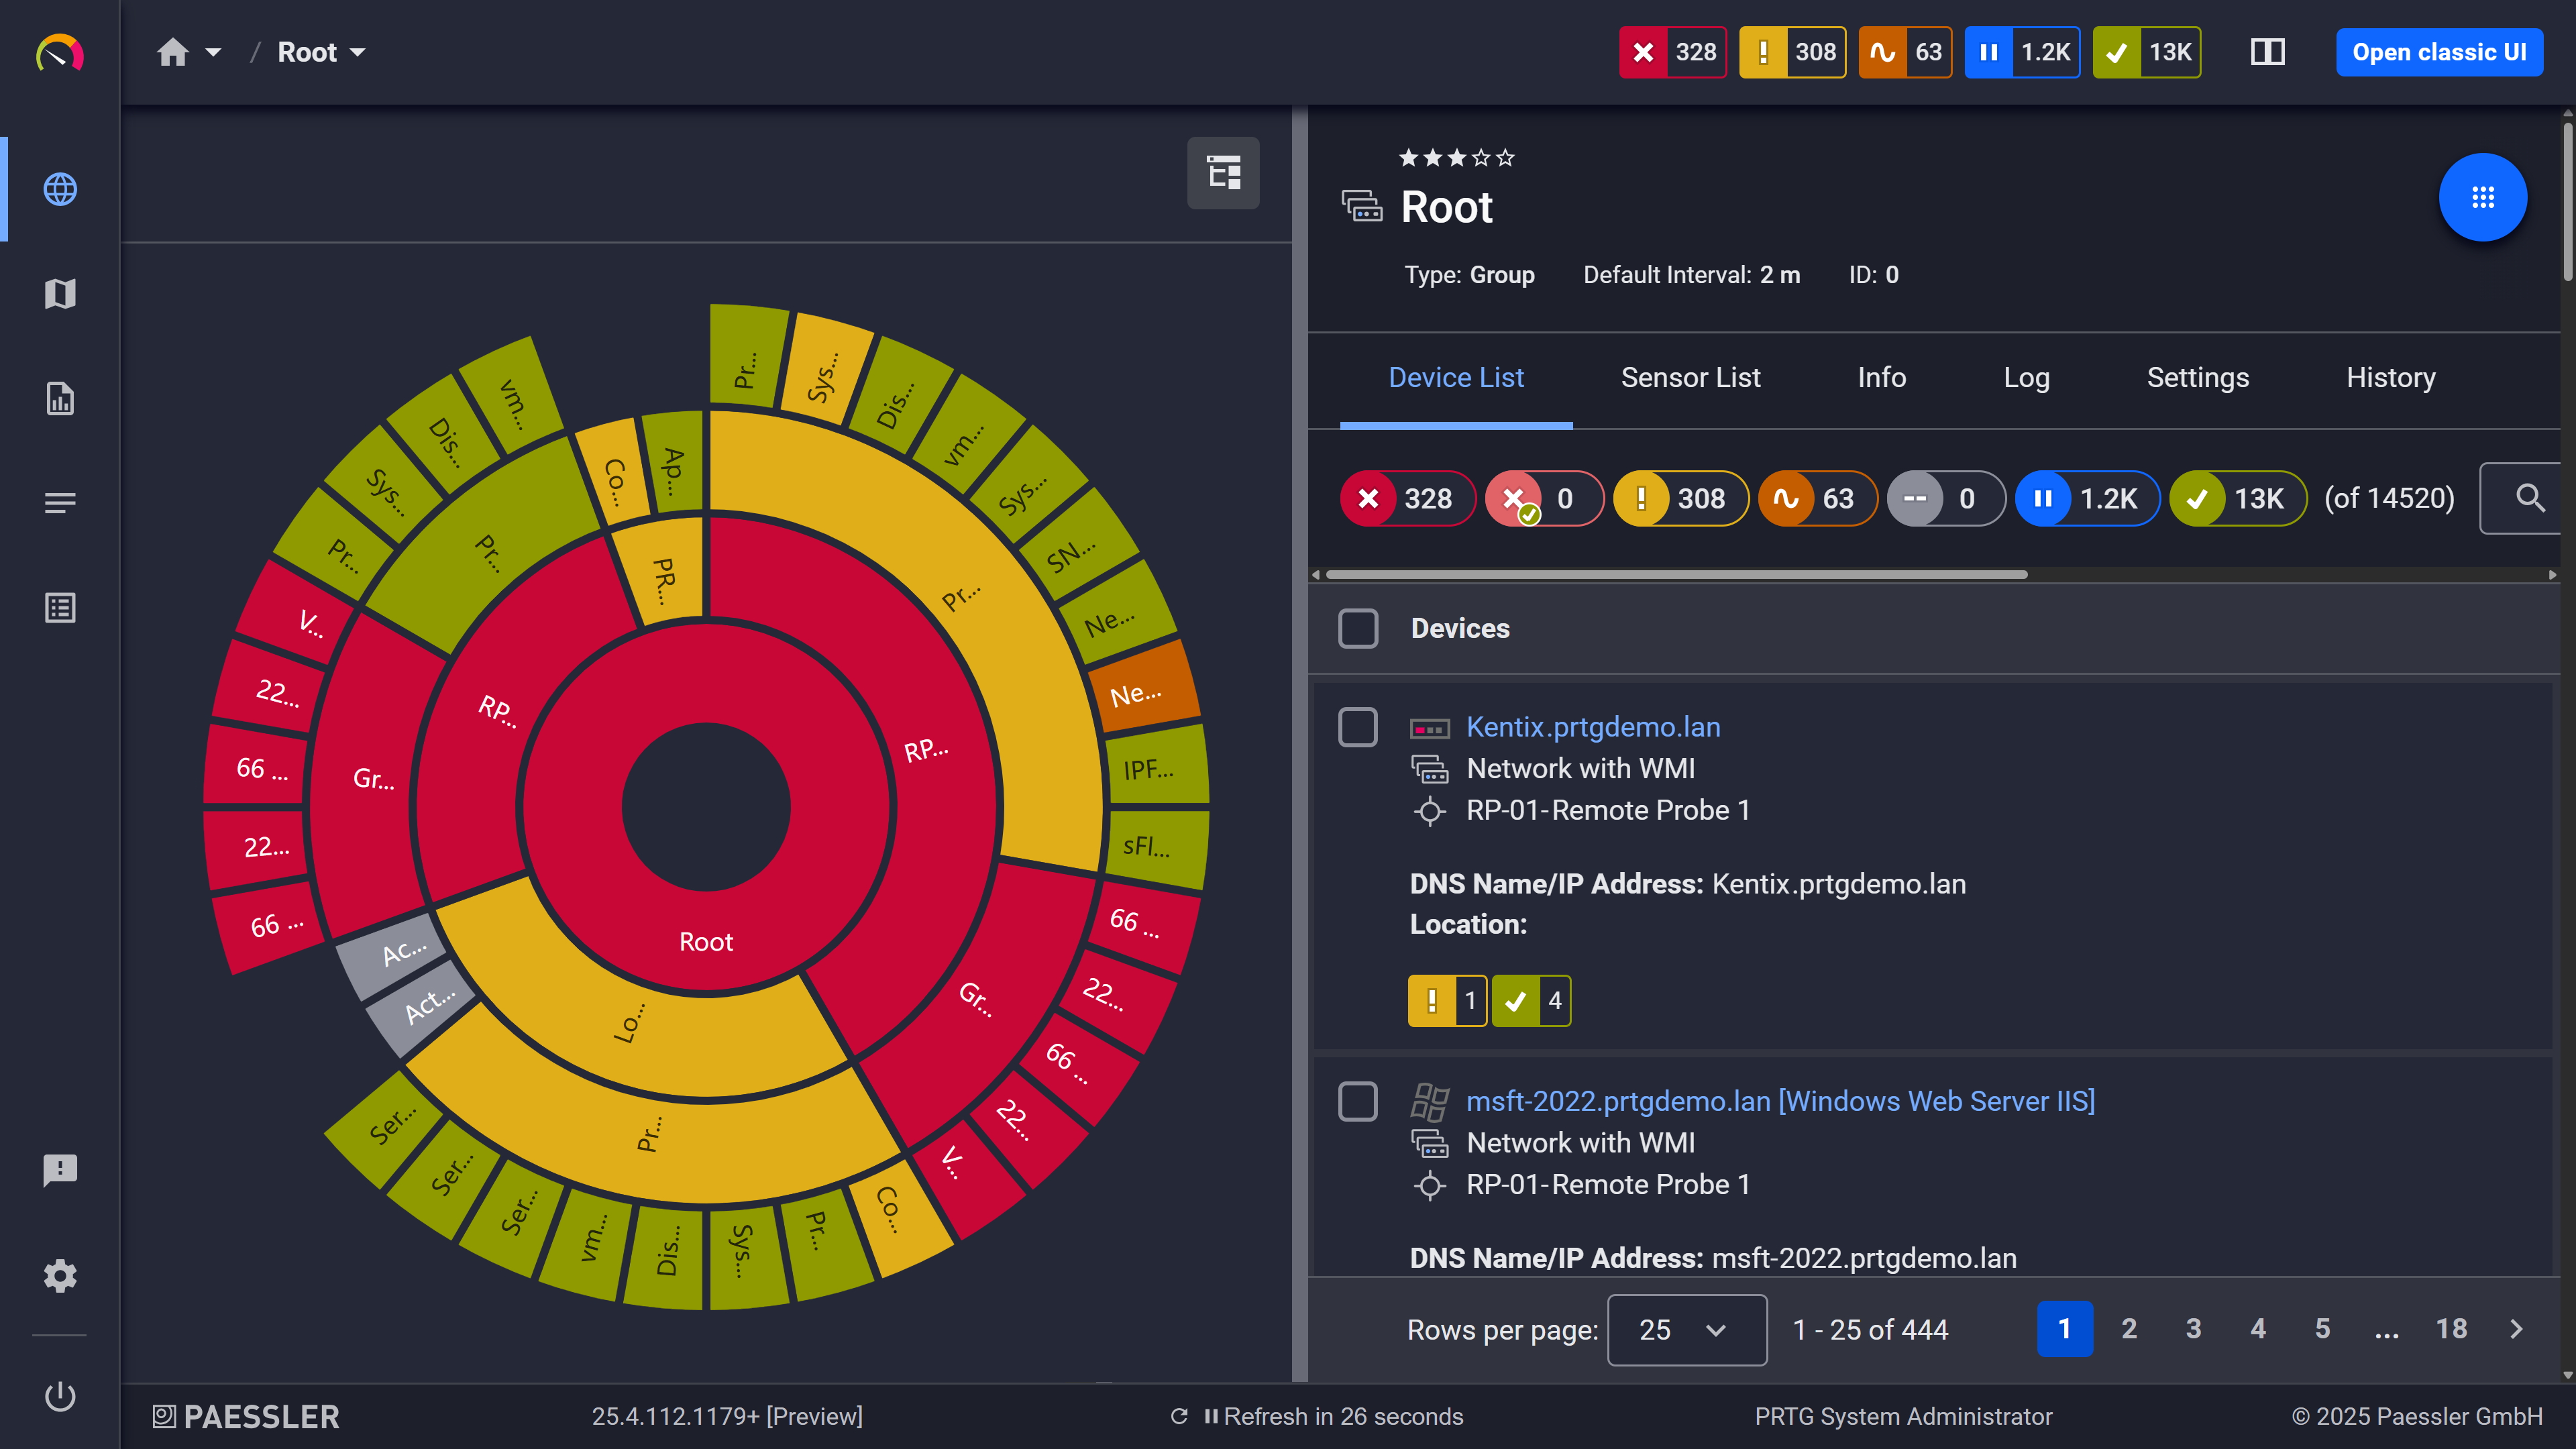
Your entire network, visualized instantly
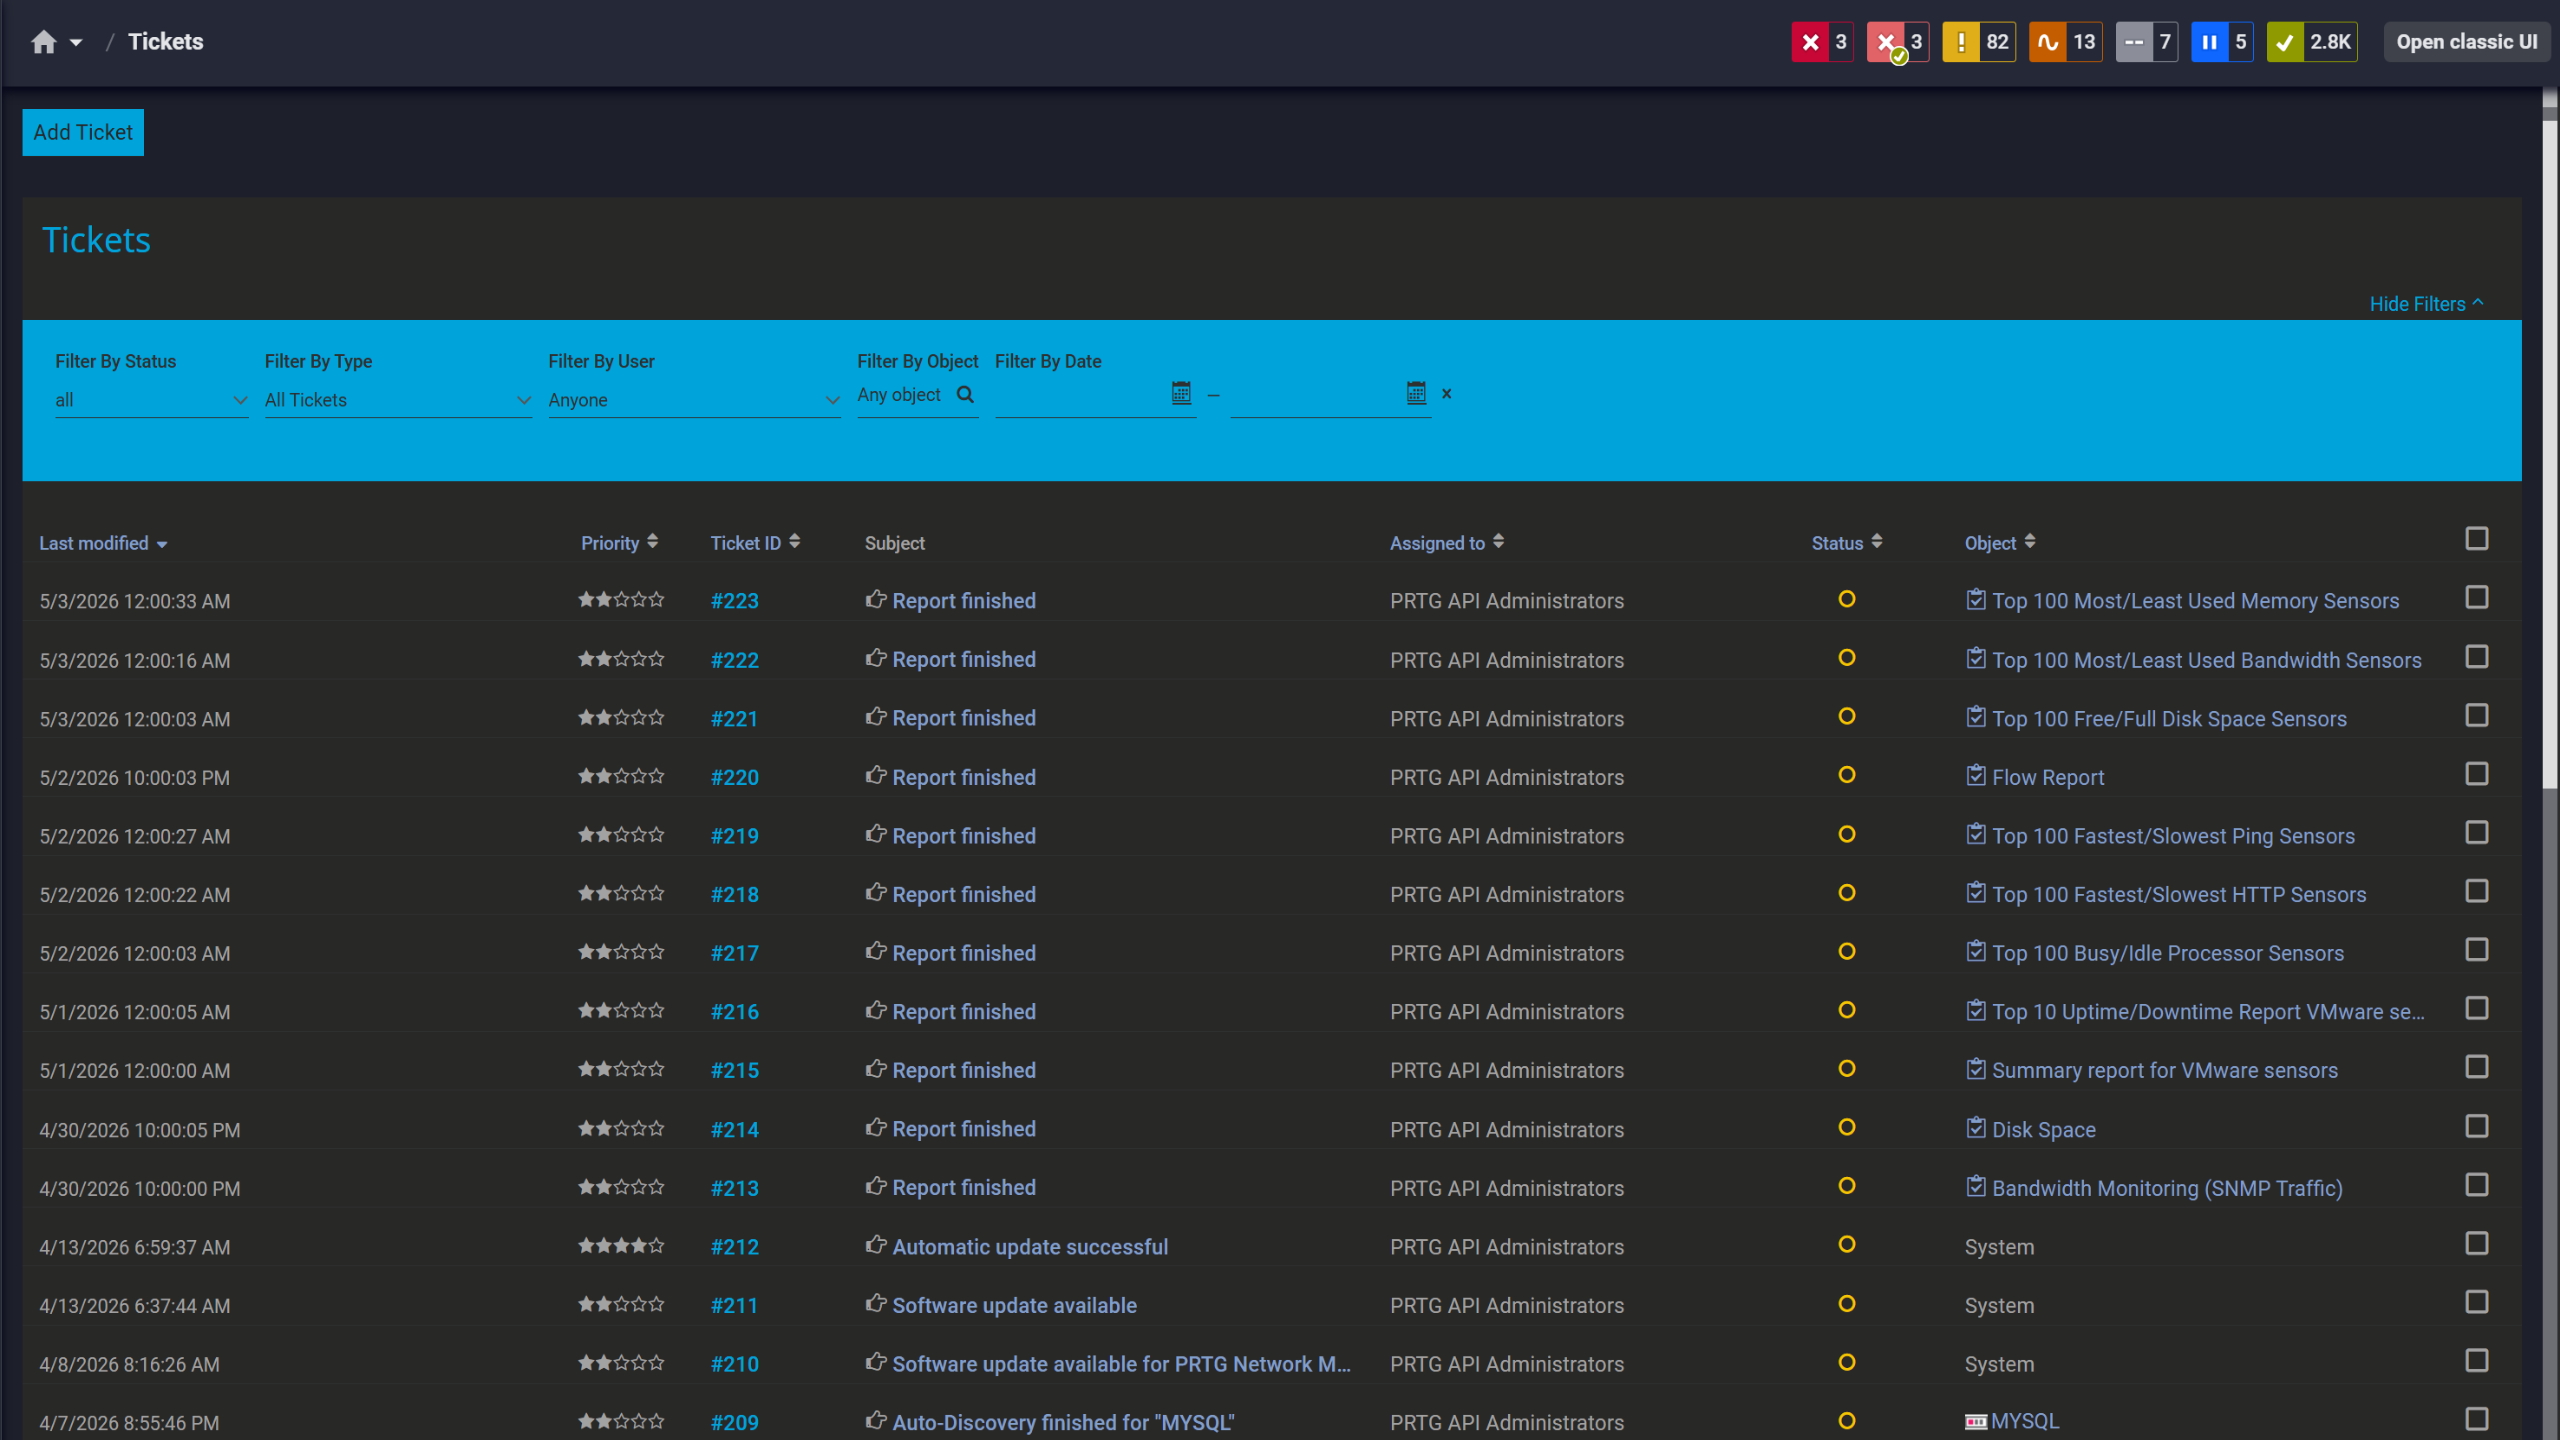
Tickets keep your team aligned
Here's a look at the sensors, protocols, and methods PRTG uses to collect and process jFlow data. This isn't a configuration guide. It's the technical overview you need to assess whether PRTG fits your environment.
Capability | Without PRTG Without PRTG | With PRTG With PRTG |
|---|---|---|
Identify top bandwidth consumers | Without PRTG CLI queries per device, per incident | With PRTG Top Talkers, Top Connections, Top Protocols, per sensor on demand |
Multi-protocol flow collection | Without PRTG Separate tools per vendor | With PRTG jFlow v5, NetFlow, IPFIX, sFlow in one place |
Historical bandwidth trend analysis | Without PRTG Custom logging scripts or manual export | With PRTG Stored automatically, visualized in graphs |
Threshold alerting on traffic | Without PRTG Manual checks or custom scripting | With PRTG Configurable per sensor, alerts sent automatically |
Application-type traffic breakdown | Without PRTG Not available via SNMP alone | With PRTG Native via jFlow v5 and IPFIX sensor channel groups |
Choose the PRTG Network Monitor subscription that's best for you.
| License Name | License description | Price | License Details | Get started | Pricing Details | |
|---|---|---|---|---|---|---|
| PRTG 500 | $200 | per month paid annually | Buy nowBuy now | Enough to monitor multiple aspects of 50 devices | ||
| PRTG 1000 | $358 | per month paid annually | Buy nowBuy now | Enough to monitor multiple aspects of 100 devices | ||
| PRTG 2500 | $742 | per month paid annually | Buy nowBuy now | Enough to monitor multiple aspects of 250 devices | ||
| PRTG 5000 | $1,300 | per month paid annually | Buy nowBuy now | Enough to monitor multiple aspects of 500 devices | ||
| PRTG 10000 | $1,642 | per month paid annually | Buy nowBuy now | Enough to monitor multiple aspects of 1000 devices |

jFlow is Juniper Networks' flow monitoring protocol, built into JunOS. Like NetFlow (Cisco's equivalent), it exports data on every traffic flow passing through a network device: source and destination IP addresses, port numbers, protocol, and traffic volume. That data goes to a flow collector for analysis.
NetFlow and jFlow work the same way in concept; the difference is vendor origin. NetFlow is Cisco's implementation, jFlow is Juniper's. sFlow works differently: rather than exporting data on every flow, it uses statistical sampling, capturing only a fraction of packets, which makes it more resource-efficient on high-speed networks but less granular. IPFIX is the IETF open standard derived from NetFlow v9 and is now supported across multiple vendors, including Juniper.
jFlow is available on Juniper devices running JunOS. That covers MX series routers, EX series switches, SRX series firewalls, and virtual platforms like vSRX and vMX. Whether a device exports jFlow v5 or IPFIX depends on the platform and JunOS version. Check your device documentation to confirm what your hardware supports and what export format makes sense for your setup.
Yes. PRTG has separate sensors for jFlow v5 and IPFIX, and both can run within the same PRTG instance. If your Juniper device supports both export formats, you can use both sensors. In practice, you'd typically choose one. The jFlow v5 sensor uses predefined channel groups; the IPFIX sensor supports more flexible field mapping, handles IPv4 and IPv6 flow records, and gives you more control over what data the device exports. Both sensor types share the same per-probe limit of up to 50 sensors. Your choice between them comes down to device support, field set requirements, and how your JunOS version exports data.
On the Juniper device side, you configure flow export to point to the IP address of your PRTG probe on the UDP port you want to use. On the PRTG side, you add a jFlow v5 or IPFIX sensor to the device and set the matching UDP port. PRTG starts receiving and processing flow records as soon as the export is active and the sensor is configured. No separate flow collector software is needed. PRTG handles that functionality directly.
Yes. All xFlow sensors in PRTG (jFlow v5, NetFlow, IPFIX, and sFlow) can run simultaneously within the same PRTG instance. Each sensor handles its own protocol independently, and data from all sources is available in a single dashboard. This makes PRTG a solid flow collector for environments with Juniper and Cisco devices running side by side, along with anything else exporting sFlow or IPFIX.
From jFlow exports, PRTG shows:
By default, jFlow exports a flow record for every active traffic flow passing through the device. On high-traffic links, this can generate a large volume of flow records and put real load on both the Juniper device and the PRTG probe. Enabling sampling tells the device to export only every n-th packet (for example, one in every 100), which reduces that load significantly.
The trade-off is precision. With sampled data, low-volume flows may not appear in the data at all, and traffic volume figures are estimates rather than exact counts. Sampling makes sense on high-bandwidth links where full export isn't practical. For links with moderate traffic, full flow export typically works fine and gives you more accurate jFlow data to work with.
Both jFlow v5 and IPFIX sensors have a very high performance impact. Paessler recommends a maximum of 50 of either sensor type per probe. For deployments that exceed that, distributing monitoring across additional PRTG remote probes is the standard scaling path.
If you're choosing between jFlow v5 and IPFIX for a larger Juniper environment, the deciding factors are device and JunOS version support, the field set you need, and IPv6 requirements. Not a difference in per-probe limits. Where your Juniper devices support IPFIX export and you need broader data flexibility, IPFIX is generally the stronger long-term choice. NetFlow sensors carry the same per-probe limit of 50.
Network Monitoring Software – Version 26.1.116.1532 (February 9th, 2026)
Download for Windows and cloud-based version PRTG Hosted Monitor available
English, German, Spanish, French, Portuguese, Dutch, Russian, Japanese, and Simplified Chinese
Network devices, bandwidth, servers, applications, virtual environments, remote systems, IoT, and more
Choose the PRTG Network Monitor subscription that's best for you


