• Company
    • About Us
    • Case Studies
    • Press Center
    • Careers
    • Blog
    • Contact us
  • Contact us
  • Login
 
  • English
    • Deutsch
    • Español
    • Français
    • Italiano
    • Português
Paessler
                    - The Monitoring Experts
  • Products
    • Paessler PRTG
      Paessler PRTGMonitor your whole IT infrastructure
      • PRTG Network Monitor
      • PRTG Enterprise Monitor
      • PRTG Hosted Monitor
      • PRTG UVexplorer
      • PRTG extensionsExtensions for Paessler PRTGExtend your monitoring to a new level
    • Icon Features
      FeaturesExplore all monitoring features
      • Maps & dashboards
      • Alerts & notifications
      • Multiple user interfaces
      • Distributed monitoring
      • Customizable reporting
  • Solutions
    • Industries
      IndustriesMonitor various industry sectors
      • Industrial
      • Healthcare
      • Data Center
      • Education
      • Finance
      • Government
    • IT Topics
      IT TopicsMonitor all areas of IT
      • Network Monitoring
      • Bandwidth Monitoring
      • SNMP Monitor
      • Network Mapping
      • WiFi Monitoring
      • Server Monitoring
  • Pricing
  • Resources
    • Getting Started
      Getting StartedModules for self-paced learning
    • How-to Guides
      How-to GuidesGet the most out of PRTG
    • Videos & Webinars
      Videos & WebinarsLearn from Paessler experts
    • IT  Knowledge
      IT KnowledgeExpand your IT knowledge
    • PRTG Manual
      PRTG ManualFull documentation
    • Knowledge Base
      Knowledge BaseShare community knowledge
    • PRTG Sensor Hub
      PRTG Sensor HubGet sensors, scripts & templates
    • Trainings
      PRTG TrainingLearn how to work with PRTG
  • Partners
    • Icon Handshake
      Become a PartnerFor resellers and channel partners
    • Icon MSP
      Become an MSPDeliver monitoring as a managed service
    • icon partner
      Partner PortalLog in to your partner account
    • Deal Registration
      Deal RegistrationRegister your sales opportunities
    • icon search
      Find a PartnerFind partners selling Paessler products
    • icon technology
      Technology AlliancesSee Paessler technology partnerships
    • Partner HubTools for Your Success
  • Company
    • About Us
    • Case Studies
    • Press Center
    • Careers
    • Blog
    • Contact us
  • Contact us
  • Login
  • English
    • Deutsch
    • Español
    • Français
    • Italiano
    • Português
  • Get a quote
  • Free trial

Centralized Free Disk Space Analyzer 

Monitor disk capacity on Windows servers, Linux systems, and network storage

Free download
PRODUCT OVERVIEW

How Do Free Disk Space Analyzers Monitor Storage Across Multiple Servers?

Tracking free disk space across dozens of servers, storage arrays, and network shares is straightforward on a single system but gets complicated fast at infrastructure scale. Different platforms expose storage data differently: Windows uses WMI, Linux uses SSH, network storage typically speaks SNMP or a vendor REST API. Doing that manually across a mixed environment means logging into each system individually or maintaining a patchwork of scripts.  

Paessler PRTG handles that layer centrally, without agents. Auto-discovery scans your network and creates sensors for detected storage devices, so you're not building that list by hand. Monitoring runs continuously from there: threshold breaches trigger alerts, and historical data lets you track usage trends before they become a capacity issue. All of it lands in one dashboard, whether you're managing Windows servers, Linux systems, NetApp arrays, or Hyper-V cluster shared volumes. 

Download PRTG Trial

What you will find on this page

  • Disk Space Monitoring for Your Infrastructure
  • How PRTG Monitors Disk Space
  • PRTG vs. Manual Disk Space Monitoring
  • FAQs

PRTG is compatible with all major vendors, products, and systems

compatible with all major vendors, products, and systems

Disk Space Monitoring That Works Across Your Entire Infrastructure

Stay Ahead of Disk Capacity with Threshold Alerts  

Storage consumption grows continuously: log files accumulate, databases expand, users upload. PRTG tracks that growth in near real time so your team has the information to act before a volume reaches critical levels. Threshold alerts give you a configurable window between warning and action.  

Set warn at 80%, alert at 90%, or define whatever limits fit your environment. When a threshold breaches, notifications go out via email, SMS, push, or webhook. Continuous monitoring means sudden disk growth gets caught early, with enough lead time to free up space or expand capacity before anything downstream is affected. 

  • Continuous monitoring detects sudden disk growth before outages occur
  • Set custom threshold alerts per volume, with warn and alert limits you define
  • Notifications via email, SMS, webhook, or push keep response times short
  • Prevent downtime from full disks taking down databases, web servers, and apps
  • Proactively free up storage space before hard drive capacity hits critical levels

See Storage Usage Across All Locations from One Dashboard  

Distributed infrastructure across headquarters, cloud instances, and remote sites calls for a centralized view of storage status. PRTG's remote probe architecture monitors disk space across all those locations from one dashboard. Deploy probes at each site to collect local data, with everything flowing back to a single interface. Whether your storage is on-premises, in AWS, or at a remote site, free space status is visible in one place. 
  • Centralized dashboard for on-premises, cloud, and remote site storage 
  • Remote probes monitor distributed locations  
  • Filter by location, device type, or free space percentage for quick triage 
  • Stop logging into dozens of servers individually: monitor everything from one interface 
  • Support for Windows, Linux, network shares, and cloud storage  
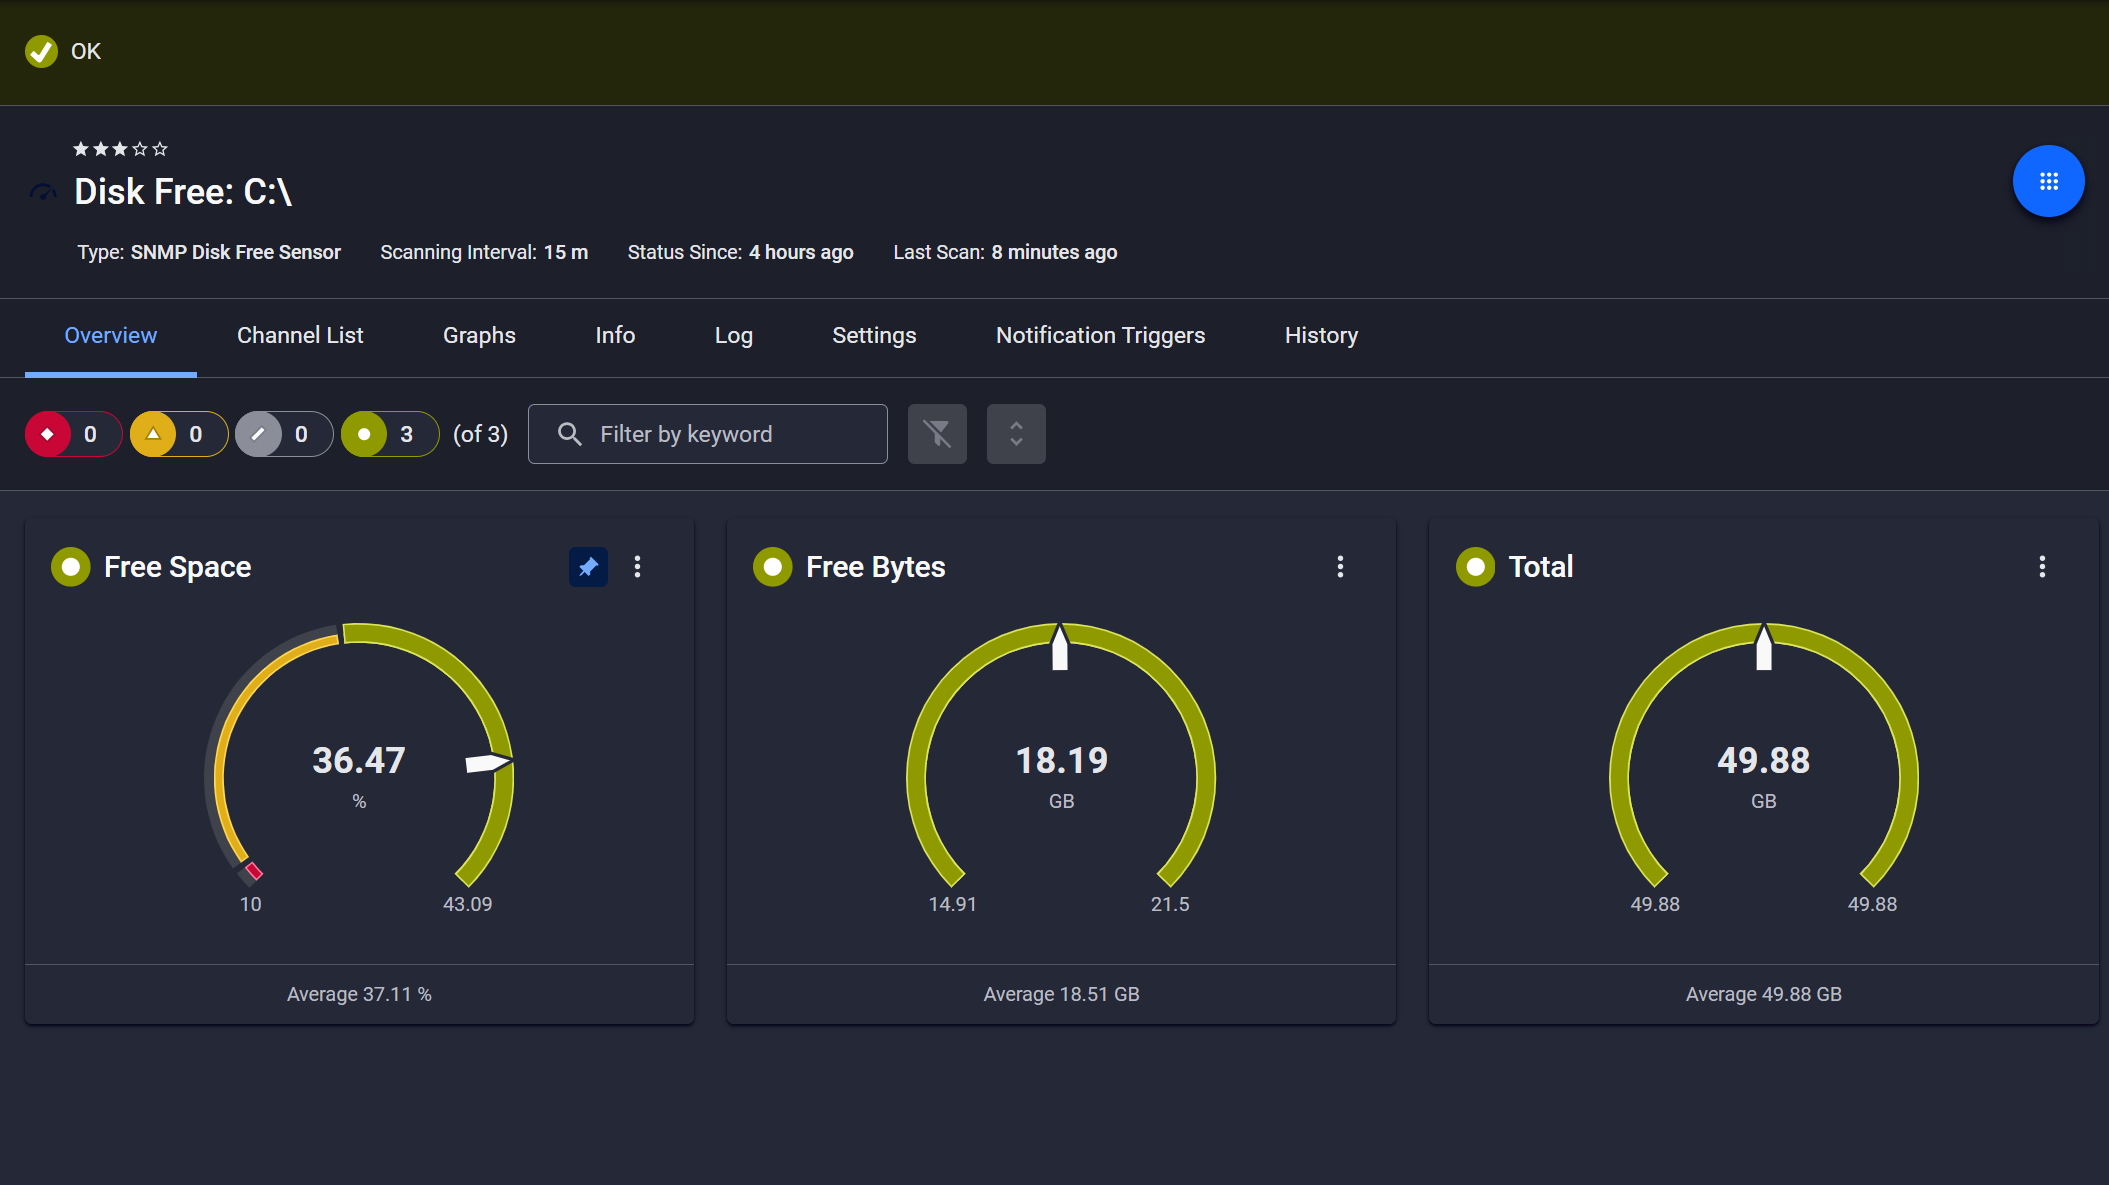
PRTG SNMP Disk Free sensor showing free space, free bytes, and total disk capacity gauges

Disk space monitored, alerts ready

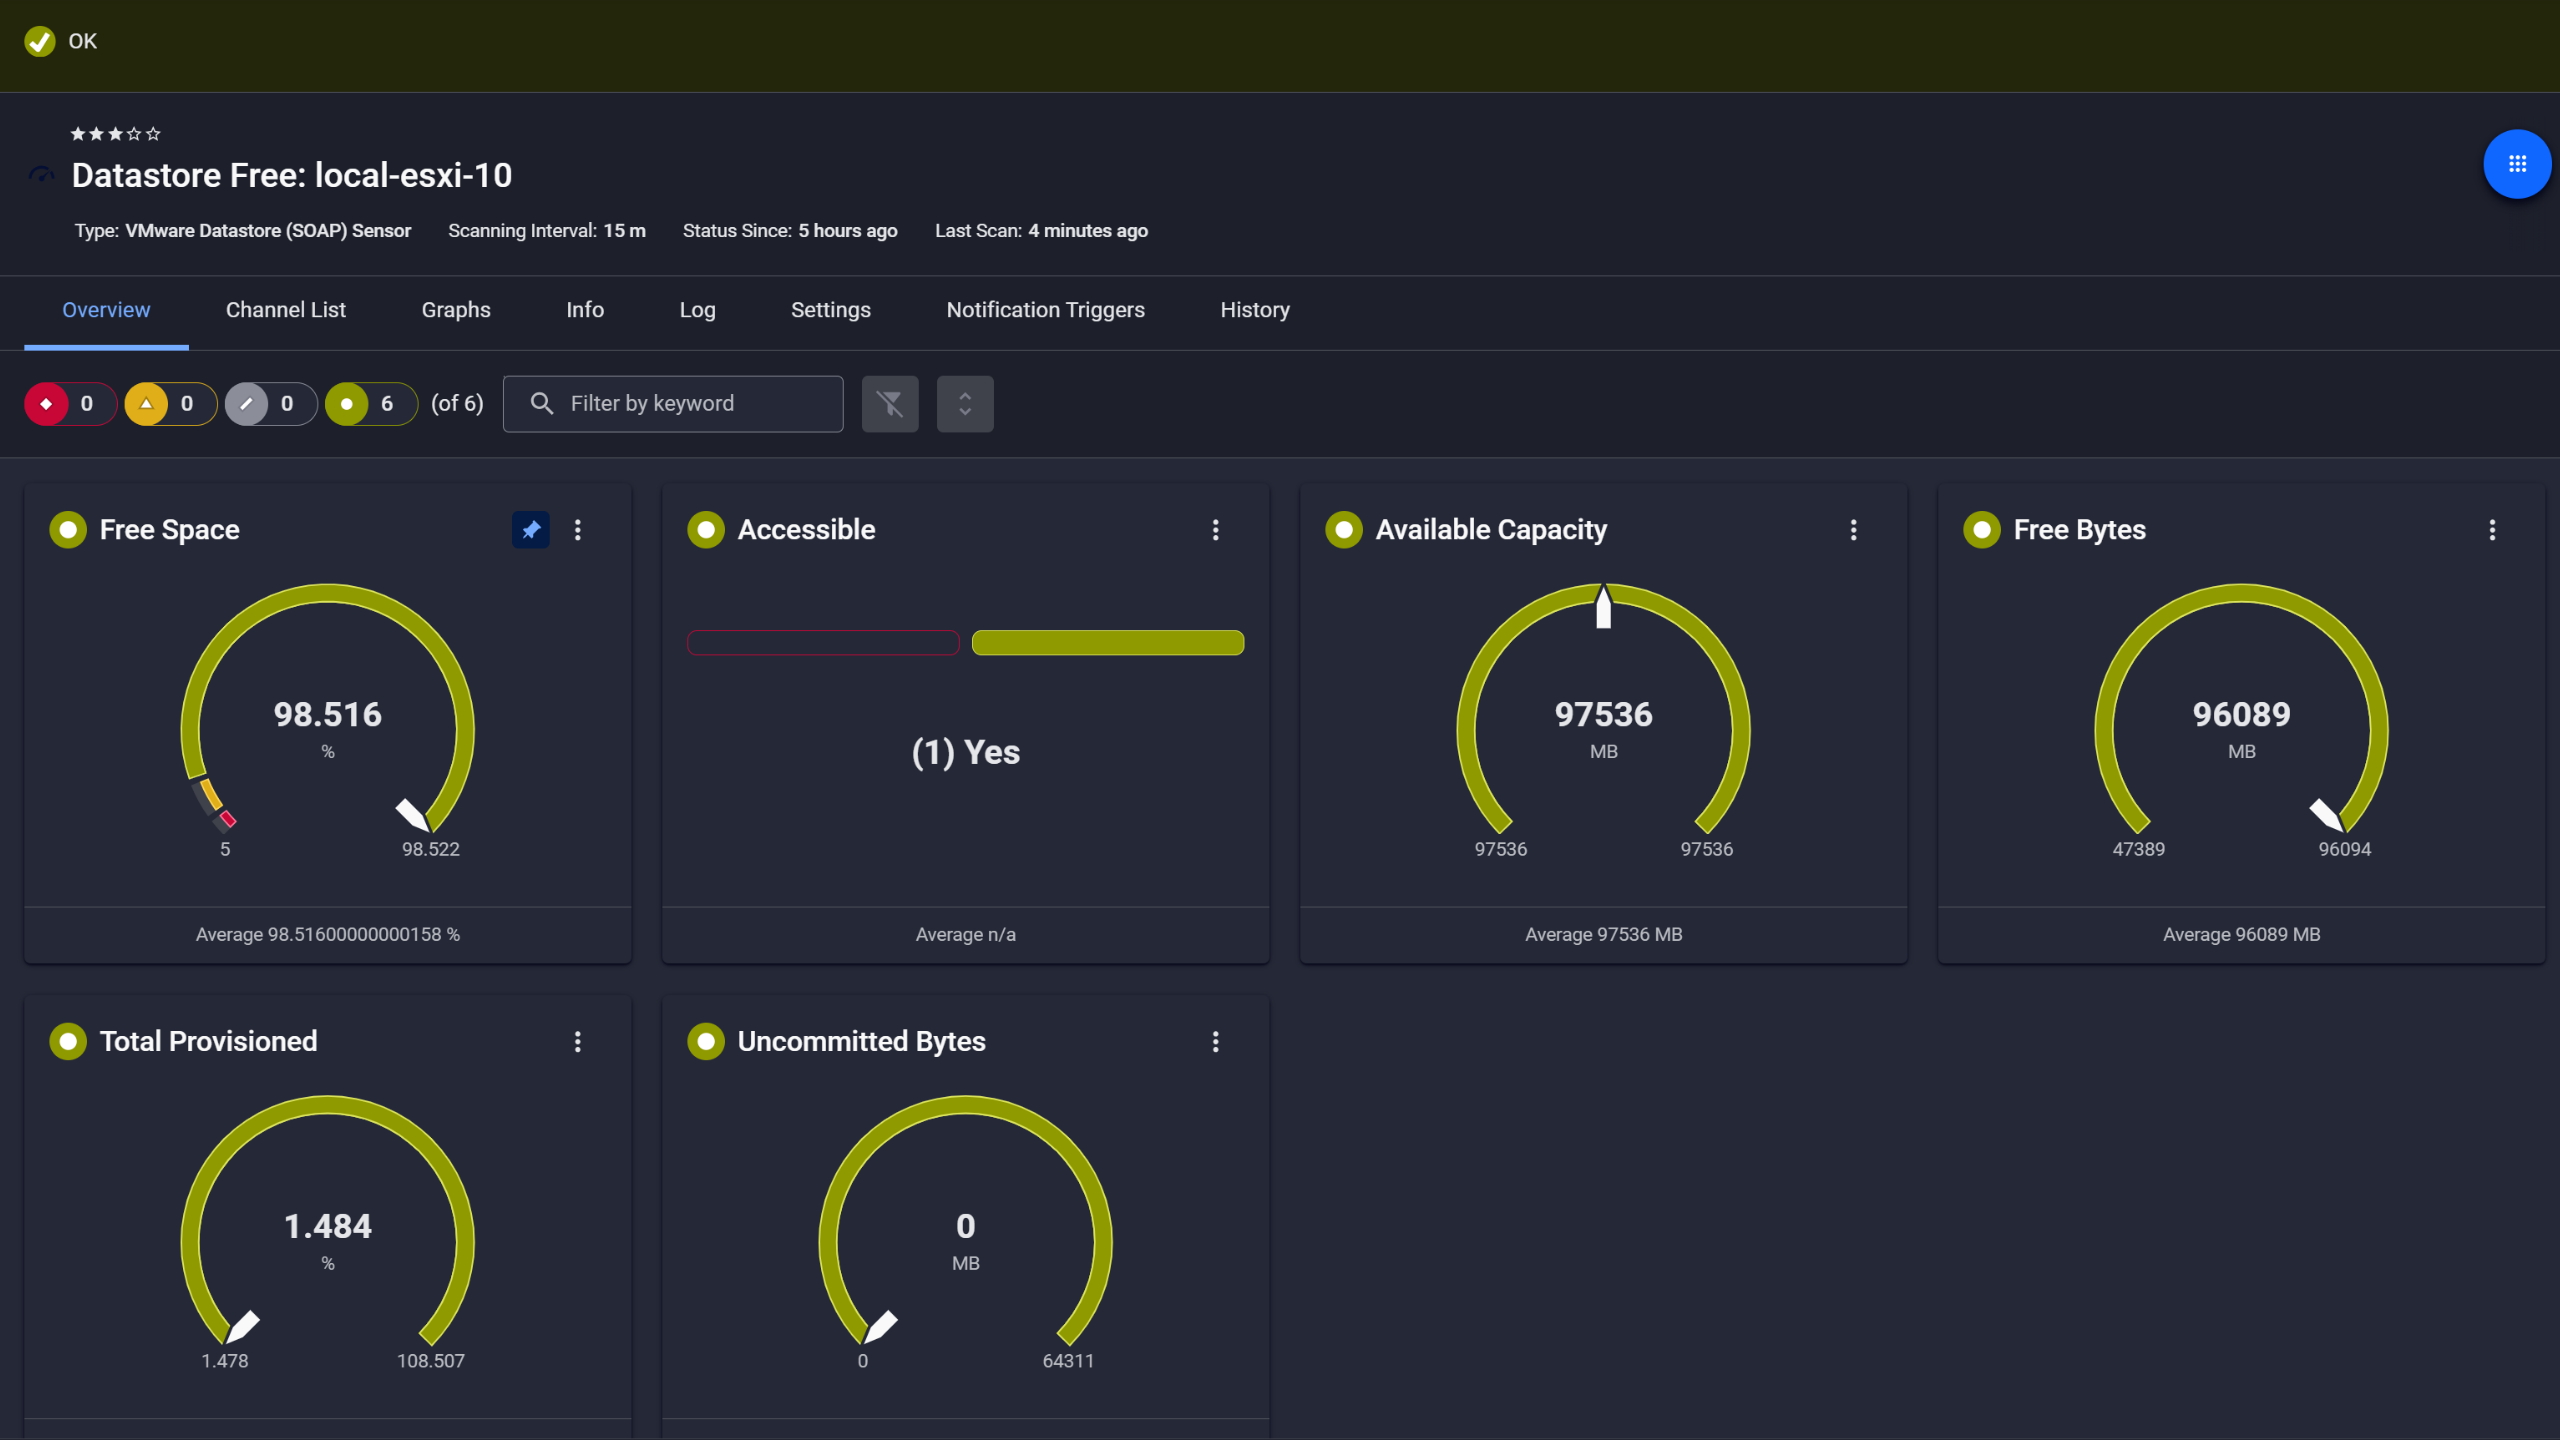
PRTG VMware Datastore sensor showing free space, capacity, and accessibility gauges

VMware datastore capacity, always visible

PRTG web interface showing device tree and full device list with sensor status badges

Full device list, instant overview

Reclaim Admin Time with Automated Monitoring  

Automated monitoring frees up the hours your team currently spends on routine disk space checks. PRTG's auto-discovery scans your network and creates sensors for detected storage devices automatically. Once configured, continuous monitoring runs 24/7 and only surfaces an alert when a threshold breaches. That's time back for work that actually requires your attention. 

  • Auto-discovery scans your network and creates disk sensors for detected devices automatically
  • Set up monitoring in minutes, not days of manual configuration
  • Alerts only when thresholds breach. No constant checks are required
  • Scheduled reports show capacity status without manual log reviews
  • Free your team from reactive checks: PRTG watches storage while you focus elsewhere

See Why IT Professionals Trust PRTG

Start monitoring your infrastructure in minutes. No professional services, no complex configuration, no risk.

Free download
PRODUCT OVERVIEW

Forecast Capacity Needs with Historical Trend Data  

Budget cycles don't align with emergency storage purchases. PRTG collects historical disk space usage data and displays growth trends in visual graphs. Our user-friendly disk usage analyzer gives you visibility into storage consumption over weeks, months, or years. See how volumes trend over time, then use that data to forecast when you'll need more space. Export reports to justify budget requests or plan infrastructure expansion before you run out.

  • Historical graphs show disk usage trends over customizable time periods  
  • Identify steady growth vs. sudden spikes for better capacity planning  
  • Export reports (PDF, HTML, CSV) to justify storage budget requests  
  • Trend data helps you plan proactive upgrades instead of emergency purchases  
  • Disk space analysis based on actual consumption patterns, not guesswork 
PRTG web interface showing live performance graphs for a Probe Health sensor

Live graphs, real-time performance data

PRTG reports list showing scheduled monitoring reports with run times and sensor counts

Scheduled reports, always on time

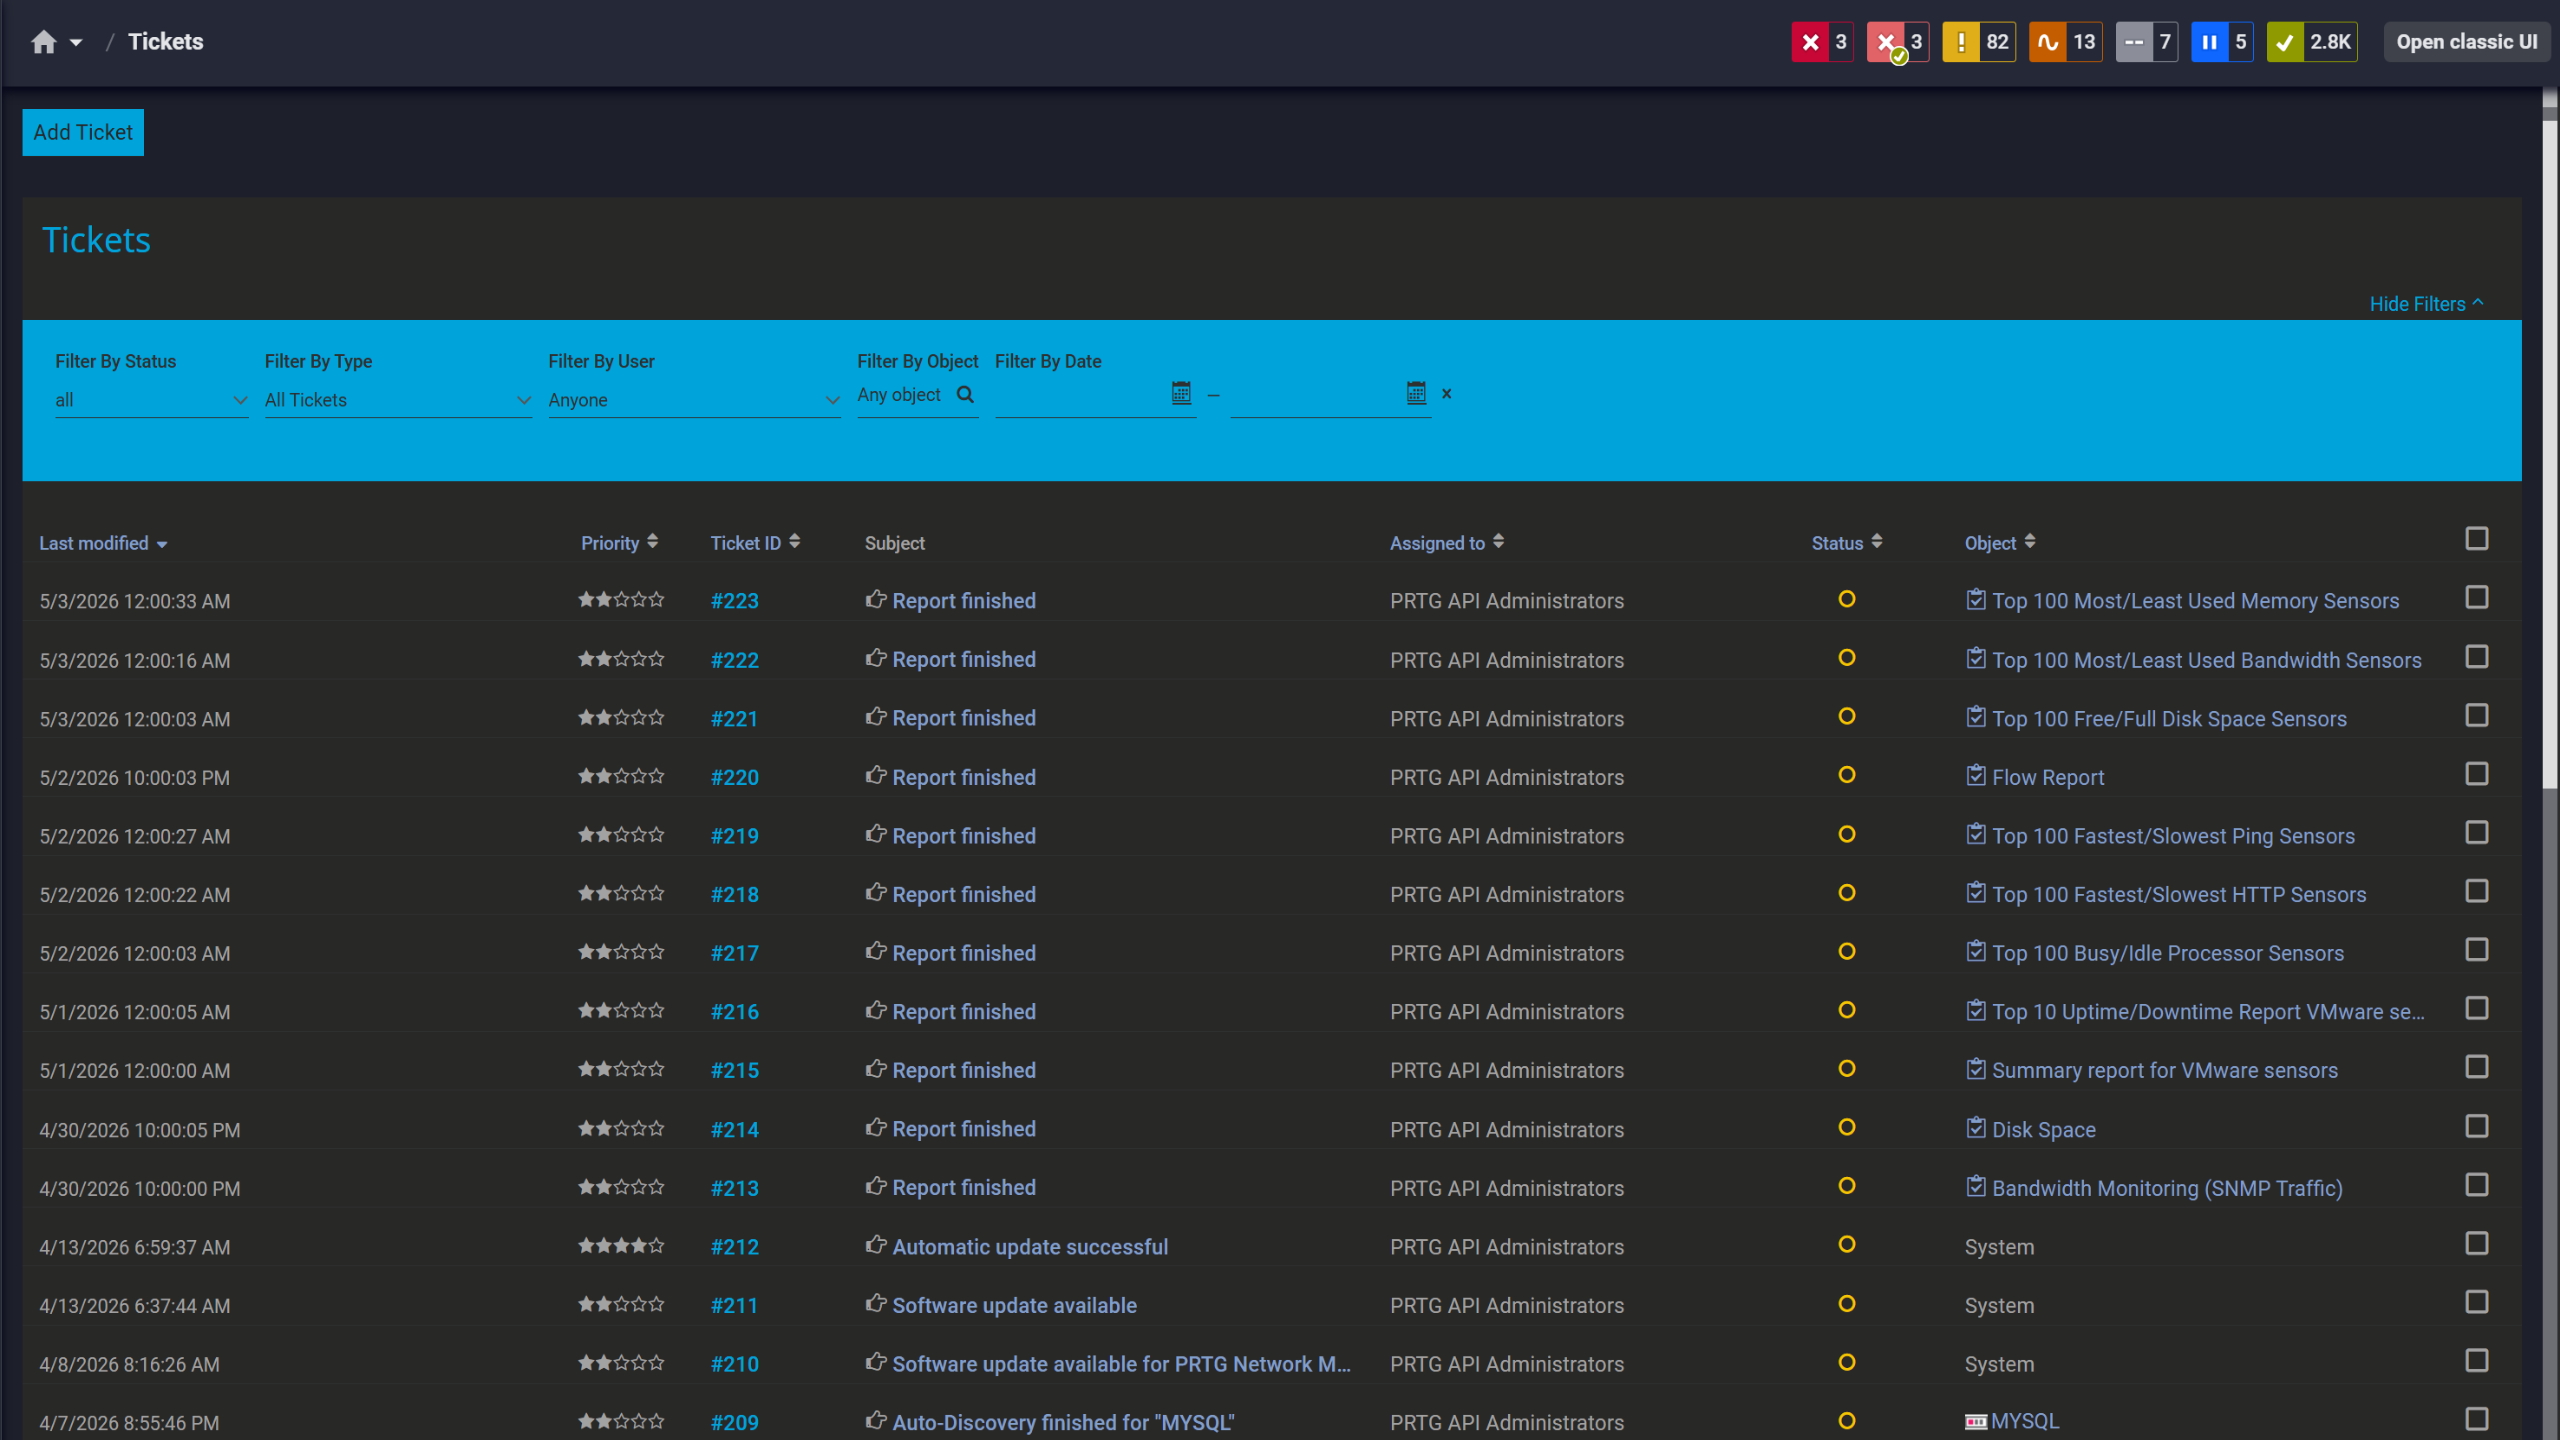
PRTG tickets list showing system notifications, report completions, and update alerts

Tickets keep your team aligned

Monitor Multi-Vendor Storage from One Platform  

Modern infrastructures mix Windows servers, Linux systems, NetApp arrays, Dell EMC storage, and Hyper-V environments. Managing vendor-specific tools for each creates complexity and blind spots. PRTG covers all major platforms using standard protocols (SNMP, WMI, SSH, and REST APIs) from a single interface.

  • Hundreds of native sensors cover Windows, Linux, NetApp, VMware, Hyper-V, Dell EMC, HPE  
  • One platform instead of separate vendor management software for each storage type  
  • NetApp Technology Partner status ensures verified integration and support  
  • Monitor SSD, HDD, and hybrid storage from the same interface  
  • Reduce tool sprawl and consolidate storage monitoring without vendor lock-in 

How PRTG Monitors Disk Space

PRTG uses native protocols to monitor disk space without agents or custom scripts. Choose the method that fits your environment: WMI for Windows, SSH for Linux, SNMP for network-attached storage. Here's how PRTG collects disk usage statistics across different platforms.

WMI Disk Monitoring

PRTG queries Microsoft Windows servers using Windows Management Instrumentation (WMI), no agent installation required. Sensors like WMI Volume and WMI Logical Disk I/O report free space, total capacity, and disk activity. WMI works across local servers and remote systems using Windows credentials you already have configured. This eliminates the overhead of deploying and maintaining agents on every Windows system in your environment.  

SSH Disk Monitoring

For Linux, Unix, Solaris, and macOS systems, PRTG uses the SSH Disk Free sensor. Authenticate via SSH credentials, and PRTG runs standard disk usage commands remotely to collect free space data. No agent installation, no custom scripts, just native SSH connectivity. The sensor reports total space, used space, and free space percentage per mounted volume. You get visibility into Linux server storage using the same secure shell access your admins already use. Scan results appear in the web interface after each polling cycle completes. 

SNMP Storage Monitoring

PRTG monitors NetApp and generic SNMP-capable storage using SNMP Disk Free sensors, and Dell EMC Unity storage via dedicated REST API sensors. SNMP sensors query storage arrays and report capacity metrics for logical disks and volumes. Dell EMC Unity sensors go further, providing storage pool and LUN-level capacity data. SNMP monitoring covers most enterprise storage devices that expose capacity data through standard MIBs. This creates the broadest compatibility path for NAS and SAN environments. 

Hyper-V Volume Monitoring

For Hyper-V environments, PRTG's Hyper-V Cluster Shared Volume Disk Free sensor tracks free space on shared storage used by virtualized workloads via PowerShell. This lets you catch capacity issues before they impact VM performance or availability. That includes the scenario where one VM fills a shared volume and takes down other workloads on the same cluster. The sensor requires Windows Server Failover Clustering (WSFC) on the target system.  

SMB Share Monitoring

PRTG's Share Disk Free sensor monitors Windows network shares and Samba shares via SMB protocol. Track free space on file servers, NAS devices, and shared storage without needing local access to the underlying system. Useful for monitoring departmental file shares or backup targets where you only have network-level access. The sensor connects to the share using network credentials and reports available capacity, similar to how you'd check a mapped drive in File Explorer.

free downLoad

PRTG vs. Manual Disk Space Monitoring 

FEATURE

Manual Monitoring

Manual Monitoring

With PRTG

With PRTG

Time to Set Up Monitoring

Manual Monitoring
not included

Hours or days to inventory servers, configure scripts, schedule checks 

With PRTG
included

Auto-discovery scans your network and creates sensors for detected devices — no manual inventory required 

Ongoing Effort

Manual Monitoring
not included

Daily manual checks across dozens of servers, compile data in spreadsheets 

With PRTG
included

Continuous monitoring runs 24/7 — you're only notified when thresholds breach 

Multi-Platform Coverage

Manual Monitoring
not included

Separate tools/scripts for Windows, Linux, NetApp, VMware — tool sprawl 

With PRTG
included

One platform monitors all via WMI, SSH, SNMP, and REST APIs 

Historical Trend Data

Manual Monitoring
not included

Manual log collection and spreadsheet tracking over time 

With PRTG
included

Automatic historical data collection with graphical trend visualization 

Alert Response Time

Manual Monitoring
not included

Hours or days until the next manual check discovers the problem 

With PRTG
included

Alerts fire as soon as a polling cycle detects a threshold breach — via email, SMS, or push notification 

free downLoad

“From a server perspective, we're monitoring all of the key components of our service such as CPU usage, RAM disk space, the Windows services that it's running, and network connectivity of that server. In terms of networks, we’re monitoring all of our switches, firewalls, and access points. It’s really useful to be able to easily pull performance metrics from the PRTG dashboard.”

Ollie Kerslake, Infrastructure Lead
Riverford Organic Farmers

“The tool has given us greater control over all types of devices connected to the network (switches, IP telephony, security cameras, IoT, WiFi) that previously remained opaque when dealing with service incidents. This has improved our ability to diagnose and resolve problems, which has translated into greater efficiency and a better user experience in both internal and public services.”

Jordi Tolosà Bel, New Technologies Technician
Vinaroz City Council

“Our objective was to be able to monitor the health of our most critical servers containing data and applications, but also the flows and bandwidth between headquarters, our 50 servers in the cloud and the 15 servers at our production sites. For us, it is essential to have a proactive approach to understand where the weaknesses of the IT system are to be able to improve them.”

Marc Boullier, CIO
Carambar & Co

Paessler PRTG Network Monitor licenses & pricing

Choose the PRTG Network Monitor subscription that's best for you.

License NameLicense descriptionPriceLicense DetailsGet startedPricing Details
PRTG 500$200per month paid annuallyBuy nowBuy now

Enough to monitor multiple aspects of 50 devices

PRTG 1000$358per month paid annuallyBuy nowBuy now

Enough to monitor multiple aspects of 100 devices

PRTG 2500$742per month paid annuallyBuy nowBuy now

Enough to monitor multiple aspects of 250 devices

PRTG 5000$1,300per month paid annuallyBuy nowBuy now

Enough to monitor multiple aspects of 500 devices

PRTG 10000$1,642per month paid annuallyBuy nowBuy now

Enough to monitor multiple aspects of 1000 devices

Over 100,000 Customers Worldwide Love Paessler  

customer success stories

 Free Disk Space Analyzer: Frequently Asked Questions 


Is PRTG a disk space analyzer like WinDirStat, TreeSize, or WizTree?

No. PRTG monitors total free disk space across your infrastructure, not file-level analysis. Tools like WinDirStat, TreeSize, WizTree, and SpaceSniffer show which folders and files consume space on a single computer using treemap visualization. They scan your hard drive and show directory statistics, largest files, duplicate files, and space hogs down to individual file types and hidden files.  

PRTG answers a different question: "What's the free space status across all my servers, storage arrays, and network shares?" Use PRTG for infrastructure-wide capacity monitoring, and desktop tools like TreeSize or WizTree for file cleanup on individual systems. Think of it this way: PRTG tells you which servers are running low on space, then you use file system tools to investigate what's filling them. 

Can PRTG identify which files or folders are consuming the most space?

No. PRTG monitors free space totals and trends, it doesn't drill into individual files, folders, or directory structures. For file-level analysis, use native OS tools (the du command on Linux, storage reports on Windows Server) or third-party utilities designed for that purpose. PRTG focuses on infrastructure-wide capacity monitoring, not analyzing which caches or large files exist on individual systems. 

Does PRTG work on Windows 11, Linux, macOS, and network storage?

Yes. PRTG monitors disk space across all major platforms using native protocols. Microsoft Windows systems use WMI, agentless and built into the OS. Linux, Unix, macOS, and Solaris systems use SSH connectivity. Network-attached storage from NetApp and HPE uses SNMP; Dell EMC Unity uses dedicated REST API sensors.  

PRTG also monitors Hyper-V Cluster Shared Volumes and network shares accessible via SMB. In general, any device that exposes disk usage statistics through WMI, SSH, or SNMP can be monitored.  

Can PRTG clean up disk space or delete junk files?

No. PRTG is a monitoring tool, not a disk cleanup or optimization tool. It monitors free space and alerts you when thresholds breach, but it doesn't delete files, clear caches, or perform cleanup operations.  

Once PRTG alerts you to low disk space, you use operating system utilities (Disk Cleanup on Windows, package manager cache clearing on Linux) or third-party cleanup tools to reclaim space. PRTG provides the visibility to know when and where cleanup is needed. You decide what to remove based on your organization's data retention policies. Automated file deletion would be risky in enterprise environments where incorrect cleanup could delete business-critical data. 

How does PRTG's disk space monitoring work?

PRTG polls disk space sensors at configurable intervals. The default is 60 seconds, with options ranging from 30 seconds to 24 hours. When free space drops below your configured threshold, PRTG triggers an alert after the next polling cycle completes, via email, SMS, or push notification.  

You don't need to watch dashboards continuously. The user-friendly interface displays historical data and trend graphs that update automatically, so you can review capacity changes over time. The combination of threshold alerting and historical visualization covers both immediate problem detection and long-term capacity planning. 

Does PRTG require agents or software installation on monitored servers?

No agents required for most monitoring methods. PRTG uses native protocols already built into operating systems: WMI for Windows (enabled by default in most environments), SSH for Linux/Unix/macOS (standard remote access), and SNMP for network storage (enabled on enterprise storage arrays).  

You provide credentials, and PRTG queries disk space remotely. The only exception is PRTG's optional remote probes, which extend monitoring to isolated network segments. But these monitor multiple systems from one probe installation, not per-server agents. This agentless approach reduces deployment complexity and eliminates the overhead of maintaining monitoring software on every server. The functionality works through protocols the operating system already provides. 

Paessler PRTG

Paessler PRTG

Network Monitoring Software – Version 26.1.116.1532 (February 9th, 2026)

Hosting icon

Hosting

Download for Windows and cloud-based version PRTG Hosted Monitor available

Languages icon

Languages

English, German, Spanish, French, Portuguese, Dutch, Russian, Japanese, and Simplified Chinese

test

Monitor everything

Network devices, bandwidth, servers, applications, virtual environments, remote systems, IoT, and more

test

Pricing

Choose the PRTG Network Monitor subscription that's best for you

Discover more monitoring insights and stories

Content illustration

Powerful stories from the monitoring world

  • Sensor of the Week: SSH Disk Free Sensor - Paessler Blog
  • Monitoring disk usage on Synology NAS with PRTG - Paessler Blog
  • Sensor of The Week: SSH VMware ESX(i) Disk Sensor - Paessler Blog
Support illustration

Resources to master your monitoring challenges

  • PRTG Manual: WMI Free Disk Space (Multi Disk) Sensor - Paessler
  • change disk space warning for all sensors
  • PRTG Manual: SNMP Disk Free Sensor - Paessler
Solution illustration

Solutions for all your monitoring needs

  • Free Disk Space Analyzer
  • Monitoring Hardware
  • Disk Space Monitoring
PRTG Logo

Start Monitoring with PRTG and see how it can make your network more reliable and your job easier.

Free download
PRODUCT OVERVIEW

Products

  • Paessler PRTG
    Paessler PRTGMonitor your whole IT infrastructure
    • PRTG Network Monitor
    • PRTG Enterprise Monitor
    • PRTG Hosted Monitor
    • PRTG UVexplorer
    • PRTG extensions
      Extensions for Paessler PRTGExtend your monitoring to a new level
  • Icon Features
    FeaturesExplore all monitoring features

Monitoring with PRTG

  • Network monitoring
  • Bandwidth monitoring
  • SNMP monitoring
  • Network mapping
  • Wi-Fi monitoring
  • Server monitoring
  • Network traffic analyzer
  • NetFlow monitoring
  • Syslog server

Useful Links

  • PRTG Manual
  • Knowledge Base
  • Customer Success Stories
  • About Paessler
  • Subscribe to newsletter
  • PRTG Support
  • PRTG Consulting
  • PRTG Feedback & Roadmap

Contact

Paessler GmbH
Thurn-und-Taxis-Str. 14, 
90411 Nuremberg 
Germany

[email protected]

+49 911 93775-0

  • Contact us
©2026 Paessler GmbHTerms & ConditionsPrivacy PolicyImprintReport VulnerabilityDownload & InstallSitemap
SNMP, MIBs and OIDs SNMP, MIBs and OIDs SNMP, MIBs and OIDs