


Custom alerts and data visualization let you quickly identify and prevent network issues.
How do I find all my IT assets? Sooner or later, every administrator must tackle this question. In general, there are three reasons for taking stock of your network with a network discovery tool:
Admins need to make regular inventories of their company’s IT equipment and infrastructure. Such a network inventory is not only great for getting an overview of the entire network, but also for security reasons: With a comprehensive inventory you can see, for example, if unwanted private devices are connected to your network
When a company grows, so does its network. Many administrators are faced with the task of gradually expanding their IT infrastructure. Here, network devices must be routed correctly to ensure that the network remains stable and efficient. A network discovery tool like Paessler PRTG can help check the network setup and find possible bottlenecks, for example.
It is increasingly important that all costs associated with network devices, maintenance, and licenses are documented, as accounting departments want to keep an eye on the cost of IT equipment and infrastructure as well. To do so, administrators must have an overview of existing hardware and software. Taking stock of the network with a network discovery tool can help here.

Diagnose network issues by continuously tracking the devices in your on-premises, cloud-based, or virtual network. Show hardware and operating system health, bandwidth usage, uptime, network traffic, and other key performance metrics in real time. Visualize network data in clear graphs and network topology maps to identify problems more easily. Gain the overview you need to troubleshoot all kinds of network isues.

Device tree view of the complete monitoring setup
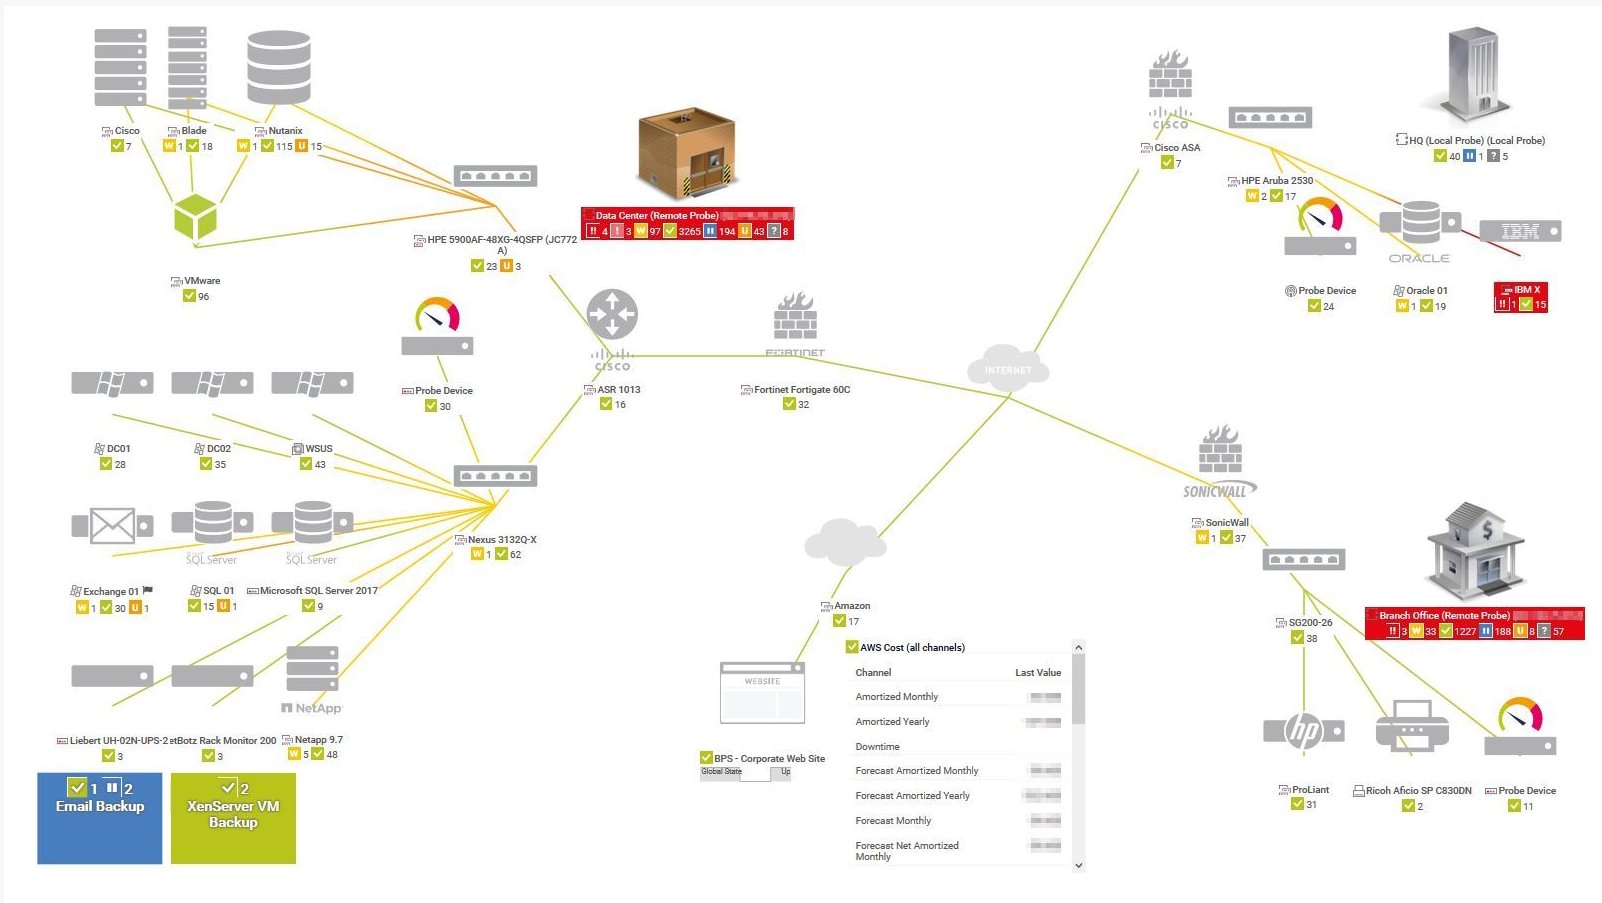
Custom network topology map
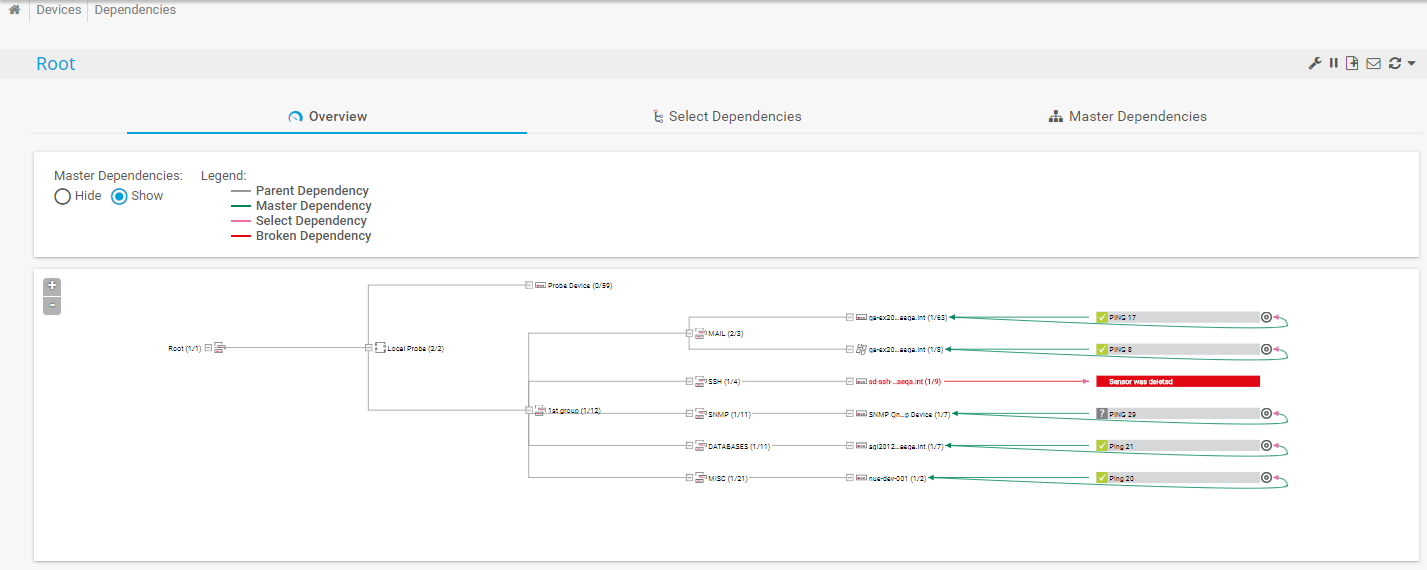
Dependencies graph in PRTG
“All-around winning
network monitor”
“The real beauty of PRTG is the endless possibilities it offers”
“PRTG Network Monitor
is very hard to beat”
Use the auto-discovery feature in PRTG to quickly and conveniently detect all your network devices, including rogue devices that might be connected to your LAN. PRTG automatically sets up devices in the network tree and then adds suitable monitoring sensors to them within minutes. Here’s how it works in 3 steps:
Enter the IP address range that PRTG should use to search for network devices and launch the automatic network discovery.
PRTG uses ping to find all the devices located within the specified IP address range and identifies the respective device types using protocols like SNMP, WMI, and more. It then uses device templates to automatically add the devices it found to the central dashboard that displays the network in the form of a hierarchical tree structure.
Depending on the device type, the manufacturer, and the protocols that the respective device supports, PRTG automatically adds suitable sensors for monitoring the device.
PRTG's auto-discovery finds the devices on your network and sets them up with suitable monitoring sensors. What it doesn't do on its own is show you how those devices are physically connected.
Paessler PRTG UVexplorer adds that layer: automated Layer 2 and Layer 3 network topology that maps the relationships between your devices right down to the port level — which switch port connects to which device — with no manual map building.
Because Paessler PRTG UVexplorer understands how your devices connect, it can visualize the dependencies between them. Click any device to see what's upstream and what's downstream. When an alert fires in PRTG, that dependency context shows you the blast radius — what else is affected — instead of leaving you to trace connections by hand.
Like PRTG's own discovery, Paessler PRTG UVexplorer runs on a schedule. Each scheduled discovery refreshes the topology and captures a point-in-time snapshot, so your network map stays current as the network changes — and you can compare snapshots to see what changed between runs. The topology and dependency data is surfaced inside PRTG, so you get the added context in the interface you already use.
Want to see what your network actually looks like, not just which devices are online? → Explore Paessler PRTG UVexplorer
Many sysadmins use the command line as it’s still the quickest way to check whether a target device is available, for example, via the ping command “ping IP ADDRESS”. You can repeat the ping command manually or use a loop to ping an entire range of devices.
The alternative – finding, installing, and getting the hang of a suitable network discovery tool – takes a whole lot longer. However, if you want to have a full network inventory, using the command line can never replace a user-friendly network discovery software.
In Windows, the network discovery is used to find and enable a specific network device, for example, a network printer. It’s up to the sysadmin to manually add individual devices to the network. Windows offers a variety of network profiles with individual enabling options for this process.
However, adding network devices is cumbersome, and there's no option to build a full network inventory this way. Here, a network scanner or network discovery tool makes more sense — and for an actual map of how your devices connect, a dedicated topology tool like Paessler PRTG UVexplorer
Many sysadmins search for simple network scanners or tools that are fully dedicated to network discovery tasks. In such cases, it’s not about setting up a network inventory for monitoring, for example, but discovering available devices as quickly and easily as possible.
Free network scanners like Angry IP Scanner are a good solution if you’re not interested in monitoring but would rather just perform a quick scan of your network – making use of an easy-to-understand user interface instead of reading command-line results.
Real-time notifications mean faster troubleshooting so that you can act before more serious issues occur.

Custom alerts and data visualization let you quickly identify and prevent network issues.
PRTG is set up in a matter of minutes and can be used on a wide variety of mobile devices.


“Excellent tool for detailed monitoring. Alarms and notifications work greatly. Equipment addition is straight forward and server initial setup is very easy. ...feel safe to purchase it if you intend to monitor a large networking landscape.”
Partnering with innovative IT vendors, Paessler unleashes synergies to create
new and additional benefits for joined customers.
Axis offers one of the most complete and reliable product portfolios, an expanded professional network, and comprehensive integration support for video management software.
A combination of Orchestra and PRTG provides the ideal solution to monitor the traditional IT Infrastructure as well as the central communication server in hospitals and industrial environments.
Siemon and Paessler bring together intelligent building technology and advanced monitoring and make your vision of intelligent buildings and data centers become reality.
Real-time notifications mean faster troubleshooting so that you can act before more serious issues occur.
Network Monitoring Software – Version 26.1.116.1532 (February 9th, 2026)
Download for Windows and cloud-based version PRTG Hosted Monitor available
English, German, Spanish, French, Portuguese, Dutch, Russian, Japanese, and Simplified Chinese
Network devices, bandwidth, servers, applications, virtual environments, remote systems, IoT, and more
Choose the PRTG Network Monitor subscription that's best for you


Automatic network discovery refers to the process of identifying and mapping devices, resources, and services within a computer network without requiring manual intervention. It involves using specialized tools or protocols to scan and analyze the network infrastructure to identify active devices, their IP addresses, and available services. Mapping how those devices are physically connected to one another — the network topology — is a related but separate capability, provided by dedicated topology tools such as Paessler PRTG UVexplorer.
The goal of automatic network discovery is to provide network administrators with an accurate and up-to-date view of the network environment. By automatically discovering network devices, administrators can effectively manage and maintain the network, troubleshoot issues, ensure security, and optimize performance.
A network discovery tool is a software designed to assist in the process of automatic network discovery. It helps network administrators identify and map devices, resources, and services within a computer network. These tools use various techniques to scan, analyze, and gather information about the network infrastructure.
Available tools on the market vary in complexity, functionality, and deployment options, ranging from simple command-line utilities to comprehensive network management systems. The choice of a network discovery tool depends on the specific requirements, size, and complexity of the network being managed.
In PRTG, “sensors” are the basic monitoring elements. One sensor usually monitors one measured value in your network, for example the traffic of a switch port, the CPU load of a server, or the free space on a disk drive. On average, you need about 5-10 sensors per device or one sensor per switch port.
Paessler conducted trials in over 600 IT departments worldwide to tune its network monitoring software closer to the needs of sysadmins. The result of the survey: over 95% of the participants would recommend PRTG – or already have.

Paessler PRTG is used by companies of all sizes. Sysadmins love PRTG because it makes their job a whole lot easier.
Bandwidth, servers, virtual environments, websites, VoIP services – PRTG keeps an eye on your entire network.
Everyone has different monitoring needs. That’s why we let you try PRTG for free.