• Company
    • About Us
    • Case Studies
    • Press Center
    • Careers
    • Blog
    • Contact us
  • Contact us
  • Login
 
  • English
    • Deutsch
    • Español
    • Français
    • Italiano
    • Português
Paessler
                    - The Monitoring Experts
  • Products
    • Paessler PRTG
      Paessler PRTGMonitor your whole IT infrastructure
      • PRTG Network Monitor
      • PRTG Enterprise Monitor
      • PRTG Hosted Monitor
      • PRTG UVexplorer
      • PRTG extensionsExtensions for Paessler PRTGExtend your monitoring to a new level
    • Icon Features
      FeaturesExplore all monitoring features
      • Maps & dashboards
      • Alerts & notifications
      • Multiple user interfaces
      • Distributed monitoring
      • Customizable reporting
  • Solutions
    • Industries
      IndustriesMonitor various industry sectors
      • Industrial
      • Healthcare
      • Data Center
      • Education
      • Finance
      • Government
    • IT Topics
      IT TopicsMonitor all areas of IT
      • Network Monitoring
      • Bandwidth Monitoring
      • SNMP Monitor
      • Network Mapping
      • WiFi Monitoring
      • Server Monitoring
  • Pricing
  • Resources
    • Getting Started
      Getting StartedModules for self-paced learning
    • How-to Guides
      How-to GuidesGet the most out of PRTG
    • Videos & Webinars
      Videos & WebinarsLearn from Paessler experts
    • IT  Knowledge
      IT KnowledgeExpand your IT knowledge
    • PRTG Manual
      PRTG ManualFull documentation
    • Knowledge Base
      Knowledge BaseShare community knowledge
    • PRTG Sensor Hub
      PRTG Sensor HubGet sensors, scripts & templates
    • Trainings
      PRTG TrainingLearn how to work with PRTG
  • Partners
    • Icon Handshake
      Become a PartnerFor resellers and channel partners
    • Icon MSP
      Become an MSPDeliver monitoring as a managed service
    • icon partner
      Partner PortalLog in to your partner account
    • Deal Registration
      Deal RegistrationRegister your sales opportunities
    • icon search
      Find a PartnerFind partners selling Paessler products
    • icon technology
      Technology AlliancesSee Paessler technology partnerships
    • Partner HubTools for Your Success
  • Company
    • About Us
    • Case Studies
    • Press Center
    • Careers
    • Blog
    • Contact us
  • Contact us
  • Login
  • English
    • Deutsch
    • Español
    • Français
    • Italiano
    • Português
  • Get a quote
  • Free trial

Network-Based Computer Inventory Management Software

Discover what's connected, monitor device health, and keep continuous visibility across your network infrastructure 

Free download
PRODUCT OVERVIEW

How Does A Computer Inventory Management Software Keep Your Device List Up-To-Date? 

Keeping an accurate picture of what's connected to your network is harder than it sounds. Devices join and leave, configurations change, and manually maintained spreadsheets fall behind almost immediately. The teams that manage this well tend to rely on automated discovery and continuous monitoring rather than periodic manual audits.

Paessler PRTG gives you that visibility layer: automated asset discovery, interval-based health tracking, and change detection that keeps your inventory current without manual effort. Worth being clear about scope though. PRTG monitors Windows servers and workstations, Linux systems, network devices, printers, IoT endpoints, and virtualized infrastructure including VMware and Hyper-V. It is not a full IT asset management system. Procurement, software license management, and asset lifecycle tracking sit outside what it does. For teams that need the monitoring foundation under their inventory management, that distinction matters.

Download PRTG Trial

What you will find on this page

  • Accurate Network Inventory
  • Track Your Network Devices
  • PRTG vs. Manual Inventory Tracking
  • FAQs

PRTG is compatible with all major vendors, products, and systems

compatible with all major vendors, products, and systems

Keep Your Network Inventory Accurate and Current

See Every Device Connected to Your Network 

You can't manage what you can't see. Many IT teams struggle with outdated spreadsheets or manual tracking methods that become obsolete the moment a new laptop joins the network or a printer goes offline. PRTG's automated asset discovery regularly scans your network infrastructure, giving you current inventory data without manual data entry. You get an accurate, up-to-date view of every endpoint, server, and device. That's the foundation for informed decisions about your IT equipment.

  • Automated discovery finds all network-connected devices without manual tracking  
  • Dashboard shows what's online, offline, or flagged based on the latest discovery cycle  
  • Alerts when auto-discovery finds something new or something drops off the map  
  • Web-based access means you can check inventory data from anywhere, no software installation on every laptop required (when exposed via VPN or remote access policies are configured)
  • Tags to categorize and organize devices by whatever grouping makes sense for your team

Know Which Devices Are Healthy and Which Need Attention 

Knowing a device exists isn't enough. You need to know if it's actually working. PRTG continuously monitors the health and availability of every device in your network, from servers and laptops to printers and mobile devices. Instead of waiting for users to report problems, you get proactive alerts when equipment shows warning signs. This monitoring foundation helps streamline your IT operations and prevent downtime before it impacts your small business or enterprise teams.

  • Continuous health monitoring tracks uptime, response time, and performance for all IT equipment
  • Automated notifications via email, SMS, or push to your mobile app when issues arise
  • Historical inventory reports for audits and trend analysis over time
  • Threshold-based alerts with custom warning levels per device type
  • On-premises deployment (cloud-hosted version available)
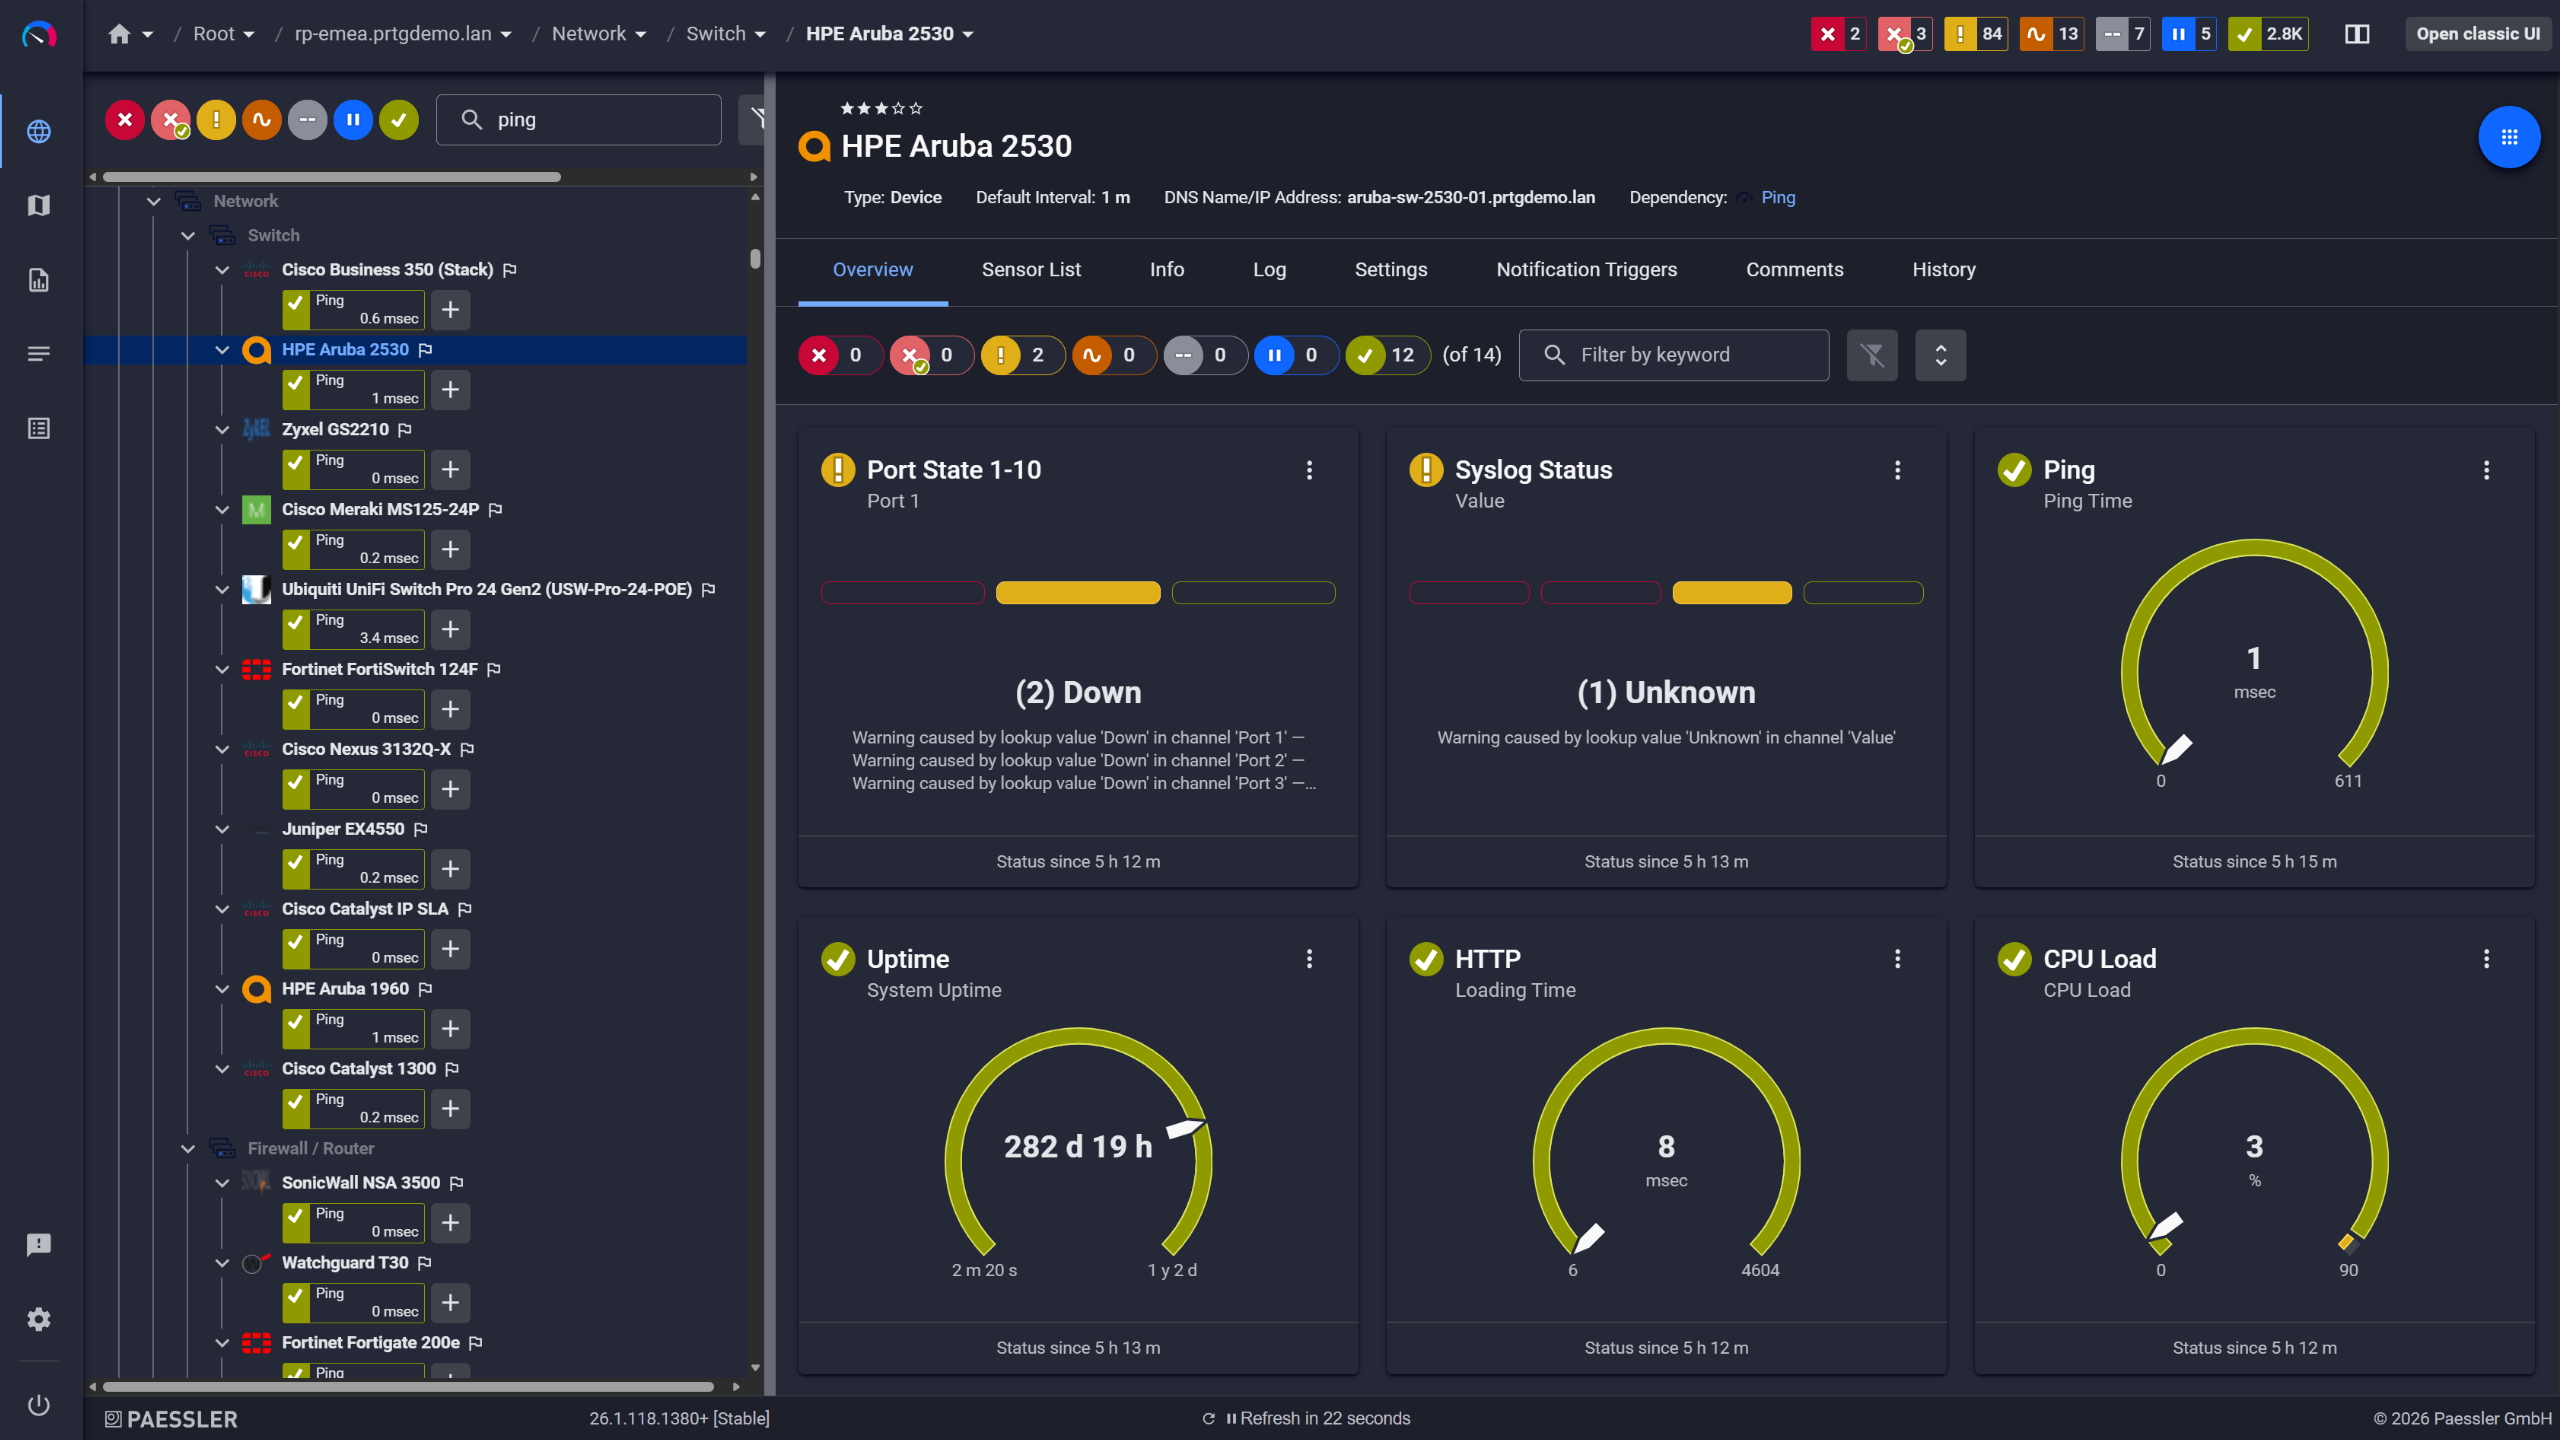
PRTG web interface showing device tree and full device list with sensor status badges

Full device list, instant overview

PRTG device overview for an HPE Aruba 2530 switch with port state, ping, and CPU sensors

Network switches monitored across vendors
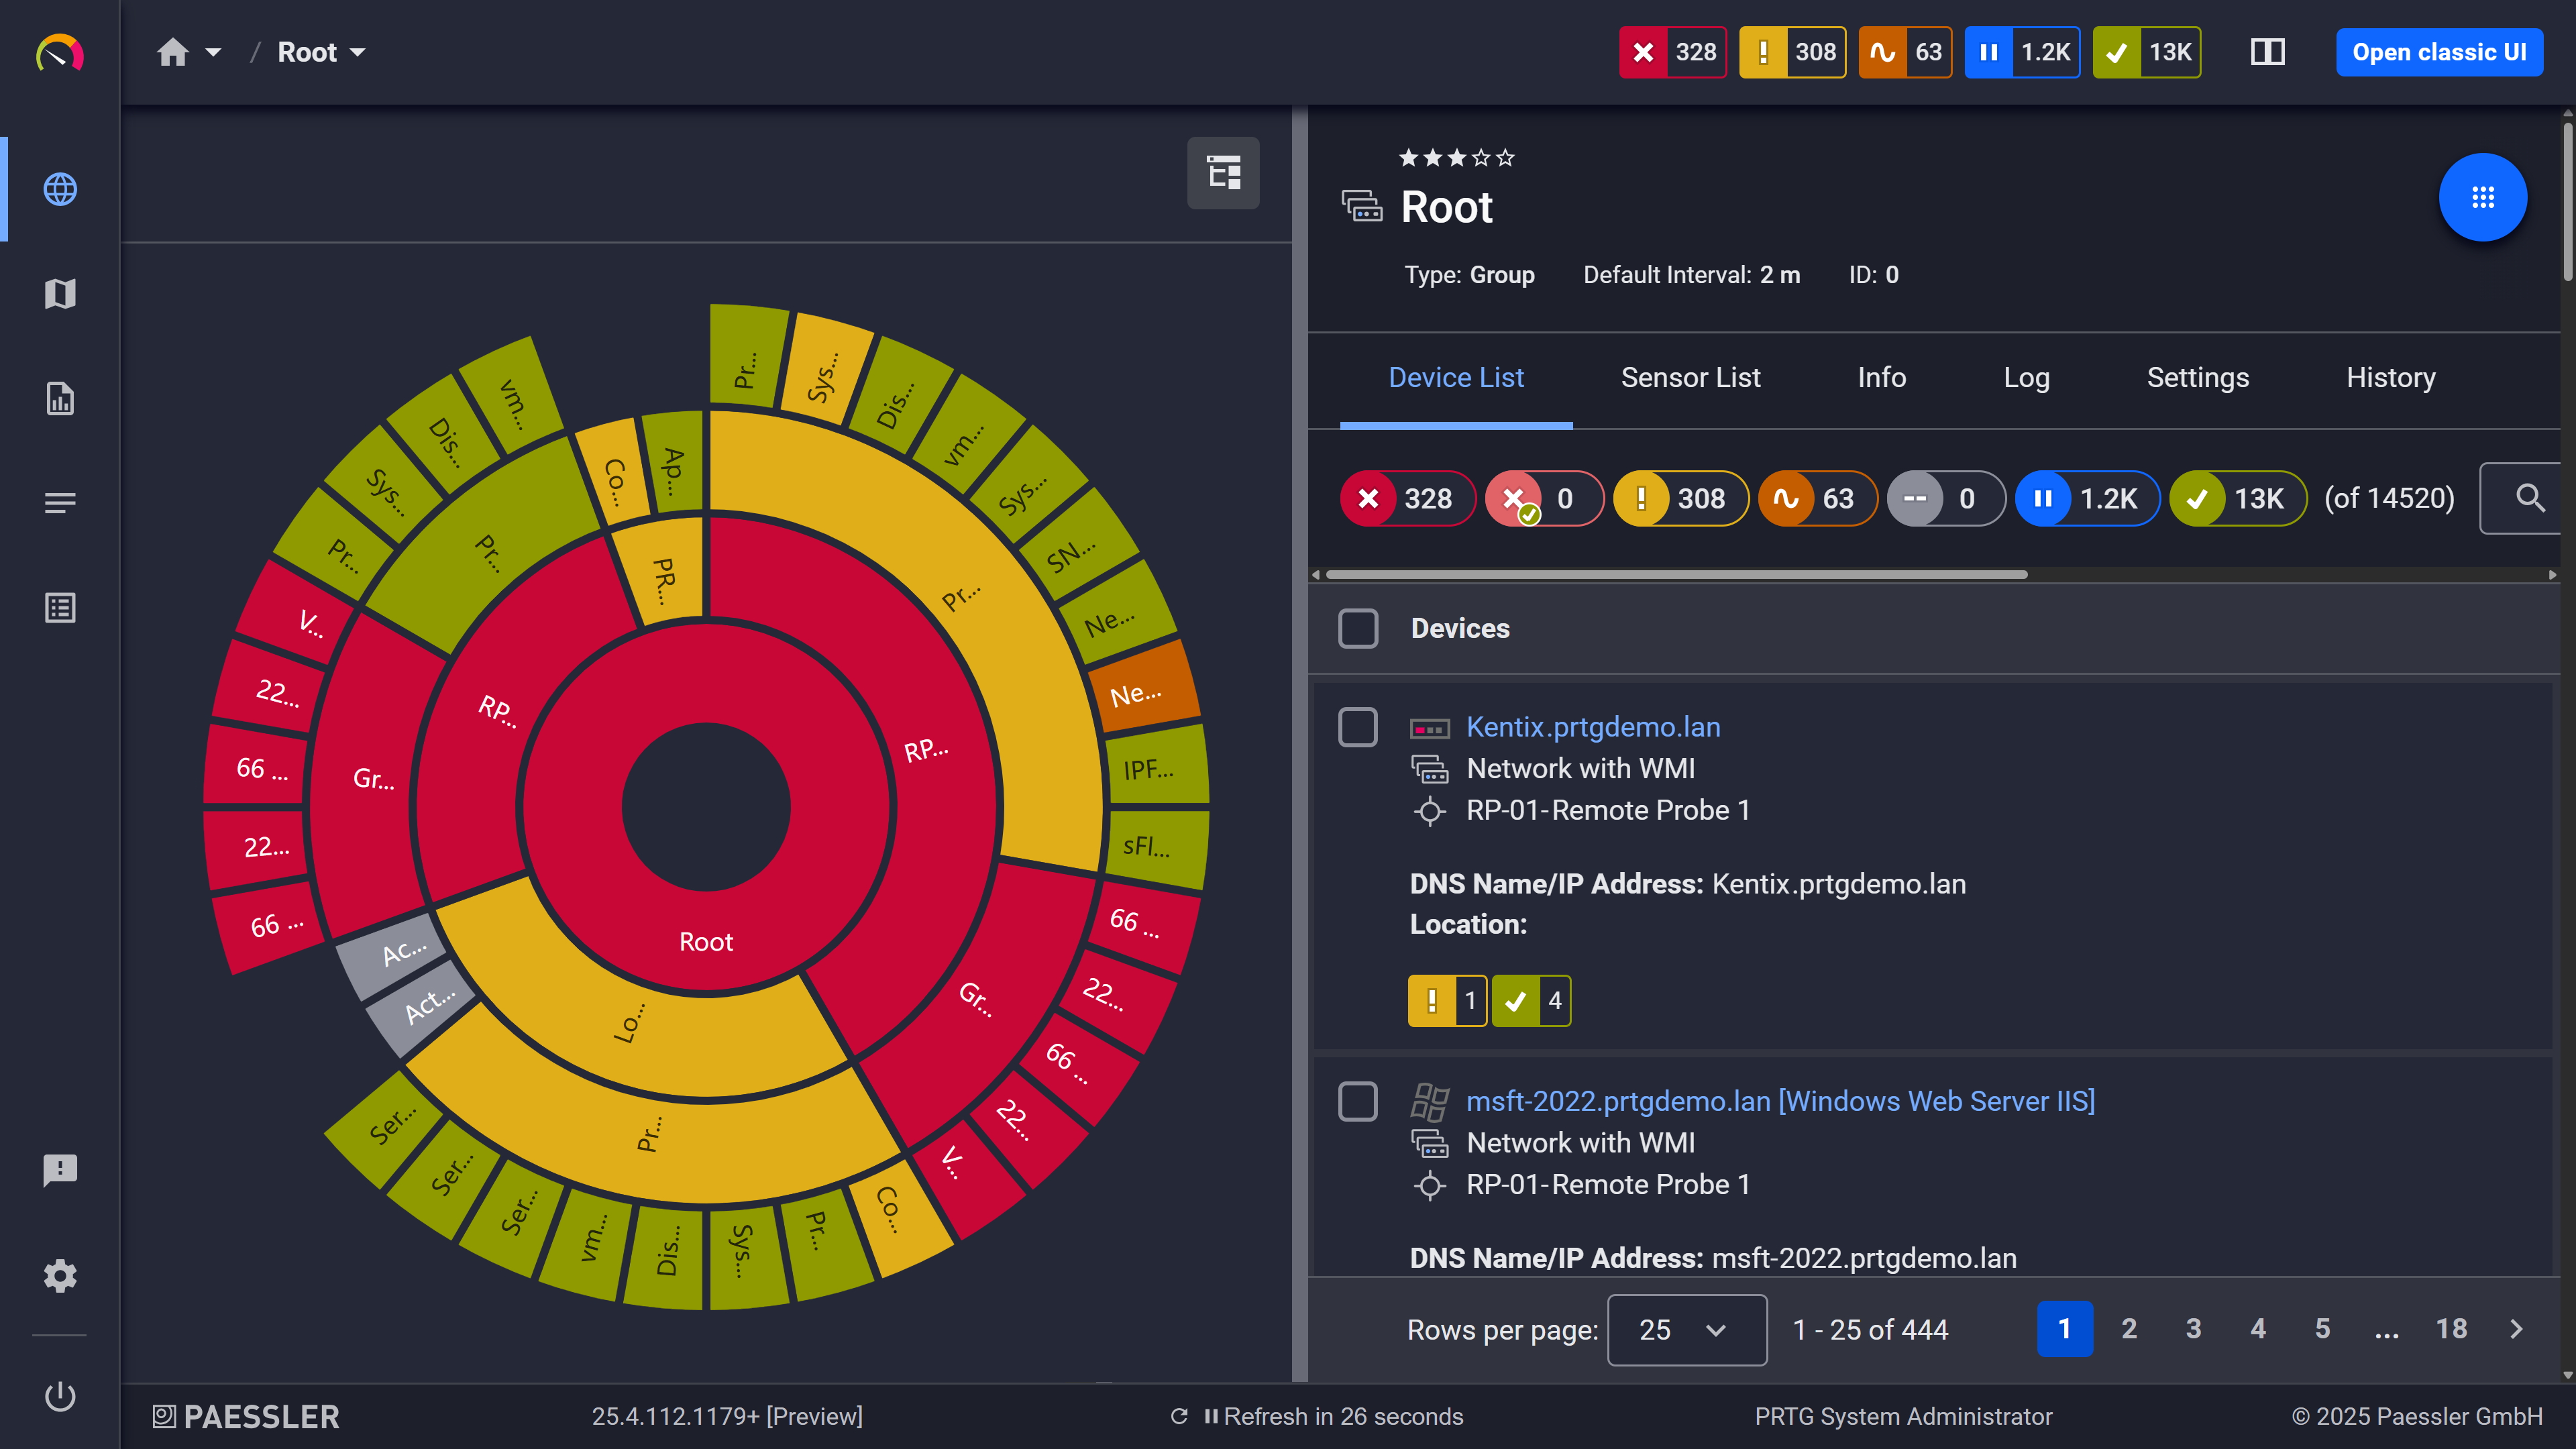
PRTG sunburst chart visualizing the full network hierarchy with color-coded sensor status

Your entire network, visualized instantly

Detect Network Changes Before They Become Problems 

Something just changed in your network, but what? Unauthorized devices or unexpected topology changes can create security risks and operational headaches. PRTG's auto-discovery and monitoring alerts notify IT teams when new devices join the network or when monitored infrastructure changes. You get the visibility needed to maintain control over your ecosystem without constantly running manual audits or relying on outdated inventory management tools.

  • Continuous health monitoring tracks uptime, response time, and performance for all IT equipment
  • Automated notifications via email, SMS, or push to your mobile app when issues arise
  • Historical inventory reports for audits and trend analysis over time
  • Threshold-based alerts with custom warning levels per device type
  • On-premises deployment (cloud-hosted version available)

See Why IT Professionals Trust PRTG

Start monitoring your infrastructure in minutes. No professional services, no complex configuration, no risk.

Free download
PRODUCT OVERVIEW

Identify Which Devices Are Consuming Your Bandwidth 

Network congestion often comes from devices you didn't expect. PRTG's traffic analysis shows you exactly which laptops, servers, or endpoints are consuming bandwidth through Top Talkers, Top Connections, and Top Protocols reporting. This inventory tracking goes beyond just knowing a device exists. It helps you understand device behavior, optimize network performance, and identify equipment that may need attention. You get actionable inventory data that helps IT teams make better infrastructure decisions.
  • Top Talkers analysis identifies which devices generate the most network traffic
  • Protocol-level visibility into what applications and services devices are running
  • Traffic trend reports for usage pattern analysis over time
  • Custom dashboards focused on the inventory metrics that matter to your team
  • Export to CSV for further analysis or integration with other inventory tools
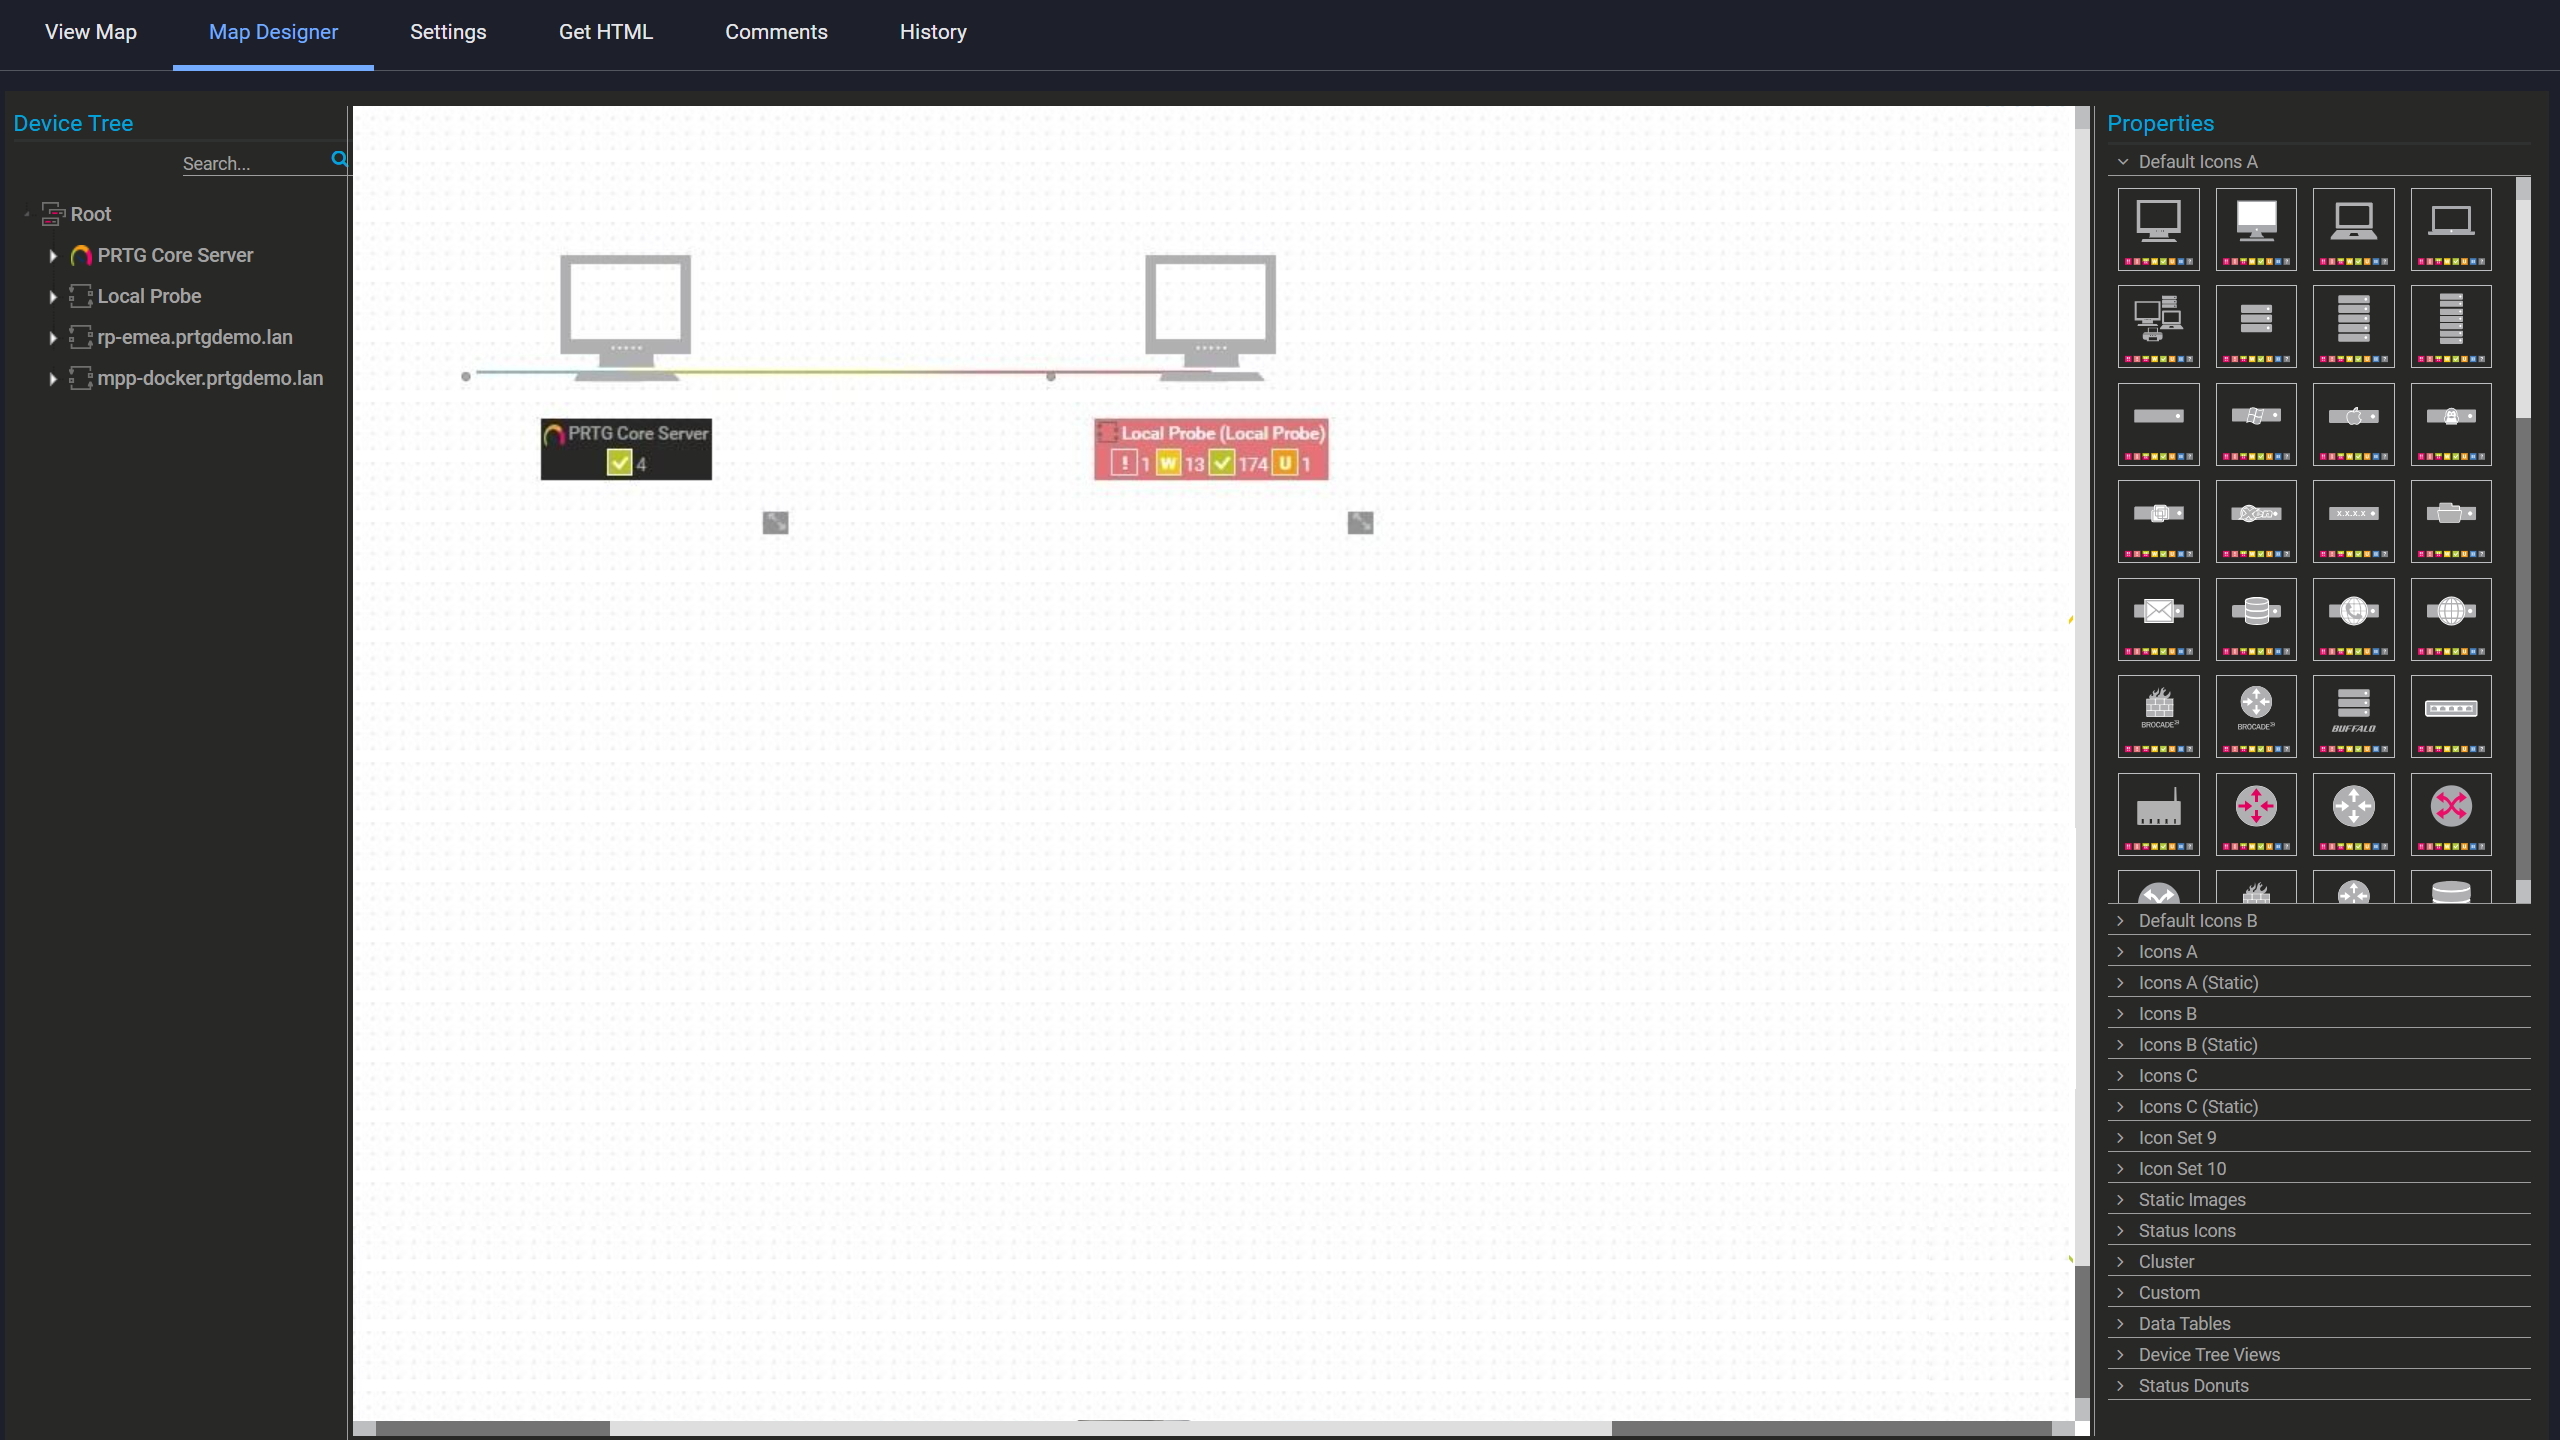
PRTG Map Designer with two network devices placed on a blank canvas

Build your own network map

PRTG reports list showing scheduled monitoring reports with run times and sensor counts

Scheduled reports, always on time

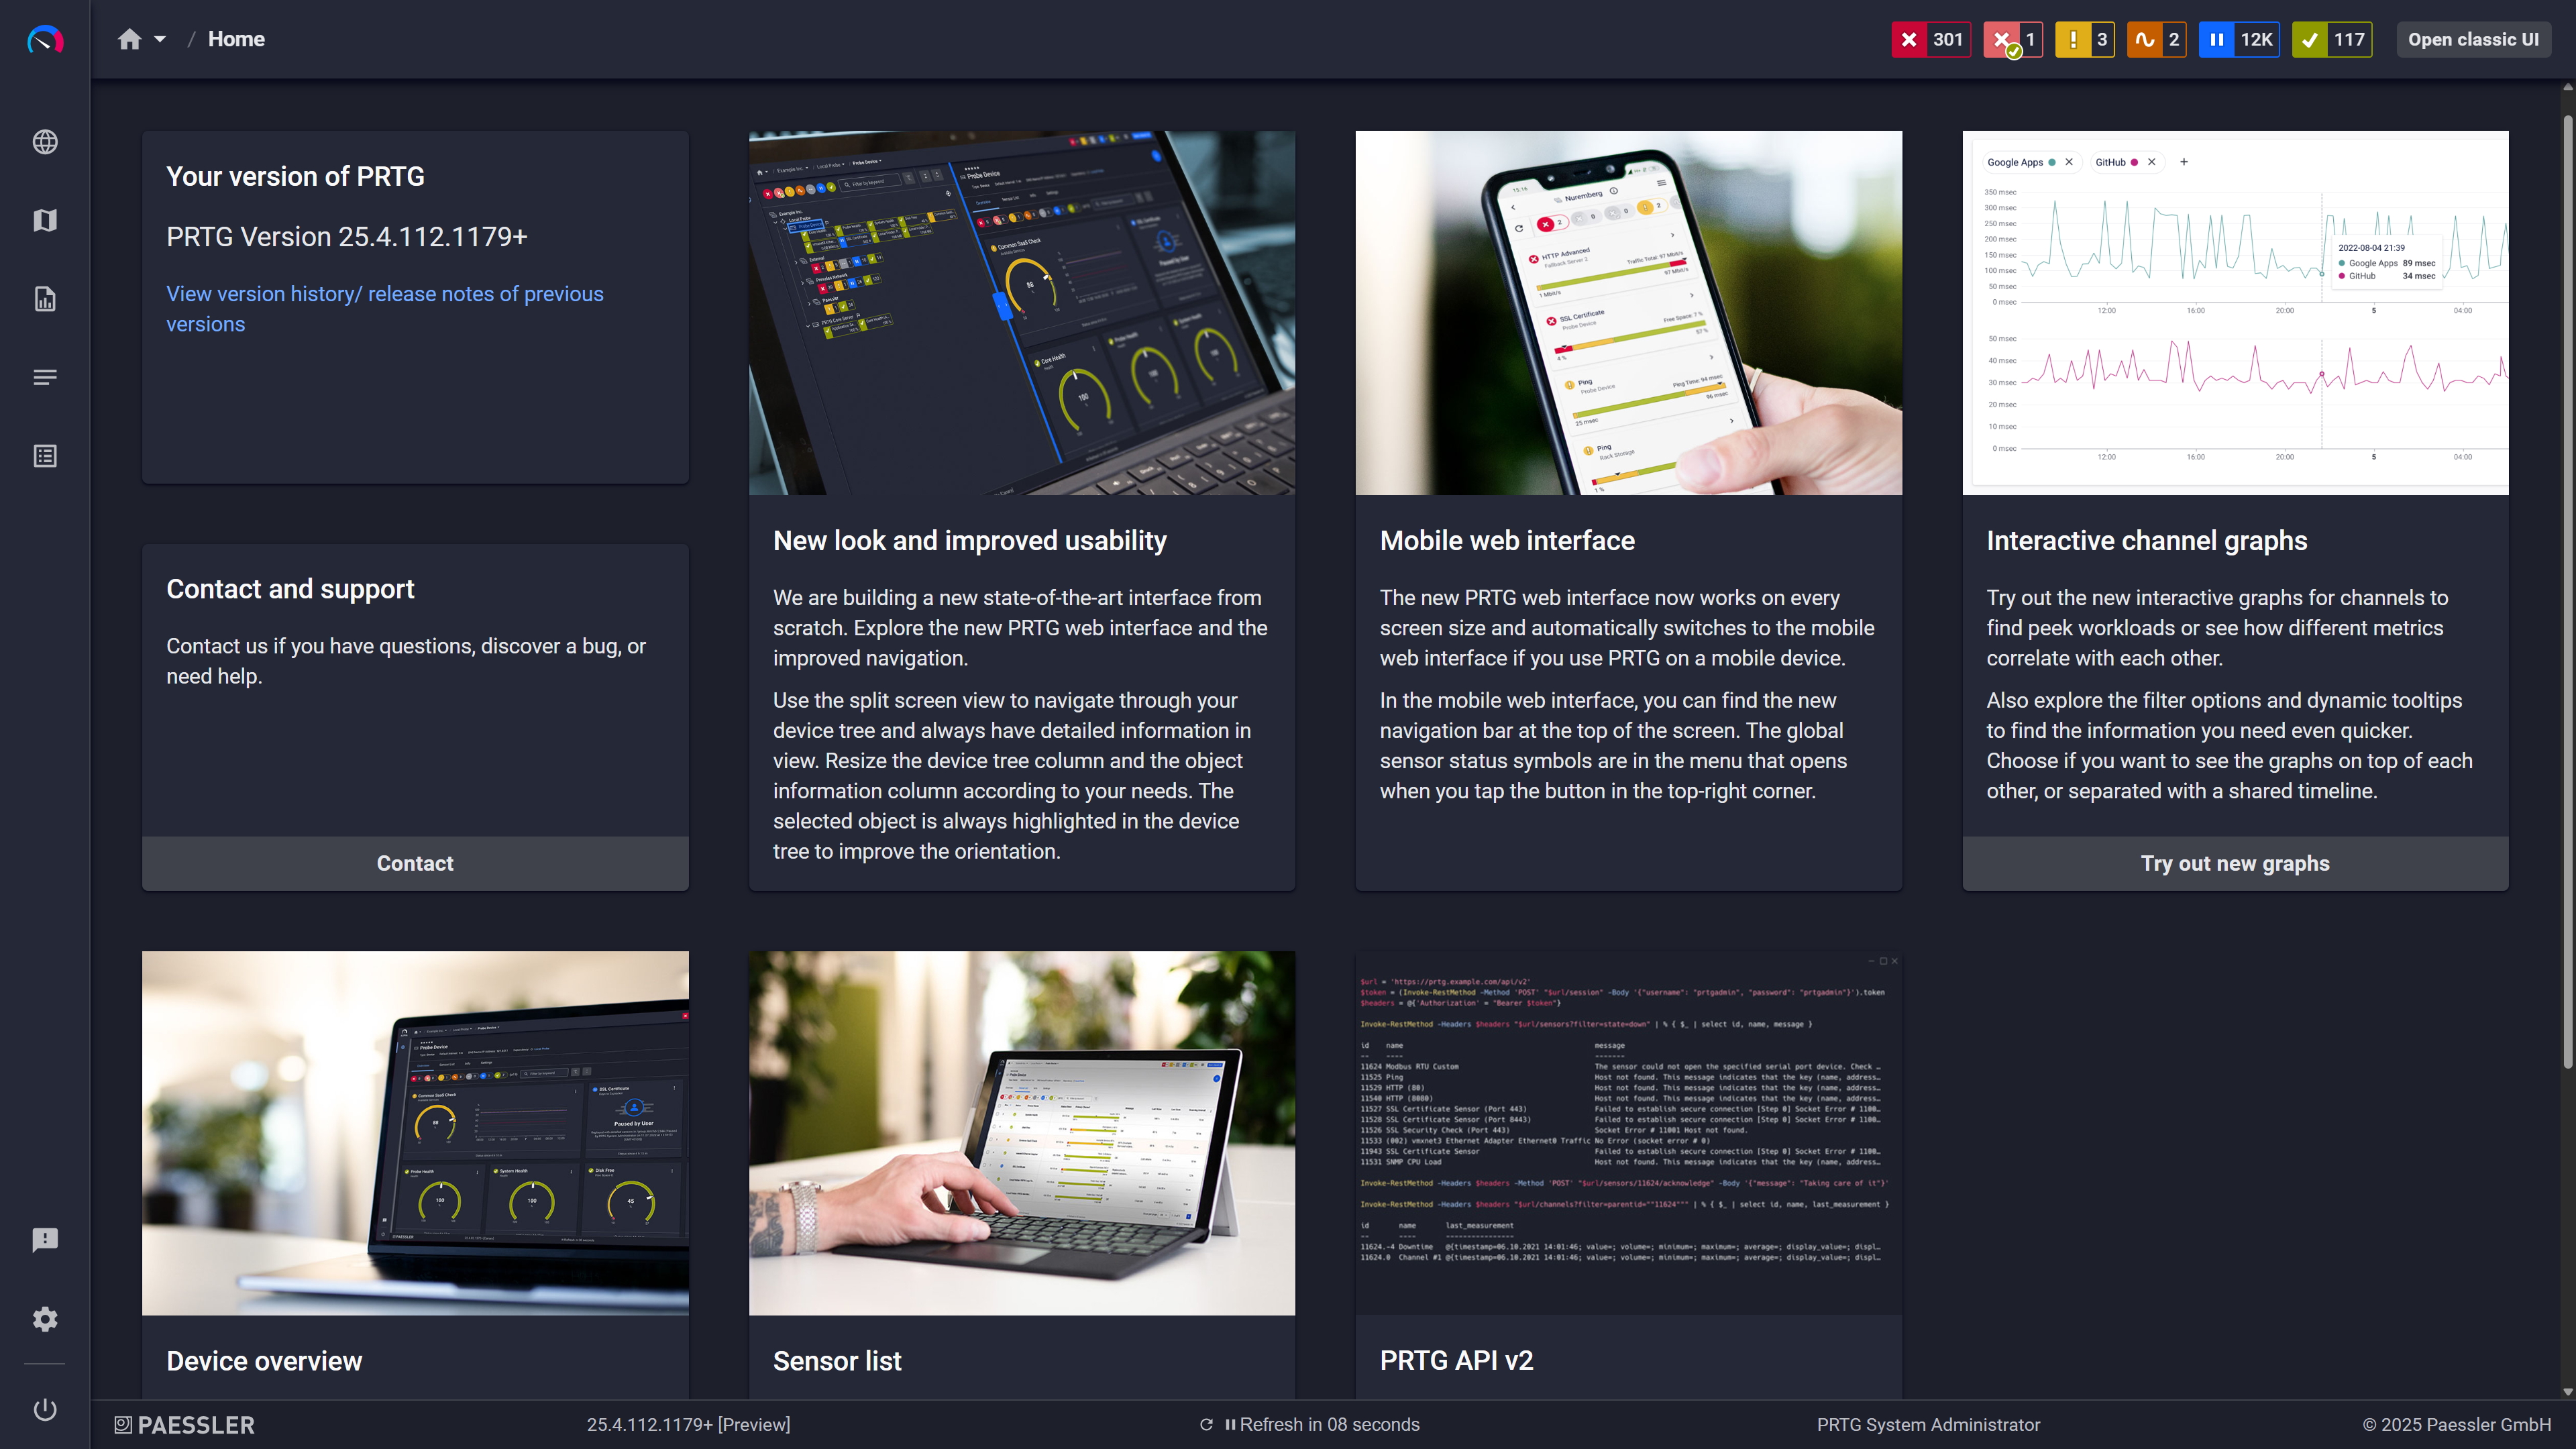
PRTG home screen showing feature highlight cards including mobile interface and API

Modern interface, everything within reach

Maintain Security with Unknown Device Detection  

Every unidentified device on your network is a potential security risk. PRTG's asset discovery regularly monitors for new or unauthorized endpoints joining your infrastructure. When a device appears that wasn't there before, whether it's an unexpected laptop, a new access point, or an unmanaged mobile device, you get alerts. This monitoring foundation gives you the visibility layer that complements your broader IT service management strategy without requiring dedicated barcode scanning or manual inventory audits.

  • Automatic detection of new devices when auto-discovery runs
  • Alerts via email, SMS, or mobile app push notification
  • Device icons and tags to distinguish laptops, printers, servers, and other IT equipment
  • Integration via API with existing security and IT asset management workflows
  • Support for Microsoft, Linux, and mixed-platform environments without additional module

How PRTG Discovers, Monitors, and Tracks Your Network Devices  

PRTG gives you the monitoring foundation that keeps your computer inventory accurate and current. Automated asset discovery, continuous health tracking, and network change detection work together to answer the questions IT teams actually need answered: what's connected, what's running, and what changed. The sections below cover how each of those capabilities works in practice.

Automated Network Discovery 

PRTG's auto-discovery uses SNMP, WMI, ping, and other protocols to find and classify every connected device on your network without manual data entry. Servers, laptops, printers, IoT endpoints: all identified automatically and added to your inventory. You configure the schedule yourself, hourly, daily, weekly, or on demand, so discovery frequency matches how dynamic your environment actually is. The result is inventory data that reflects the current state of your network rather than whatever was last documented manually.

Continuous Device Monitoring 

Once PRTG discovers a device it doesn't just record it and move on. Availability, performance, and health are monitored continuously from that point. IT teams get notified when equipment goes offline or shows warning signs rather than finding out when a user opens a help desk ticket. That shift from reactive to proactive is where the operational value sits, and it applies equally to small business environments and larger distributed setups.

SNMP-Based Inventory Collection 

Simple ping monitoring tells you whether a device responds. SNMP goes further. PRTG collects hardware specifications, software versions, network interface details, manufacturer information, model numbers, serial numbers, and system status from IT equipment automatically when available via SNMP protocol. That inventory data comes in without manual tracking, which matters when you're managing more than a handful of devices and accuracy starts to depend on process discipline rather than tooling.

Custom Sensors and API

For monitoring needs that fall outside the standard sensor library, PRTG supports custom sensors configured to track specific metrics. Also the API lets you pull inventory data into external systems: your CMDB, a help desk platform, custom reporting tools, whatever sits at the center of your IT inventory management ecosystem. The flexibility here is genuine rather than theoretical, but it does require some setup effort on your side depending on what you're integrating with.

Multi-Platform Support Headline (H4)

PRTG monitors Microsoft Windows, Linux, VMware, Hyper-V, and other platforms from a single web-based dashboard. Mixed-vendor environments, cloud-based resources, cloud services, on-premises infrastructure: all visible in one place without separate inventory tracking tools per platform. For teams managing heterogeneous environments that's a meaningful reduction in operational overhead, even if PRTG still only covers the monitoring side of the picture.

free downLoad

PRTG vs. Manual Inventory Tracking

Capability

Without PRTG

Without PRTG

With PRTG

With PRTG

Device Discovery

Without PRTG
not included

Requires manual data entry and physical access to equipment; often outdated within days

With PRTG
included

Automated asset discovery finds devices on a schedule; current inventory data

Real-Time Status

Without PRTG
not included

No visibility into whether devices are online or offline until someone checks manually

With PRTG
included

Continuous monitoring shows device health, availability, and performance at a glance

Change Detection

Without PRTG
not included

Depends on scheduled audits or manual checks; unauthorized devices may go unnoticed for weeks

With PRTG
included

Alerts when auto-discovery detects new devices or topology changes

Effort Required

Without PRTG
not included

Hours of manual work for initial inventory plus ongoing updates; scales poorly

With PRTG
included

Minutes to configure auto-discovery; automated monitoring with no manual effort

Historical Data

Without PRTG
not included

Requires manual record-keeping in spreadsheets; prone to errors and gaps

With PRTG
included

Automated inventory reports with historical trends, exportable to CSV

free downLoad

“From a server perspective, we're monitoring all of the key components of our service such as CPU usage, RAM disk space, the Windows services that it's running, and network connectivity of that server. In terms of networks, we’re monitoring all of our switches, firewalls, and access points. It’s really useful to be able to easily pull performance metrics from the PRTG dashboard.”

Ollie Kerslake, Infrastructure Lead
Riverford Organic Farmers

“The tool has given us greater control over all types of devices connected to the network (switches, IP telephony, security cameras, IoT, WiFi) that previously remained opaque when dealing with service incidents. This has improved our ability to diagnose and resolve problems, which has translated into greater efficiency and a better user experience in both internal and public services.”

Jordi Tolosà Bel, New Technologies Technician
Vinaroz City Council

“Our objective was to be able to monitor the health of our most critical servers containing data and applications, but also the flows and bandwidth between headquarters, our 50 servers in the cloud and the 15 servers at our production sites. For us, it is essential to have a proactive approach to understand where the weaknesses of the IT system are to be able to improve them.”

Marc Boullier, CIO
Carambar & Co

Paessler PRTG Network Monitor licenses & pricing

Choose the PRTG Network Monitor subscription that's best for you.

License NameLicense descriptionPriceLicense DetailsGet startedPricing Details
PRTG 500$200per month paid annuallyBuy nowBuy now

Enough to monitor multiple aspects of 50 devices

PRTG 1000$358per month paid annuallyBuy nowBuy now

Enough to monitor multiple aspects of 100 devices

PRTG 2500$742per month paid annuallyBuy nowBuy now

Enough to monitor multiple aspects of 250 devices

PRTG 5000$1,300per month paid annuallyBuy nowBuy now

Enough to monitor multiple aspects of 500 devices

PRTG 10000$1,642per month paid annuallyBuy nowBuy now

Enough to monitor multiple aspects of 1000 devices

Over 100,000 Customers Worldwide Love Paessler  

customer success stories

 Computer Inventory Management: Frequently Asked Questions

Is PRTG a full IT asset management (ITAM) system?

No, and that's worth understanding before evaluating it. PRTG is a network monitoring tool. It discovers devices, monitors their health, and tracks network-connected equipment on a schedule. Procurement workflows, purchase orders, software license management, asset lifecycle management: none of that is in here. Organizations that need both typically run PRTG alongside a dedicated ITAM solution. PRTG handles the monitoring layer, tools like ManageEngine AssetExplorer, Lansweeper, or Snipe-IT handle asset tracking, license management, and procurement. That split actually works reasonably well in practice.

Can PRTG track software licenses and software assets?

No. Hardware devices and their health is what PRTG monitors. Software asset management, license counts, compliance tracking — that's out of scope. For software license management you need tools built specifically for SAM, and there's no workaround for this in PRTG.

Does PRTG work for small business environments?

Scalability is one of the practical strengths here. Small business networks and large enterprise deployments are both supported, and you don't have to configure everything upfront. Start with the essential IT equipment: servers, laptops, network devices. Expand as the infrastructure grows. The web-based dashboard and automated discovery mean a small IT team can maintain visibility without dedicating anyone to manual inventory tracking.

What's PRTG's pricing model?

Sensor-based subscriptions. Each monitored metric counts as one sensor. A device's ping status is a sensor. Bandwidth usage is a sensor. System health is a sensor. Pricing scales with how many sensors you need, so smaller environments pay less. There's a free trial with up to 100 sensors if you want to test before committing.

Can PRTG replace barcode scanning for inventory audits?

For network-connected equipment it covers a lot of ground. Servers, laptops, routers, printers: discovered and monitored automatically. But physical audits using barcode scanners are still necessary when you need to verify physical location, check condition, or account for assets that aren't network-connected. PRTG reduces how often those audits need to happen. It doesn't eliminate them.

Does PRTG have a mobile app?

Yes. iOS and Android both covered. From the mobile app you can check device status, view your dashboard, and receive push notifications when something needs attention. Useful when you're not at a desk and an alert comes in.

Can PRTG integrate with our existing help desk or service desk system?

Yes, via API, email, syslog, webhooks, and other notification methods. PRTG doesn't replace your help desk or service desk platform, but it feeds device status data into them so tickets can be triggered by actual monitoring events rather than user reports. Setup depends on what system you're integrating with, but the connection points are there.

Paessler PRTG

Paessler PRTG

Network Monitoring Software – Version 26.1.116.1532 (February 9th, 2026)

Hosting icon

Hosting

Download for Windows and cloud-based version PRTG Hosted Monitor available

Languages icon

Languages

English, German, Spanish, French, Portuguese, Dutch, Russian, Japanese, and Simplified Chinese

test

Monitor everything

Network devices, bandwidth, servers, applications, virtual environments, remote systems, IoT, and more

test

Pricing

Choose the PRTG Network Monitor subscription that's best for you

Discover more monitoring insights and stories

Content illustration

Powerful stories from the monitoring world

  • How to enable SNMP on your operating system
  • Easy ways to quickly test your bandwidth
  • Video: Quick overview of PRTG
Support illustration

Resources to master your monitoring challenges

  • Using PRTG for automated inventory tracking - Paessler Helpdesk
  • PRTG Manual: System Information - Paessler
  • How can PRTG get data for System Information tables?
Solution illustration

Solutions for all your monitoring needs

  • Computer Inventory Management Software - PRTG - Paessler
  • Inventory Management Monitoring
  • Monitoring Hardware
PRTG Logo

Start Monitoring with PRTG and see how it can make your network more reliable and your job easier.

Free download
PRODUCT OVERVIEW

Products

  • Paessler PRTG
    Paessler PRTGMonitor your whole IT infrastructure
    • PRTG Network Monitor
    • PRTG Enterprise Monitor
    • PRTG Hosted Monitor
    • PRTG UVexplorer
    • PRTG extensions
      Extensions for Paessler PRTGExtend your monitoring to a new level
  • Icon Features
    FeaturesExplore all monitoring features

Monitoring with PRTG

  • Network monitoring
  • Bandwidth monitoring
  • SNMP monitoring
  • Network mapping
  • Wi-Fi monitoring
  • Server monitoring
  • Network traffic analyzer
  • NetFlow monitoring
  • Syslog server

Useful Links

  • PRTG Manual
  • Knowledge Base
  • Customer Success Stories
  • About Paessler
  • Subscribe to newsletter
  • PRTG Support
  • PRTG Consulting
  • PRTG Feedback & Roadmap

Contact

Paessler GmbH
Thurn-und-Taxis-Str. 14, 
90411 Nuremberg 
Germany

[email protected]

+49 911 93775-0

  • Contact us
©2026 Paessler GmbHTerms & ConditionsPrivacy PolicyImprintReport VulnerabilityDownload & InstallSitemap
How to run an auto-discovery in PRTG in 5 steps How to run an auto-discovery in PRTG in 5 steps How to run an auto-discovery in PRTG in 5 steps