Custom alerts and data visualization let you quickly identify and prevent hardware malfunctions, outages, and all kinds of performance issues.
Your servers are the lifeblood of your business. From hosting websites to running critical applications, you can't afford downtime. With Paessler PRTG's server health monitoring software, you can rest easy knowing your servers are healthy and ready for action.
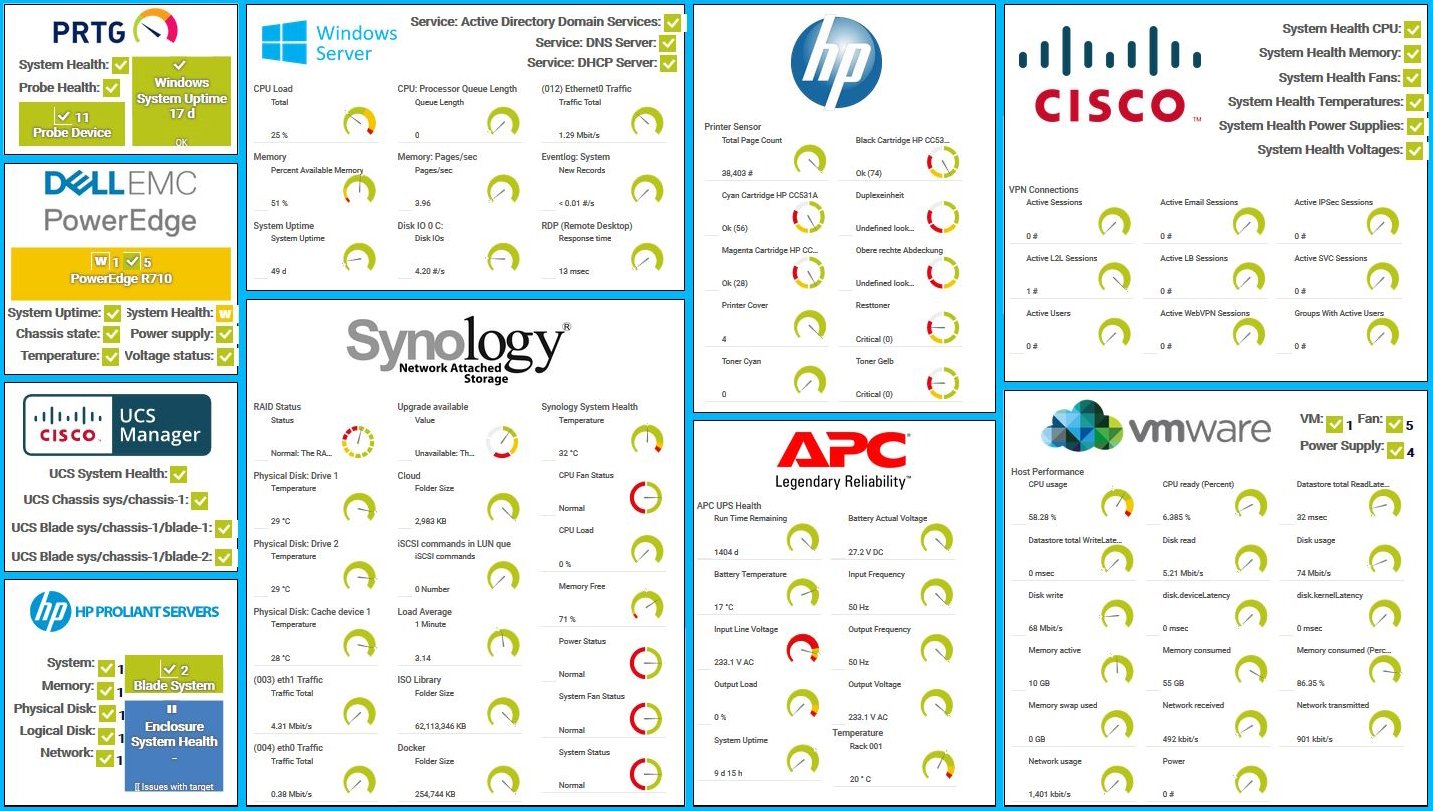
Diagnose network issues by continuously tracking the status of your server hardware. Show CPU usage, fan speed, power supply status, resource utilization, disk usage and space, and other key metrics in real time. Visualize monitoring data in clear graphs and dashboards to identify problems more easily. Gain the overview you need to troubleshoot malfunctioning servers, low memory, and other server issues.

Device tree view of the complete monitoring setup

Custom PRTG dashboard for keeping an eye on the entire IT infrastructure

Live traffic data graph in PRTG
Hardware Monitoring in PRTG
“All-around winning
network monitor”
“The real beauty of PRTG is the endless possibilities it offers”
“PRTG Network Monitor
is very hard to beat”
No more unexpected crashes, no more guessing games. With PRTG, you’ll know exactly what’s going on with your servers – 24/7.
PRTG’s customizable, real-time dashboards let you visualize server health your way. Create a single pane of glass that highlights only the metrics you care about while hiding the noise.
With PRTG’s flexible dashboards, custom color schemes, layout options, and interactive graphs, you spend less time digging for data and more time acting on it.
PRTG’s monitoring system works seamlessly with devices from top providers and manufacturers like Dell, HPE, IBM, and Cisco.
It supports SNMP, WMI, and other protocols, giving you the flexibility to monitor mixed environments. And operating systems? No problem. Microsoft Windows, Linux, Ubuntu, PRTG can handle it.
Don't switch tools. PRTG consolidates your monitoring into one platform. No need for separate tools to monitor on-premises servers, cloud VMs, hard drives, or application health – it’s all here.
No matter if they’re physical, virtual, or in the cloud, PRTG offers a unified view of your server infrastructure, so you see everything in one place.
Get alerts your way. SMS, email, push notifications – you decide how and when you want to be informed. And PRTG’s alert escalation path makes sure that the right person is notified.
Customizable warning and error thresholds let you define what triggers an alert, so you’re only notified about the issues that matter most.
PRTG comes with more than 250 native sensor types for monitoring your entire on-premises, cloud, and hybrid cloud environment out of the box. Check out some examples below!
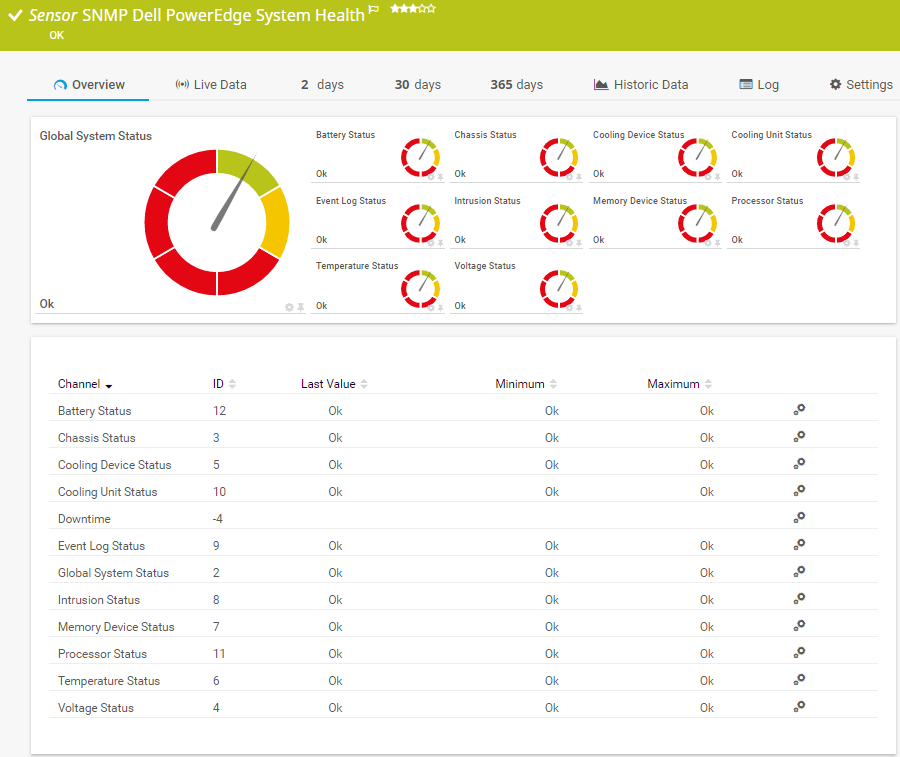
The SNMP Dell PowerEdge System Health sensor monitors the system health of a Dell PowerEdge server. It can show the following:
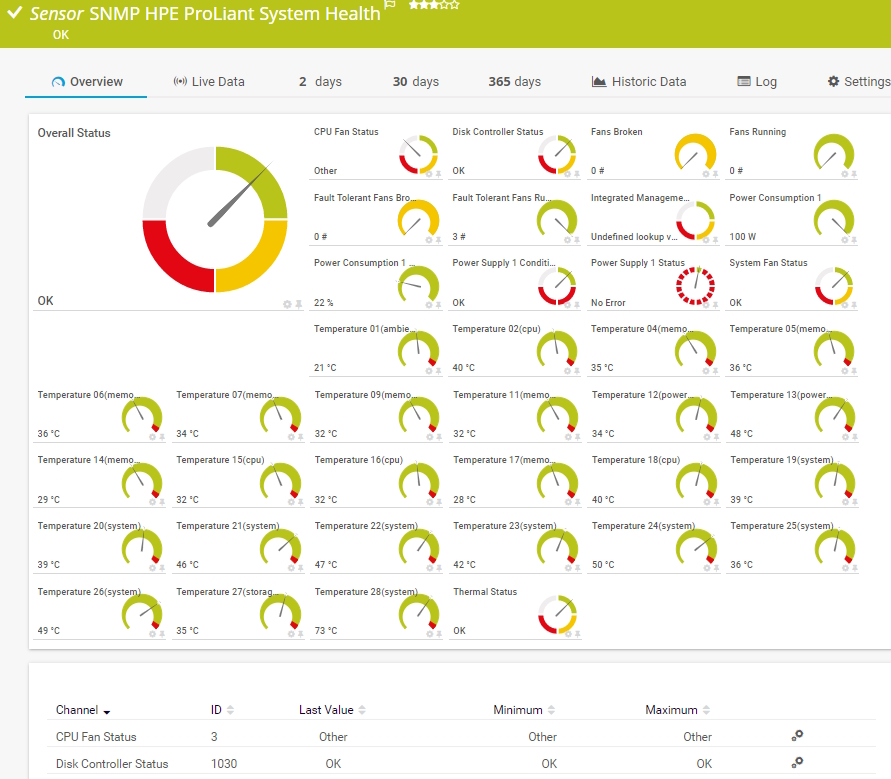
The SNMP HPE ProLiant System Health sensor monitors the system health of an HPE ProLiant server. It can show the following:
• Overall, CPU fan, system fan, thermal, and disk controller status
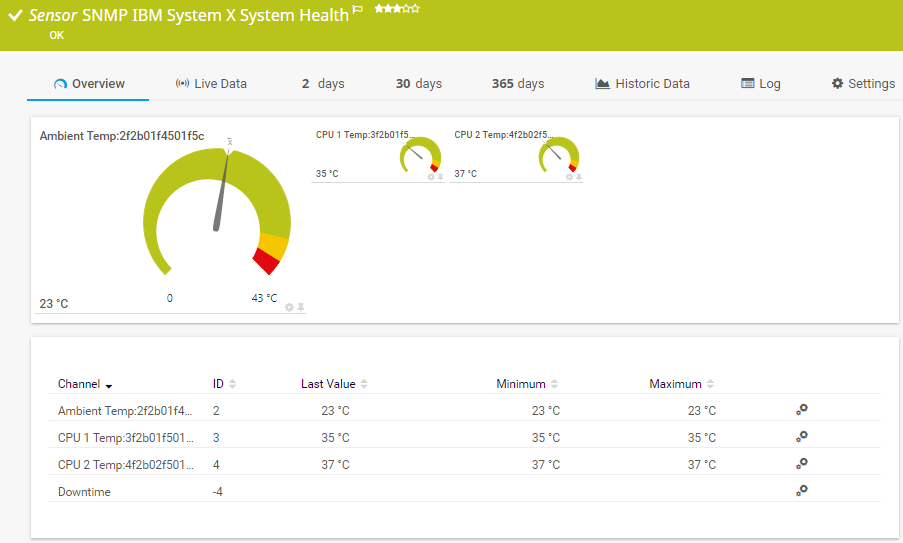
The SNMP IBM System X System Health sensor monitors the system health of an IBM device. It can show the following:
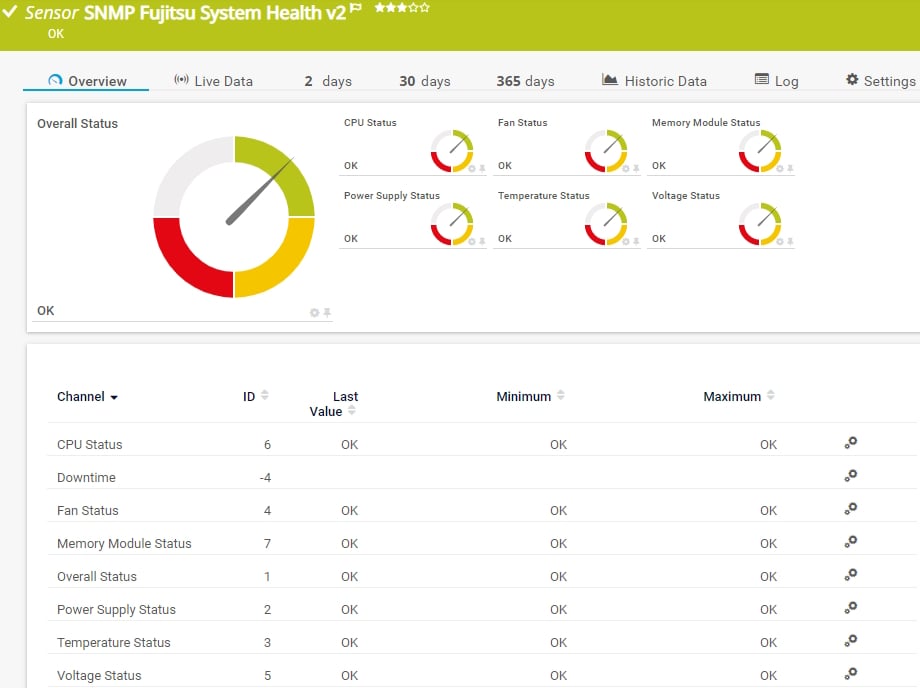
The SNMP Fujitsu System Health v2 sensor monitors the status of a Fujitsu PRIMERGY server via the integrated Remote Management Controller (iRMC) The sensor might also work on other Fujitsu devices that have an iRMC available like PRIMEQUEST servers, some storage systems of the ETERNUS product line, and CELSIUS workstations in racks. It can show the following:
See the PRTG Manual for a list of all available sensor types.

Custom alerts and data visualization let you quickly identify and prevent hardware health and performance issues.
Set up PRTG in minutes and use it on almost any mobile device.

As one of the leading players in the IT monitoring industry, Paessler has also become an authorized Dell partner for building integrated solutions around the Dell technology ecosystem.
What does this mean for you?
Partnering with innovative IT vendors, Paessler unleashes synergies to create
new and additional benefits for joined customers.
Combining PRTG’s broad monitoring feature set with IP Fabric’s automated network assurance creates a new level of network visibility and reliability.
Rhebo and PRTG offer a comprehensive monitoring solution for IT and OT environments: from condition monitoring through to anomaly and threat detection.
UVexplorer integrates tightly with PRTG to bring fast and accurate network discovery, detailed device inventory, and automatic network mapping to the PRTG platform.
Real-time notifications mean faster troubleshooting so that you can act before more serious issues occur.
Network Monitoring Software – Version 26.1.116.1532 (February 9th, 2026)
Download for Windows and cloud-based version PRTG Hosted Monitor available
English, German, Spanish, French, Portuguese, Dutch, Russian, Japanese, and Simplified Chinese
Network devices, bandwidth, servers, applications, virtual environments, remote systems, IoT, and more
Choose the PRTG Network Monitor subscription that's best for you


Server health monitoring is performance monitoring for the brains of your network, providing a comprehensive overview of the status and performance of individual servers. It also includes the monitoring of hardware parameters, external conditions in the server room, and various performance data of the servers and server racks. With a server health check, you can prevent downtime by keeping an eye on server elements such as CPU load and memory use, fans, power supplies and consumption, the temperature of various components, and many other important gauges.
Most companies rely heavily on a stable IT infrastructure. As a result, downtime can lead to many serious problems. When your servers go down, your business stops. Depending on its duration, downtime can also cause significant losses in sales. This is especially true if sales and acquisitions take place via the company website. Customer satisfaction can also suffer if desired services are unavailable due to server problems.
Server health monitoring keeps you ahead of outages by identifying potential failures before they escalate. This prevents downtime, improves server performance, and keeps users happy.
PRTG provides server status and performance monitoring by taking into account all the components that contribute to a healthy server infrastructure. In addition to individual services and applications, PRTG also keeps an eye on hardware components. To do so, it deploys preconfigured system health sensors that are suitable for a variety of different manufacturers.
These sensors use mostly SNMP to query relevant data for systems such as NetApp, Buffalo, Cisco, Dell, HP, IBM, Juniper, LenovoEMC, QNAP, SonicWall, and Synology. PRTG also recognizes virtual VMware, Citrix, and Hyper-V servers, and incorporates them into its monitoring.
Yes. With remote probes, PRTG can monitor servers at multiple sites from a central dashboard. Track local, cloud, and hybrid servers in one place. As your infrastructure grows, so does PRTG. It scales effortlessly to monitor more servers by simply adding more sensors. No forklift upgrades required.
Fast. Really fast. Download it, run the setup, and let the auto-discovery tool find your devices. The auto-discovery feature of PRTG captures your entire server infrastructure within seconds, and automatically detects any network devices that can be reached by ping. You’ll be monitoring servers in less time than it takes to order a pizza.
In PRTG, “sensors” are the basic monitoring elements. One sensor usually monitors one measured value in your network, for example the traffic of a switch port, the CPU load of a server, or the free space on a disk drive. On average, you need about 5-10 sensors per device or one sensor per switch port.
Paessler conducted trials in over 600 IT departments worldwide to tune its network monitoring software closer to the needs of sysadmins. The result of the survey: over 95% of the participants would recommend PRTG – or already have.

Paessler PRTG is used by companies of all sizes. Sysadmins love PRTG because it makes their job a whole lot easier.
Bandwidth, servers, virtual environments, websites, VoIP services – PRTG keeps an eye on your entire network.
Everyone has different monitoring needs. That’s why we let you try PRTG for free.