Custom alerts and data visualization let you quickly identify and prevent hardware issues in your Linux sytems.
Diagnose network issues by continuously tracking CPU usage, memory capacity, disk health, and hardware temperatures. Show resource utilization and other key metrics in real time. Visualize monitoring data in clear graphs and dashboards to identify problems more easily. Gain the overview you need to troubleshoot Linux hardware effectively.
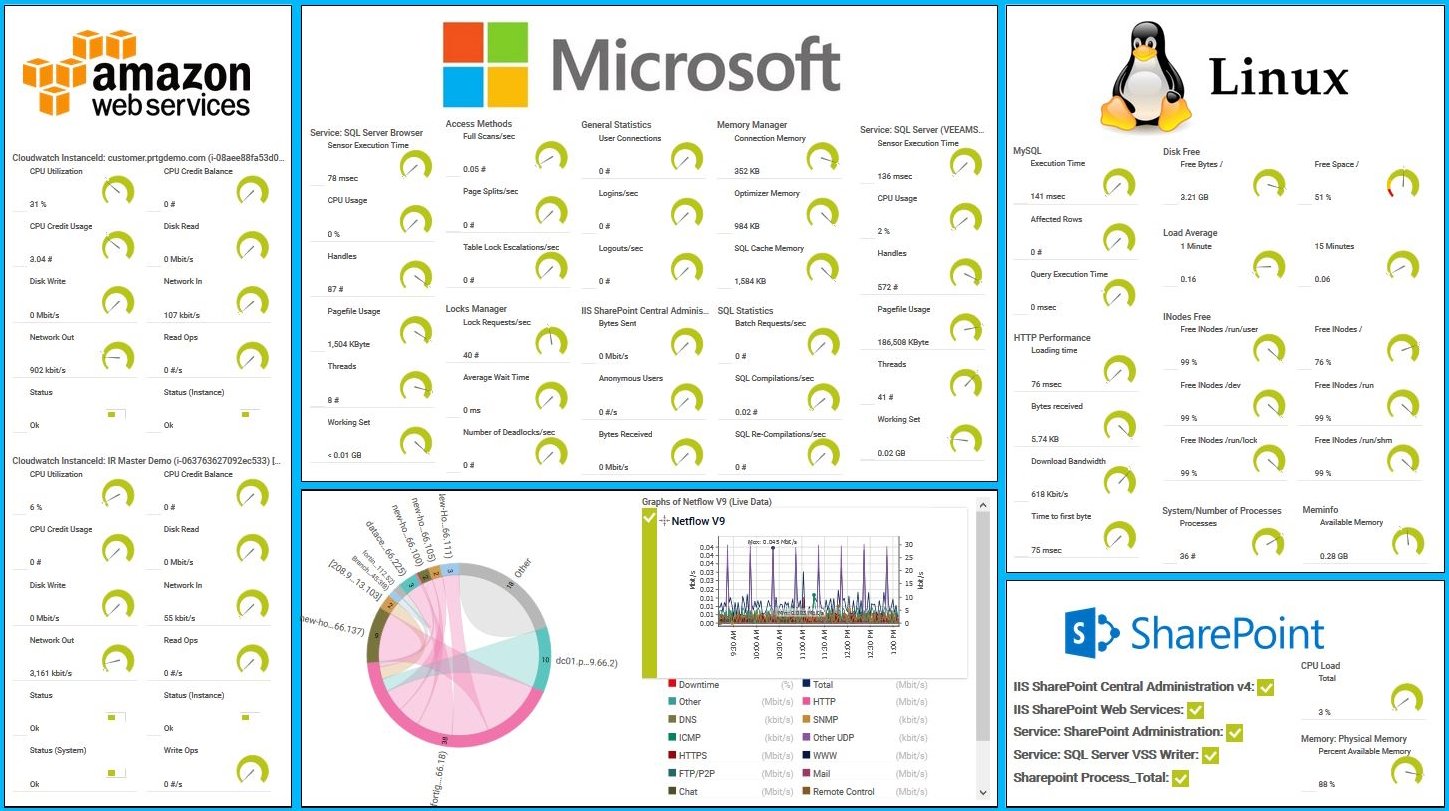
AWS, Linux and Windows services overview with PRTG

Device tree view of the complete monitoring setup

Custom PRTG dashboard for keeping an eye on the entire IT infrastructure

Live traffic data graph in PRTG
“All-around winning
network monitor”
“The real beauty of PRTG is the endless possibilities it offers”
“PRTG Network Monitor
is very hard to beat”
PRTG comes with more than 250 native sensor types for monitoring your entire on-premises, cloud, and hybrid cloud environment out of the box. Check out some examples below!
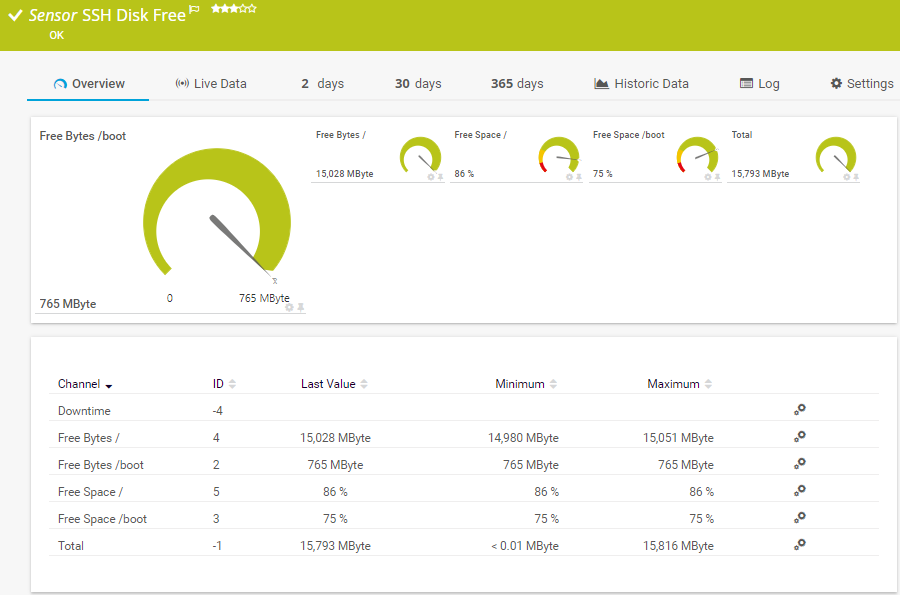
The SSH Disk Free sensor monitors the free space on disks of a Linux/Unix system using Secure Shell (SSH). It can show the following:
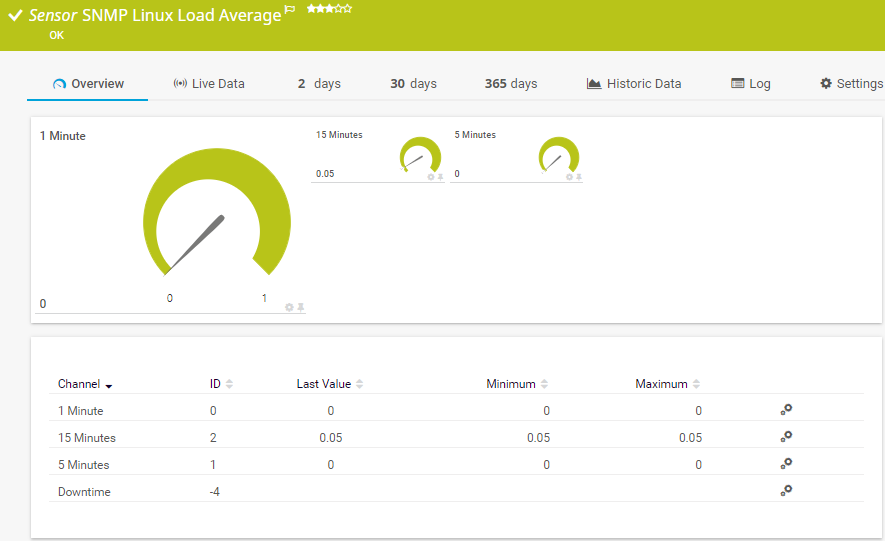
The SNMP Linux Load Average sensor monitors the system load average of a Linux/Unix system. It can show the following:
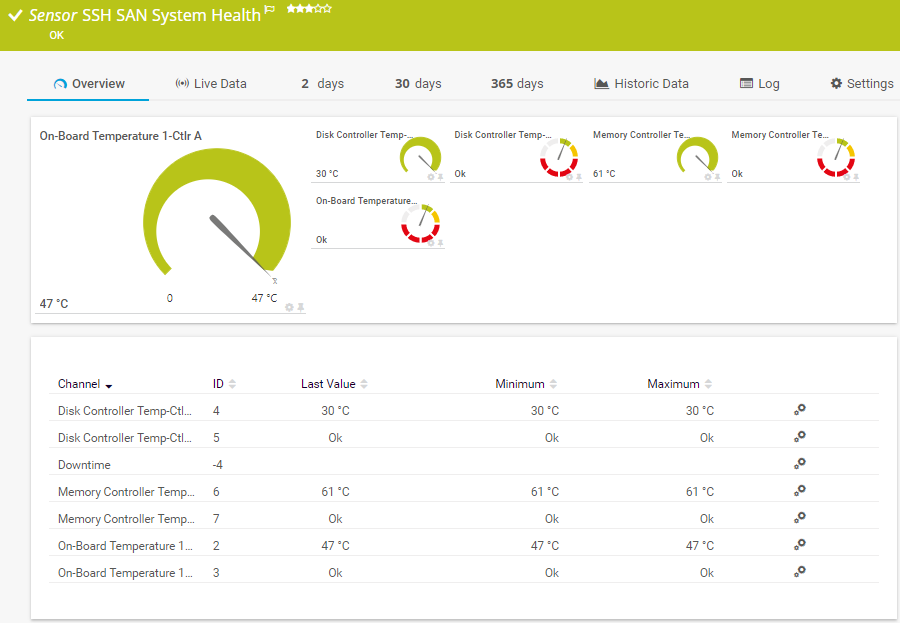
The SSH SAN System Health sensor monitors the system health of a storage area network (SAN) via Secure Shell (SSH). It can show the following:
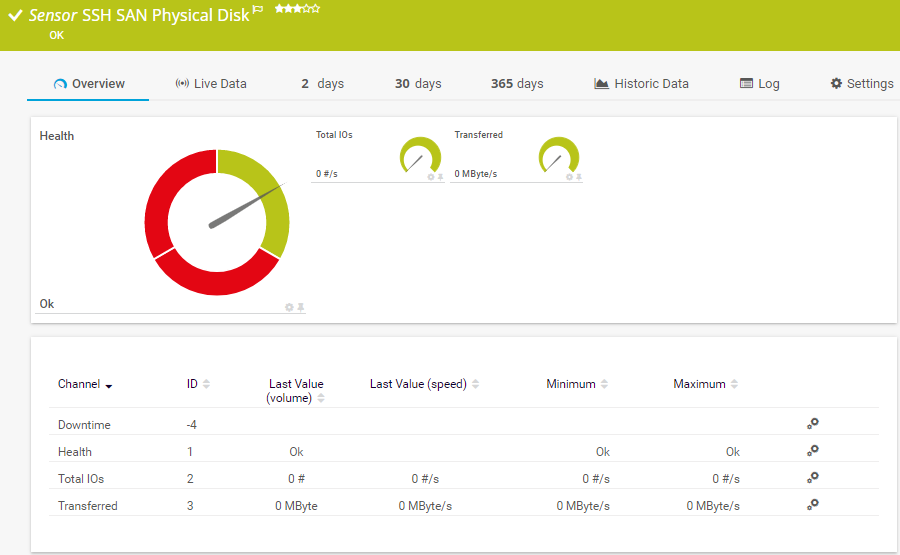
The SSH SAN Physical Disk sensor monitors a physical disk on a storage area network (SAN) via Secure Shell (SSH). It can show the following:
See the PRTG Manual for a list of all available sensor types.

Real-time notifications mean faster troubleshooting so that you can act before more serious issues occur.
PRTG is set up in a matter of minutes and can be used on a wide variety of mobile devices.


“Excellent tool for detailed monitoring. Alarms and notifications work greatly. Equipment addition is straight forward and server initial setup is very easy. ...feel safe to purchase it if you intend to monitor a large networking landscape.”
baramundi and PRTG create a secure, reliable and powerful IT infrastructure where you have everything under control - from the traffic in your firewall to the configuration of your clients.
With the combination of PRTG and Insys, the monitoring specialist Paessler and the industrial gateway manufacturer INSYS icom offer a practical possibility to merge IT and OT.
Siemon and Paessler bring together intelligent building technology and advanced monitoring and make your vision of intelligent buildings and data centers become reality.
Custom alerts and data visualization let you quickly identify and prevent hardware issues in your Linux sytems.
Network Monitoring Software – Version 26.1.116.1532 (February 9th, 2026)
Download for Windows and cloud-based version PRTG Hosted Monitor available
English, German, Spanish, French, Portuguese, Dutch, Russian, Japanese, and Simplified Chinese
Network devices, bandwidth, servers, applications, virtual environments, remote systems, IoT, and more
Choose the PRTG Network Monitor subscription that's best for you

Linux hardware refers to PCs, laptops, or notebooks installed with Linux, as well as systems and servers that run the open-source operating system Linux. Linux hardware monitoring with PRTG refers to the use of specialized sensors to monitor the health, performance, and availability of hardware components within Linux-based systems. These sensors track vital metrics like CPU load, memory, disk usage, temperature, and I/O operations.
If you let CPU loads and hard disk space get out of control, your Linux running processes are going to crawl. And nobody likes slow apps. Keeping an eye on your hardware is crucial—if something starts underperforming, you need to know so you can swap it out before it breaks and ruins your day. Plus, if your hardware gets too hot, things will slow down or even fry. The solution? Monitor everything. Keep resources in the sweet spot and tweak your network for optimal performance when needed.
PRTG provides a comprehensive overview of system health and performance. Our software analyzes CPU performance, disk space usage, memory capacity, system load, system processes, and hardware temperature, among other metrics. It can also monitor disk I/O operations, physical disk health, and server response times.
Temperature monitoring is extremely important, especially for servers: When systems are overloaded, their operating temperatures rise quickly. This can lead to a drop in the reliability of servers. Not to mention service interruptions and failures. In the worst case scenario, data can be lost or hardware damaged.
The SSH SAN System Health is ideal here: it will keep a constant eye on the system status of a storage area network. Among other things, this sensor provides you with information on the:
PRTG offers customizable alerts via email, SMS, push notifications, and even integration with services like Slack or Microsoft Teams. Alerts are triggered based on threshold values you define for various metrics.
In PRTG, “sensors” are the basic monitoring elements. One sensor usually monitors one measured value in your network, for example the traffic of a switch port, the CPU load of a server, or the free space on a disk drive. On average, you need about 5-10 sensors per device or one sensor per switch port.
Paessler conducted trials in over 600 IT departments worldwide to tune its network monitoring software closer to the needs of sysadmins. The result of the survey: over 95% of the participants would recommend PRTG – or already have.

Paessler PRTG is used by companies of all sizes. Sysadmins love PRTG because it makes their job a whole lot easier.
Bandwidth, servers, virtual environments, websites, VoIP services – PRTG keeps an eye on your entire network.
Everyone has different monitoring needs. That’s why we let you try PRTG for free.