• Company
    • About Us
    • Case Studies
    • Press Center
    • Careers
    • Blog
    • Contact us
  • Contact us
  • Login
 
  • English
    • Deutsch
    • Español
    • Français
    • Italiano
    • Português
Paessler
                    - The Monitoring Experts
  • Products
    • Paessler PRTG
      Paessler PRTGMonitor your whole IT infrastructure
      • PRTG Network Monitor
      • PRTG Enterprise Monitor
      • PRTG Hosted Monitor
      • PRTG UVexplorer
      • PRTG extensionsExtensions for Paessler PRTGExtend your monitoring to a new level
    • Icon Features
      FeaturesExplore all monitoring features
      • Maps & dashboards
      • Alerts & notifications
      • Multiple user interfaces
      • Distributed monitoring
      • Customizable reporting
  • Solutions
    • Industries
      IndustriesMonitor various industry sectors
      • Industrial
      • Healthcare
      • Data Center
      • Education
      • Finance
      • Government
    • IT Topics
      IT TopicsMonitor all areas of IT
      • Network Monitoring
      • Bandwidth Monitoring
      • SNMP Monitor
      • Network Mapping
      • WiFi Monitoring
      • Server Monitoring
  • Pricing
  • Resources
    • Getting Started
      Getting StartedModules for self-paced learning
    • How-to Guides
      How-to GuidesGet the most out of PRTG
    • Videos & Webinars
      Videos & WebinarsLearn from Paessler experts
    • IT  Knowledge
      IT KnowledgeExpand your IT knowledge
    • PRTG Manual
      PRTG ManualFull documentation
    • Knowledge Base
      Knowledge BaseShare community knowledge
    • PRTG Sensor Hub
      PRTG Sensor HubGet sensors, scripts & templates
    • Trainings
      PRTG TrainingLearn how to work with PRTG
  • Partners
    • Icon Handshake
      Become a PartnerFor resellers and channel partners
    • Icon MSP
      Become an MSPDeliver monitoring as a managed service
    • icon partner
      Partner PortalLog in to your partner account
    • Deal Registration
      Deal RegistrationRegister your sales opportunities
    • icon search
      Find a PartnerFind partners selling Paessler products
    • icon technology
      Technology AlliancesSee Paessler technology partnerships
    • Partner HubTools for Your Success
  • Company
    • About Us
    • Case Studies
    • Press Center
    • Careers
    • Blog
    • Contact us
  • Contact us
  • Login
  • English
    • Deutsch
    • Español
    • Français
    • Italiano
    • Português
  • Get a quote
  • Free trial

Reliable Server Availability Monitoring 

Catch server outages before users do. Monitor uptime across Windows, Linux, cloud, and on-premises environments

Free download
PRODUCT OVERVIEW

How do you monitor server availability across your entire infrastructure?

Server availability monitoring across mixed environments is rarely a single-tool problem. Windows servers need WMI or SNMP, Linux systems work best with SSH or SNMP, and cloud instances require API-based checks via AWS or Azure credentials. Running separate tools per platform is common, but it means your visibility is fragmented exactly when you need a complete picture most.  

Paessler PRTG brings those checks into one platform, running continuous availability monitoring over ICMP ping, SNMP, WMI, and HTTP across physical servers, virtual machines, cloud instances, and on-premises systems. When a server stops responding, notifications go out immediately. Auto-discovery keeps pace with infrastructure changes so new servers, VMs, and cloud instances get picked up without manual updates. Supported environments include Windows Server, Linux (RHEL, Ubuntu, CentOS, Debian), VMware ESXi, Microsoft Hyper-V, AWS EC2, and Azure Virtual Machines. 

Download PRTG Trial

What you will find on this page

  • Keep Your Infrastructure Running
  • How PRTG Monitors Server Availability
  • Manual Availability Monitoring vs. PRTG
  • FAQs

PRTG is compatible with all major vendors, products, and systems

compatible with all major vendors, products, and systems

Server Monitoring That Keeps Your Infrastructure Running

Stay Ahead of Server Downtime with Continuous Availability Checks 

Continuous availability checks mean your team has the information before anyone else does. PRTG runs uptime monitoring using ICMP ping, SNMP uptime sensors, and service status monitoring, and sends notifications immediately via email, SMS, or push when a server stops responding. Your IT teams have enough lead time to start troubleshooting and resolve issues before downtime reaches anyone outside the building.

What PRTG provides:  

  • ICMP ping and TCP port monitoring for instant availability detection across all server types
  • SNMP uptime sensors that flag failures across operating systems, not just Windows
  • Customizable thresholds to catch real issues early without drowning in false positives
  • Notifications routed by severity to the right team via email, SMS, or push
  • Historical data for spotting outage patterns. Useful for capacity planning, more useful for stopping the same failure from happening twice.

Unified Visibility Across Multi-Vendor Server Environments  

Separate server monitoring tools for Windows, Linux, and cloud instances don't just add overhead. They create gaps. When something breaks your team is toggling between dashboards correlating data instead of actually fixing anything.  

One platform. SNMP for Linux and network devices, WMI for Windows, SSH when you need agent-free Linux coverage, HTTP/HTTPS for web servers and APIs. All of it lands in a single infrastructure monitoring view showing server availability, performance metrics, and resource utilization across your environment. Also remote probes extend that coverage to branch offices and multi-site setups without opening inbound firewall exceptions, which is worth knowing upfront.  

What PRTG provides: 
  • SNMP, WMI, SSH, and HTTP/HTTPS from one platform, no protocol juggling
  • Physical servers, VMware ESXi and Hyper-V VMs, AWS EC2 and Azure instances in one view
  • Remote probes for multi-site and branch office environments
  • Dashboards consolidating server health, CPU usage, disk space, bandwidth, and latency
  • Auto-discovery keeps pace with infrastructure changes so configuration drift doesn't quietly open monitoring gaps
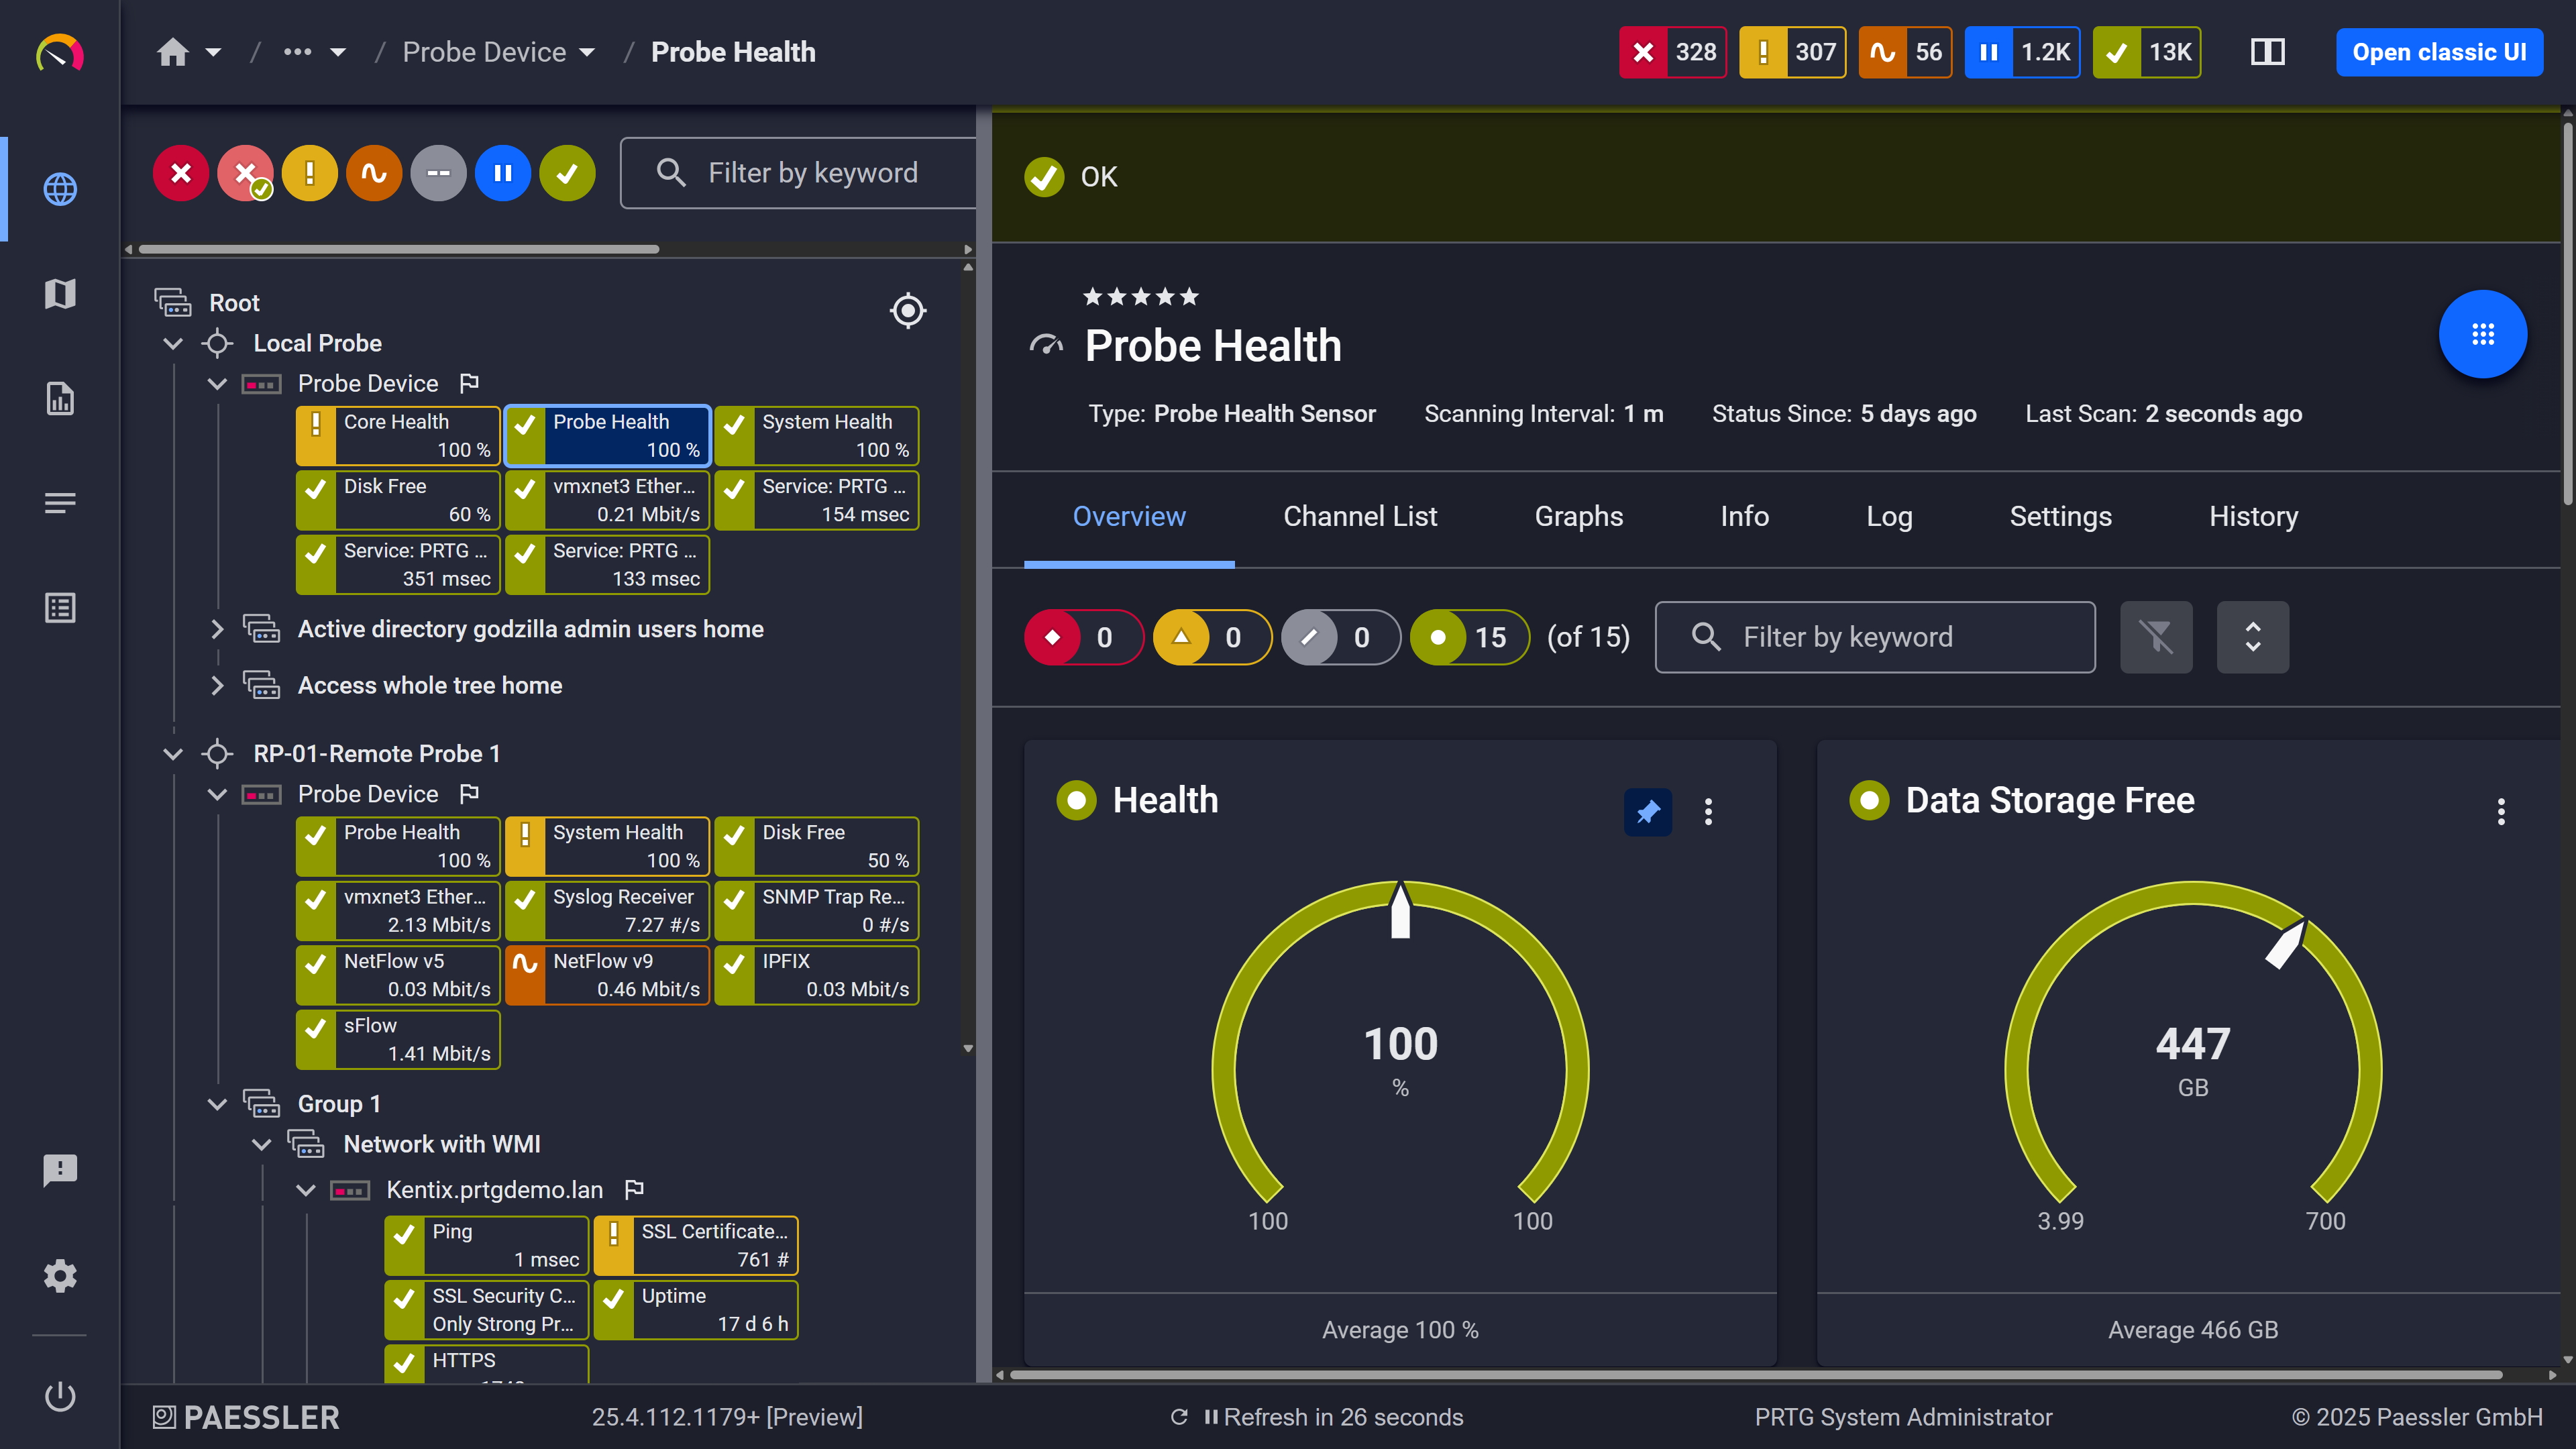
PRTG web interface showing Probe Health sensor with health and storage gauge widgets

Probe health at a glance

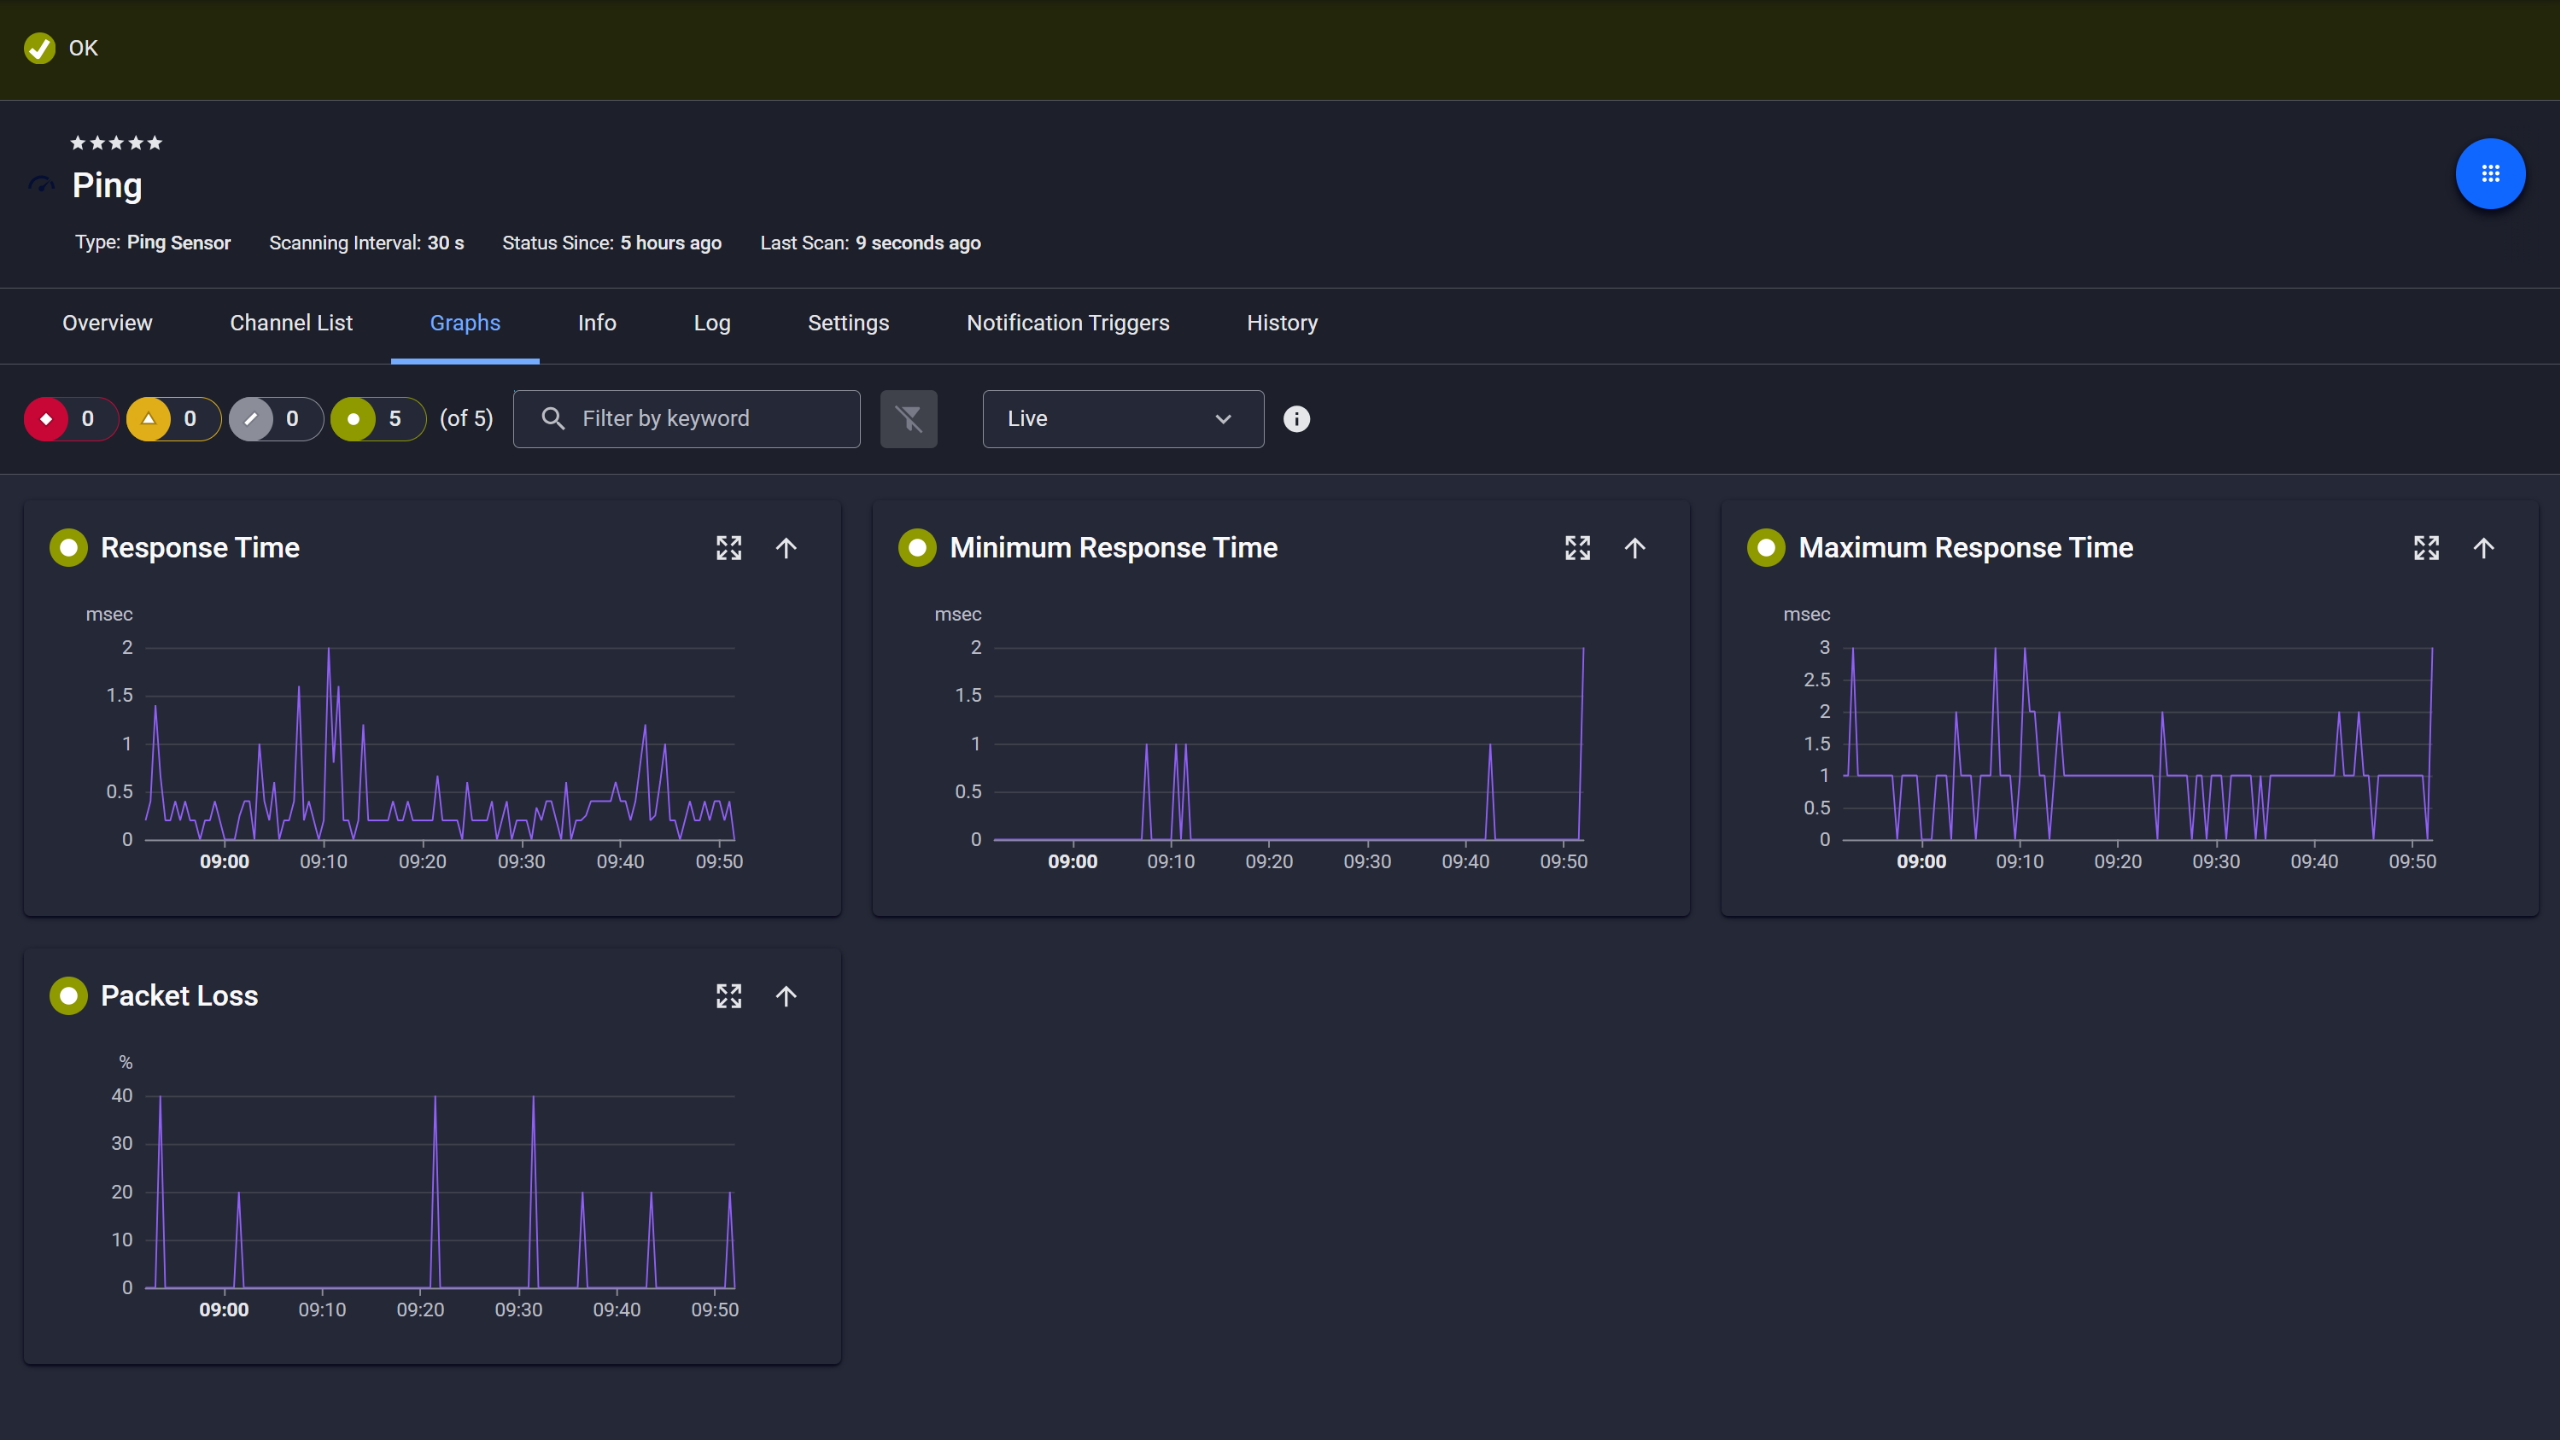
PRTG Ping sensor graphs showing response time, min, max, and packet loss over time

Ping response and packet loss

PRTG web interface showing live performance graphs for a Probe Health sensor

Live graphs, real-time performance data

Prove Server Uptime for SLA Compliance 

When an auditor asks for uptime documentation, the answer shouldn't involve spreadsheets and manual log exports. That's a data problem, not a reporting problem.  

PRTG retains historical availability data automatically. Outage duration, recovery times, uptime percentages, all of it stored without anyone having to remember to export anything. The PRTG SLA Reporter (an extension you can add separately) turns that into structured compliance reports covering MTBF and MTTR. Ready for audits or stakeholder reviews, no assembly required.  

What PRTG provides: 

  • Uptime monitoring with automated historical data collection per monitored server, continuously
  • SLA Reporter calculates uptime percentages, MTBF, MTTR, and total downtime
  • Track availability against 99.9%, 99.99%, or 99.999% SLA thresholds
  • Exportable reports for audits, customer agreements, and capacity planning
  • Downtime pattern analysis to catch recurring issues before they become the next SLA breach

See Why IT Professionals Trust PRTG

Start monitoring your infrastructure in minutes. No professional services, no complex configuration, no risk.

Free download
PRODUCT OVERVIEW

Keep Monitoring Current as Server Environments Evolve

New servers deploy. VMs spin up. Cloud instances scale out overnight. Manual monitoring configuration doesn't keep pace and the gaps don't show up until an incident reveals what wasn't being watched.  

PRTG's auto-discovery scans network ranges continuously. New Windows, Linux, VMware, or cloud-based servers get detected and assigned preconfigured sensors automatically. With 250+ sensor types and device templates, new infrastructure is in server monitoring within minutes. Not a day later after someone remembers to add it.  

What PRTG provides:  
  • Auto-discovery scans network ranges and picks up new servers, VMs, and cloud instances as they appear  
  • 250+ preconfigured sensors covering Windows, Linux, VMware, AWS, Azure, databases, web servers, network devices  
  • Device templates enforce consistent monitoring configurations across new infrastructure  
  • No coverage gaps when environments scale or migrate  
  • Reduced manual setup for IT teams already stretched across competing priorities 
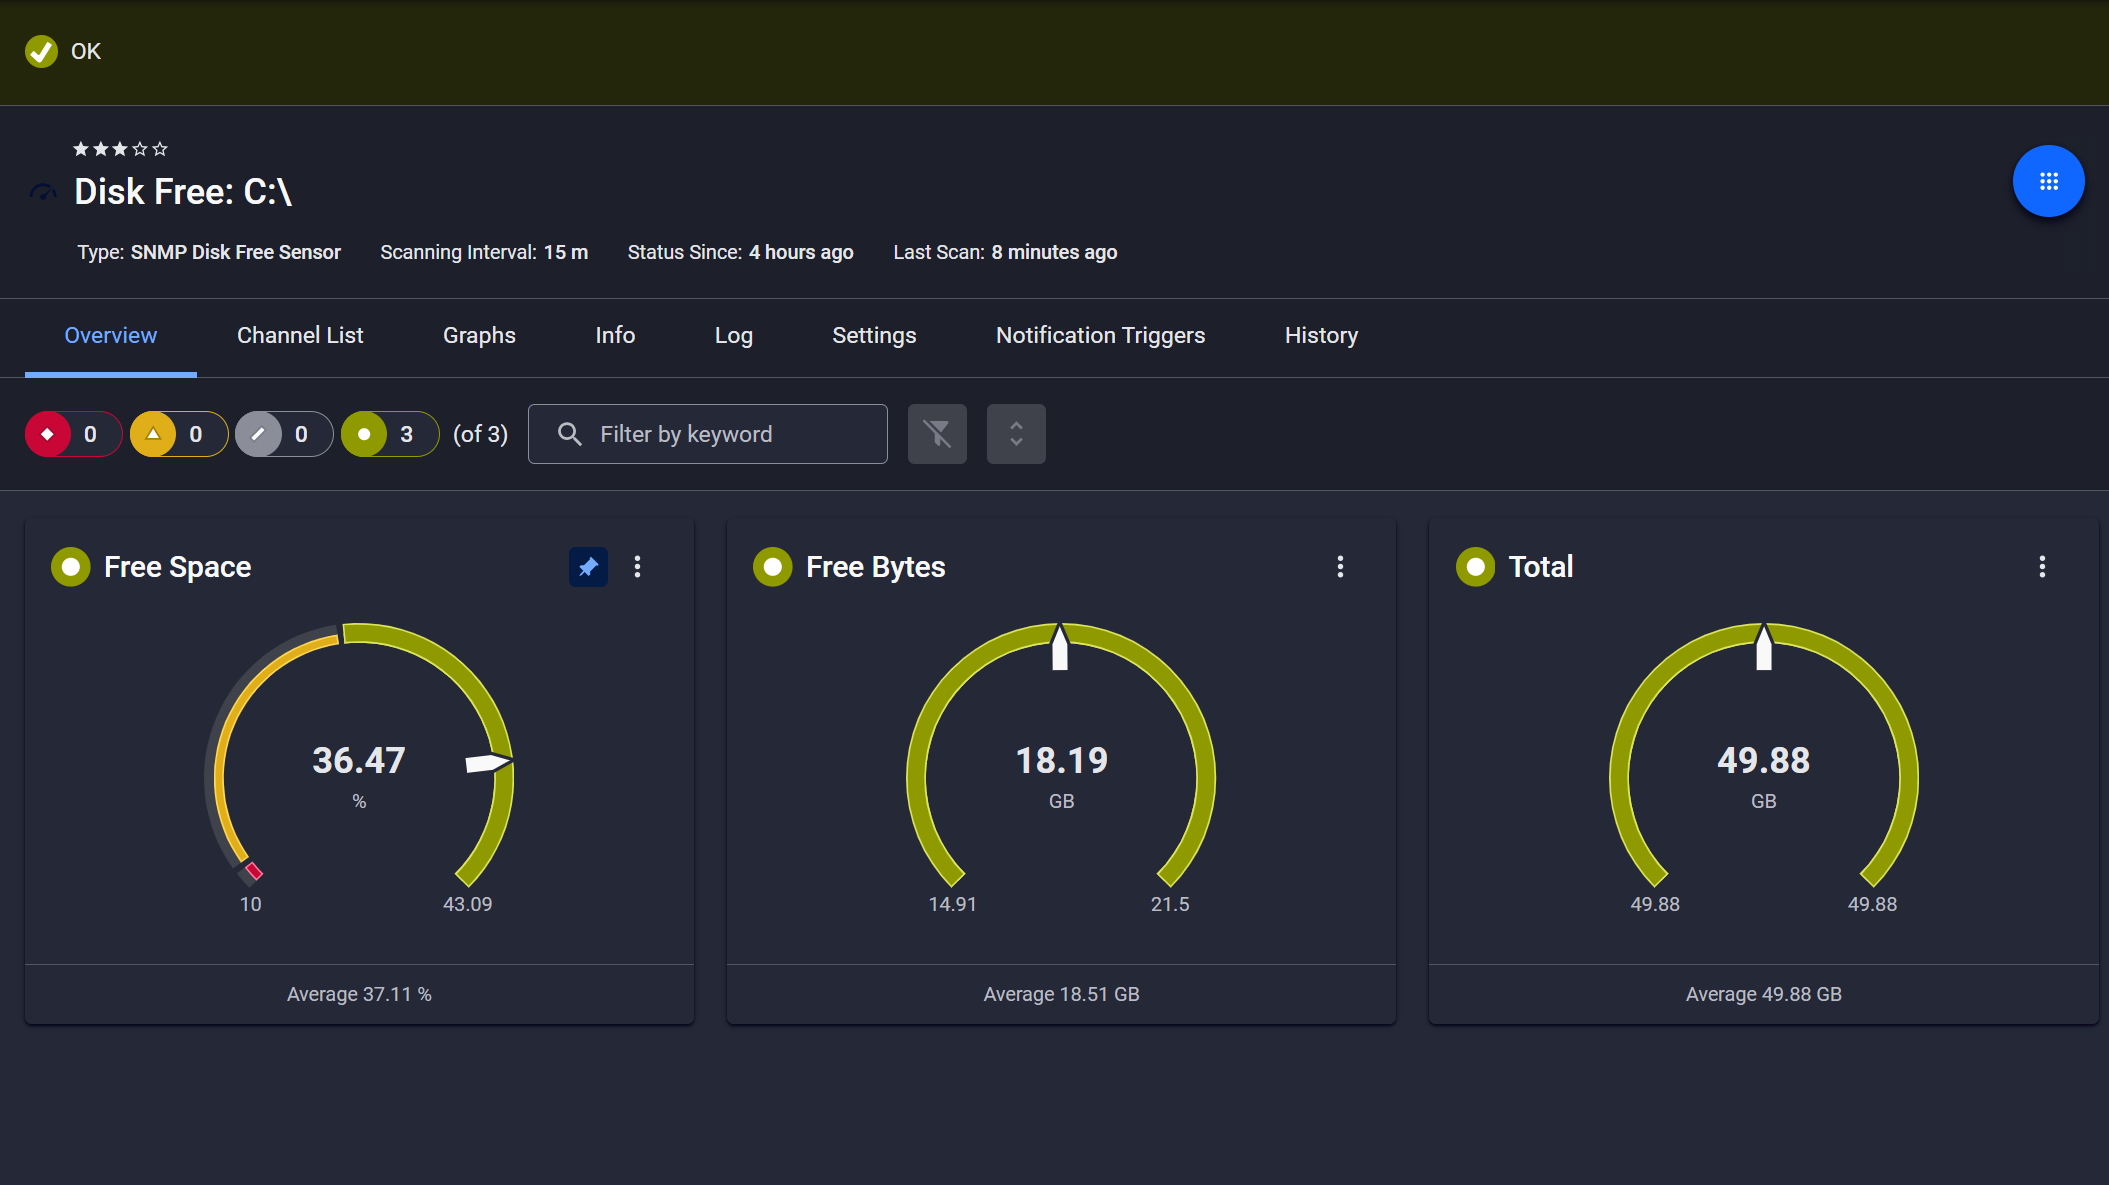
PRTG SNMP Disk Free sensor showing free space, free bytes, and total disk capacity gauges

Disk space monitored, alerts ready

PRTG reports list showing scheduled monitoring reports with run times and sensor counts

Scheduled reports, always on time

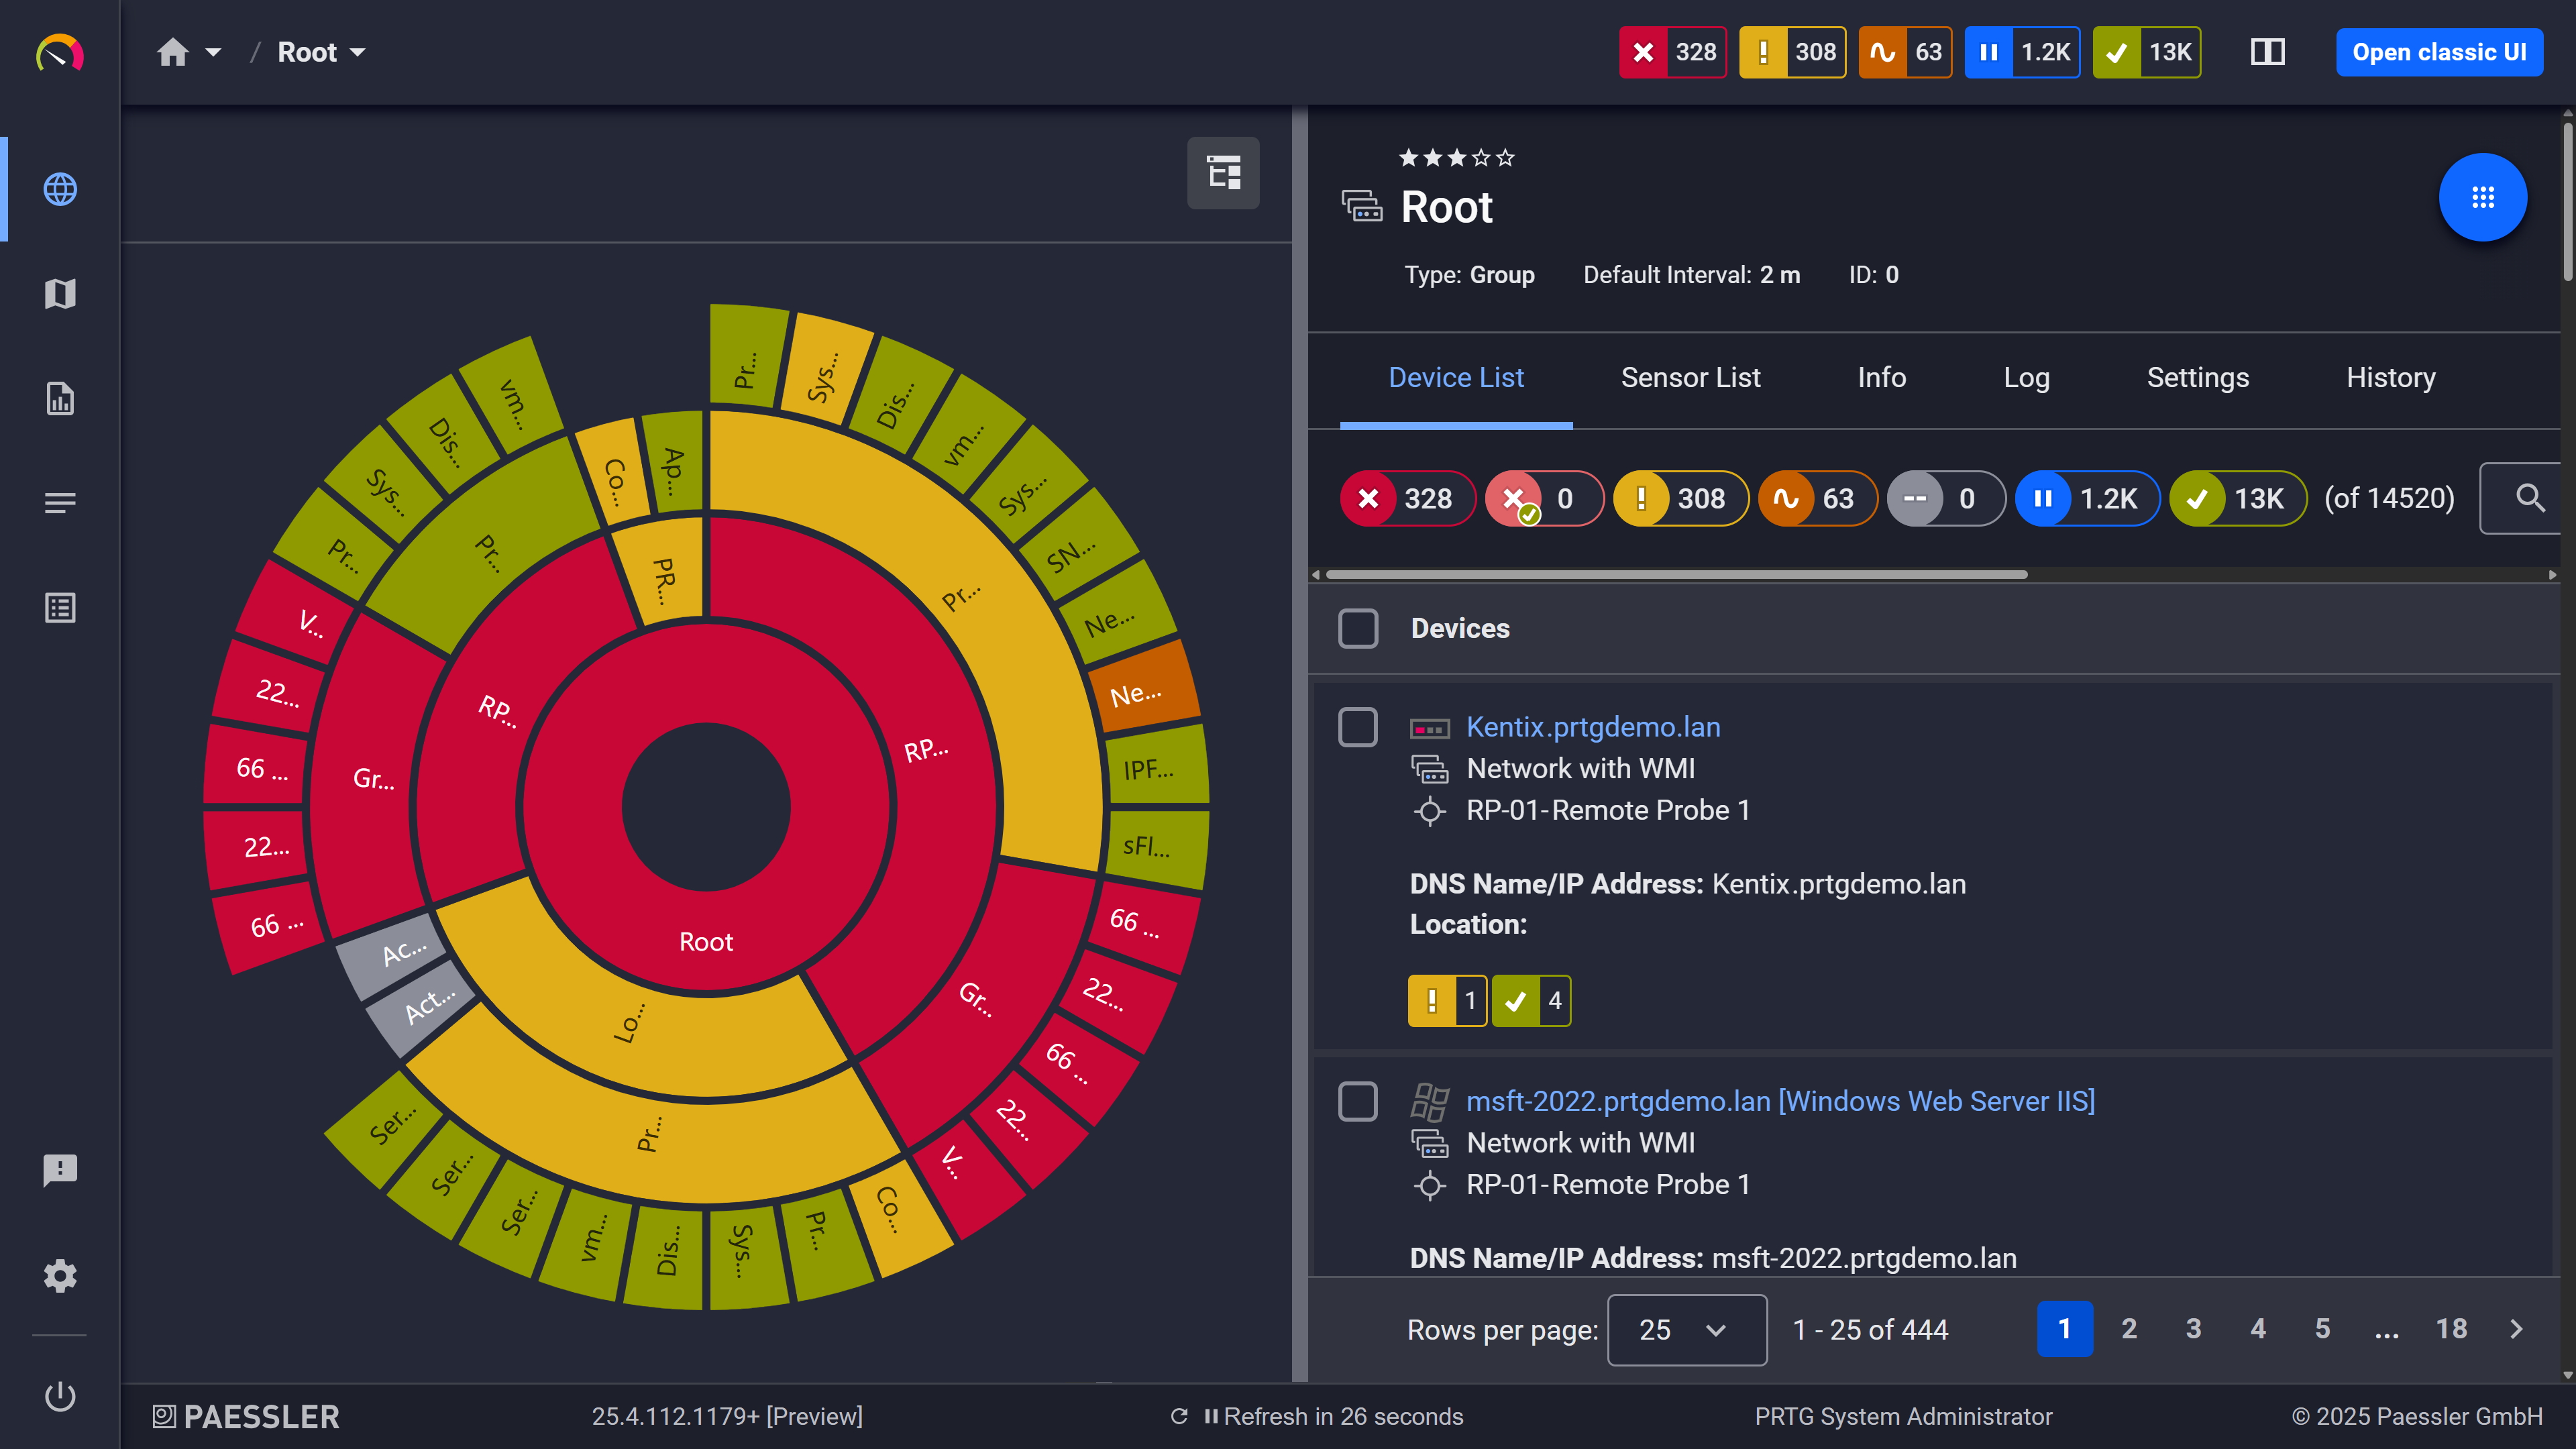
Your entire network, visualized instantly

PRTG sunburst chart visualizing the full network hierarchy with color-coded sensor status

Spot Performance Trends Early and Keep Servers Healthy

Servers give you signals before anything breaks. CPU utilization climbs, disk space fills, memory pressure builds, latency creeps up. PRTG's threshold-based alerts fire when key metrics approach critical levels, giving your team time to act on what the data is already showing. Thresholds are configured per sensor, so alert sensitivity matches the actual requirements of each system. And when upstream failures cascade, dependency mapping keeps the alert queue focused on the actual bottleneck rather than everything downstream from it. 

What PRTG provides:  

  • CPU usage, memory, disk I/O, bandwidth, and response time across all server types
  • Per-sensor warning thresholds, not a global setting that fits no one's environment well
  • Dependency mapping to reduce noise when upstream failures trigger cascading alerts
  • Dashboards showing application performance trends over time, not just current state
  • Historical data for capacity planning, workload optimization, and budget conversations

How PRTG Monitors Server Availability 

PRTG's server monitoring uses multiple methods to track server uptime, health, and performance across diverse server environments. Here's how continuous visibility works in practice. 

Availability Detection

The starting point is network reachability. PRTG's Ping sensor sends ICMP echo requests to confirm a server responds at the network level. From there the picture gets more specific: SNMP uptime sensors query system status on Linux servers, network devices, and hardware, while TCP port monitoring confirms critical services are actually up and not just the host.  

For Windows environments WMI sensors check service states for SQL Server, IIS, or Exchange directly. Linux servers get SSH-based monitoring, no agent required. The HTTP Full Web Page sensor checks whether a web server is returning the right content at an acceptable response time, not just reachable.  

Specific sensors:  

  • Ping sensor: ICMP echo requests for network-level availability
  • SNMP Uptime sensor: Queries system uptime on Linux, network devices, and hardware
  • WMI Service sensor: Windows service status monitoring (SQL Server, IIS, Exchange)
  • HTTP Full Web Page sensor: Web server functionality, response time, and content validation

Cross-Platform Monitoring  

Different server types need different protocols, and PRTG doesn't force you to pick one. SNMP handles Linux, Unix, network monitoring, and hardware health without vendor dependency. WMI goes into Windows-specific detail: event logs, Active Directory, service dependencies, things SNMP doesn't reach. SSH covers agentless Linux monitoring including custom scripts and log file checks. HTTP/HTTPS handles web server uptime, application response time, and API health.  

Protocol use cases:  

  • SNMP: Cross-platform availability, CPU, memory, disk, network bandwidth
  • WMI: Windows-specific metrics including event logs, Active Directory, service dependencies
  • SSH: Agentless Linux monitoring, custom application checks, log file monitoring, process tracking
  • HTTP/HTTPS: Web server uptime, application response time, API health checks

Automated Server Discovery

Auto-discovery in PRTG scans IP ranges, subnets, or Active Directory domains and identifies what's there. Windows servers, Linux systems, VMware ESXi hosts, AWS EC2 instances, Azure VMs, network-attached servers. Once a device is found PRTG applies recommended sensors based on device type. Device templates define the standard sensor set per category so new servers inherit consistent monitoring configurations automatically.  

Discovery methods:  

  • IP range scan: Detects devices via ping, identifies type via SNMP or WMI  
  • Active Directory integration: Discovers Windows servers and domain infrastructure  
  • VMware and Hyper-V discovery: Finds virtual machines and host systems  
  • AWS and Azure integration: Discovers cloud instances via API credentials 

Threshold-Based Alerts 

Thresholds trigger notifications when server metrics cross the levels you define. The more useful piece is dependency mapping.  

When an upstream network switch fails and takes 50 servers with it, PRTG sends one alert for the switch rather than 50 server-down notifications. Child sensors pause automatically while the parent is down, so your team sees the actual problem instead of working through a flood of secondary alerts.  

Dependency examples:  

  • Network dependencies: Server sensors pause when the upstream switch or router is down
  • Application dependencies: Web application sensors pause when the database server is unreachable
  • Master/child relationships: Hierarchical dependency chains from datacenter level down to individual servers

Dashboards and Historical Reporting

Customizable dashboards visualize server availability, performance metrics, resource utilization, and uptime trends using maps, gauges, graphs, and tables. IT teams can create role-specific views. Dashboards refresh every 60 seconds, faster for critical sensors. Historical data tracks uptime percentages, outage frequency, and performance trends for SLA compliance reporting and capacity planning.  

Dashboard components:  

  • Top lists: Servers with highest CPU load, lowest disk space, or slowest response time
  • Status summaries: Servers monitored, overall uptime percentage, sensors currently in alarm
  • Trend graphs: CPU utilization and disk space consumption over configurable time ranges
  • Geographic maps: Distributed server locations with real-time status indicators
free downLoad

Server Availability Monitoring: PRTG vs. Manual Methods

FEATURE

Manual Approach

Manual Approach

With PRTG

With PRTG

Continuous Availability Monitoring

Manual Approach
not included

Check servers individually via ping, login attempts, or wait for user reports

With PRTG
included

Automated availability checks every 60 seconds (or faster) across all servers with instant notifications

Multi-Platform Coverage

Manual Approach
not included

Use different server monitoring tools for Windows (Event Viewer, PowerShell), Linux (command-line scripts, Nagios), cloud (AWS CloudWatch, Azure Monitor)

With PRTG
included

Single monitoring solution for Windows, Linux, VMware, AWS, Azure, on-premises, and cloud-based servers using SNMP, WMI, SSH, HTTP

Uptime Tracking & SLA Reporting 

Manual Approach
not included

Manually log outages, calculate uptime percentages in spreadsheets, export logs from multiple sources

With PRTG
included

Automated historical data collection with PRTG SLA Reporter (extension you can add) generating compliance reports (MTBF, MTTR, uptime %)

Proactive Issue Detection

Manual Approach
not included

Wait for crashes, performance complaints, or periodic manual checks to discover server issues

With PRTG
included

Threshold-based alerts notify IT teams when CPU, disk, memory, or latency approach critical levels before failures occur 

Centralized Visibility

Manual Approach
not included

Log into each server individually, check multiple dashboards, correlate data manually across tools

With PRTG
included

Single dashboard shows server health, uptime, performance metrics, and resource usage across entire infrastructure

free downLoad

“From a server perspective, we're monitoring all of the key components of our service such as CPU usage, RAM disk space, the Windows services that it's running, and network connectivity of that server. In terms of networks, we’re monitoring all of our switches, firewalls, and access points. It’s really useful to be able to easily pull performance metrics from the PRTG dashboard.”

Ollie Kerslake, Infrastructure Lead
Riverford Organic Farmers

“The tool has given us greater control over all types of devices connected to the network (switches, IP telephony, security cameras, IoT, WiFi) that previously remained opaque when dealing with service incidents. This has improved our ability to diagnose and resolve problems, which has translated into greater efficiency and a better user experience in both internal and public services.”

Jordi Tolosà Bel, New Technologies Technician
Vinaroz City Council

“Our objective was to be able to monitor the health of our most critical servers containing data and applications, but also the flows and bandwidth between headquarters, our 50 servers in the cloud and the 15 servers at our production sites. For us, it is essential to have a proactive approach to understand where the weaknesses of the IT system are to be able to improve them.”

Marc Boullier, CIO
Carambar & Co

Paessler PRTG Network Monitor licenses & pricing

Choose the PRTG Network Monitor subscription that's best for you.

License NameLicense descriptionPriceLicense DetailsGet startedPricing Details
PRTG 500$200per month paid annuallyBuy nowBuy now

Enough to monitor multiple aspects of 50 devices

PRTG 1000$358per month paid annuallyBuy nowBuy now

Enough to monitor multiple aspects of 100 devices

PRTG 2500$742per month paid annuallyBuy nowBuy now

Enough to monitor multiple aspects of 250 devices

PRTG 5000$1,300per month paid annuallyBuy nowBuy now

Enough to monitor multiple aspects of 500 devices

PRTG 10000$1,642per month paid annuallyBuy nowBuy now

Enough to monitor multiple aspects of 1000 devices

Over 100,000 Customers Worldwide Love Paessler  

customer success stories

Server Availability Monitoring: Frequently Asked Questions


What is server availability monitoring?

Uptime monitoring tells you whether a server is online, responding, and actually reachable. PRTG's server monitoring runs those checks using ICMP ping, SNMP uptime sensors, WMI system checks, SSH monitoring, and HTTP/HTTPS probes.  

People mix this up with performance monitoring but they're not the same thing. Availability is "is it up." Performance is the harder question, CPU usage, disk I/O, memory pressure, latency, response time. A server can be reachable and still be too degraded to matter to the application running on it.

What types of servers can PRTG monitor?

Physical servers, virtual servers (e.g. VMware ESXi and Hyper-V VMs), AWS and Azure cloud instances, web servers (Apache, IIS, NGINX), database servers (SQL Server, MySQL, Oracle), application servers, file servers, mail servers. Windows Server and Linux across the main distributions plus Unix variants.  

Protocol-wise SNMP handles cross-platform coverage, WMI goes deeper into Windows-specific metrics, SSH covers Linux without an agent. Most of that works without installing server monitoring software on the monitored system, which matters when you're looking at hundreds of servers.

How does PRTG detect when a server goes down?

ICMP ping checks basic network reachability. TCP port monitoring goes further and confirms whether critical services are actually listening, because a server can respond to ping while the service on it is completely dead. SNMP uptime sensors query device status directly. WMI sensors watch Windows service states.  

Notifications go out via email, SMS, push, or different  webhookswhen something goes unresponsive. Also worth understanding how dependency mapping fits in here: if a switch fails and takes 50 servers offline PRTG sends one alert for the switch. Working through 50 simultaneous server alerts to find the actual cause is exactly the situation dependency mapping exists to prevent. 

Can PRTG monitor servers in cloud environments like AWS and Azure?

Yes. EC2 instances, RDS databases, Elastic Load Balancers on AWS. Virtual Machines, SQL Database, App Services on Azure. Native cloud sensors plus standard protocols depending on what the instance supports.  

Remote probes can run inside the cloud network or from on-premises. Hybrid setups land in the same view, physical servers, VMware VMs, cloud instances together. One thing worth flagging upfront: native GCP sensors aren't available out-of-the-box, so Google Cloud coverage needs a different approach. 

What's the difference between server availability monitoring and server performance monitoring?

Availability is one question: is the server up and reachable. Ping, uptime checks, service status sensors answer it.  

Server Performance is what comes after. CPU, disk space, disk I/O, memory, bandwidth, latency, response time. That's where bottlenecks develop before availability becomes the problem. PRTG does both from the same platform, which means when a performance issue escalates into an outage you're not switching tools mid-incident to figure out what happened. 

Does PRTG require agents on servers?

For most environments no. SNMP, WMI, SSH, and HTTP/HTTPS are already active on the systems you want to monitor. SNMP for Linux and hardware, WMI for Windows and Active Directory, SSH for log checks and custom scripts, HTTP/HTTPS for web servers and APIs. Nothing to install on the monitored server.  

Remote probes handle distributed environments where you need collectors closer to the monitored segment. They don't sit on individual servers, they collect from a network location. Worth knowing if you're managing a large environment where deploying agents across everything isn't realistic. 

Can PRTG monitor both on-premises and cloud servers from one dashboard?

Yes. Deploy probes where the servers are: datacenter, branch office, AWS VPC, Azure virtual network. Everything reports back to one PRTG core server.  

Server availability, performance metrics, resource usage across physical, virtual, and cloud in one place. No exporting data between server monitoring tools, no switching dashboards per environment to get a complete picture. 

Paessler PRTG

Paessler PRTG

Network Monitoring Software – Version 26.1.116.1532 (February 9th, 2026)

Hosting icon

Hosting

Download for Windows and cloud-based version PRTG Hosted Monitor available

Languages icon

Languages

English, German, Spanish, French, Portuguese, Dutch, Russian, Japanese, and Simplified Chinese

test

Monitor everything

Network devices, bandwidth, servers, applications, virtual environments, remote systems, IoT, and more

test

Pricing

Choose the PRTG Network Monitor subscription that's best for you

Discover more monitoring insights and stories

Content illustration

Powerful stories from the monitoring world

  • Monitoring availability and energy efficiency in data centers
  • DNS Monitoring: Essential Security Guide for Network Administrators
  • Uptime vs Availability: Why IT Teams Need Both Metrics for True ...
Support illustration

Resources to master your monitoring challenges

  • How can I monitor my server's availability?
  • PRTG Manual: Monitoring via HTTP - Paessler
  • How to check some web sites availability from a special server ...
Solution illustration

Solutions for all your monitoring needs

  • Server Availability Monitoring
  • Server Uptime Monitoring
  • Server Monitoring
PRTG Logo

Start Monitoring with PRTG and see how it can make your network more reliable and your job easier.

Free download
PRODUCT OVERVIEW

Products

  • Paessler PRTG
    Paessler PRTGMonitor your whole IT infrastructure
    • PRTG Network Monitor
    • PRTG Enterprise Monitor
    • PRTG Hosted Monitor
    • PRTG UVexplorer
    • PRTG extensions
      Extensions for Paessler PRTGExtend your monitoring to a new level
  • Icon Features
    FeaturesExplore all monitoring features

Monitoring with PRTG

  • Network monitoring
  • Bandwidth monitoring
  • SNMP monitoring
  • Network mapping
  • Wi-Fi monitoring
  • Server monitoring
  • Network traffic analyzer
  • NetFlow monitoring
  • Syslog server

Useful Links

  • PRTG Manual
  • Knowledge Base
  • Customer Success Stories
  • About Paessler
  • Subscribe to newsletter
  • PRTG Support
  • PRTG Consulting
  • PRTG Feedback & Roadmap

Contact

Paessler GmbH
Thurn-und-Taxis-Str. 14, 
90411 Nuremberg 
Germany

[email protected]

+49 911 93775-0

  • Contact us
©2026 Paessler GmbHTerms & ConditionsPrivacy PolicyImprintReport VulnerabilityDownload & InstallSitemap
LAN Monitoring Tool LAN Monitoring Tool LAN Monitoring Tool