- English
- Deutsch
- Español
- Français
- Italiano
- Português
A complete Citrix monitoring setup covers more than the virtualization layer. Hosts, virtual machines, the Windows OS running on them, the network they depend on, and the availability of critical services all need to be in view. PRTG addresses this with dedicated sensors for Citrix XenServer, WMI for Windows-based components, and SNMP for network devices. The coverage is infrastructure-layer monitoring, not session analytics or logon phase diagnostics.
PRTG monitors Citrix XenServer, Citrix Virtual Apps and Desktops (CVAD), Citrix XenApp, Windows Server, VMware, Microsoft Hyper-V, Microsoft Azure VMs, Linux on VMs (via SNMP and SSH), routers, switches, and firewalls (via SNMP). All of that is visible from a single interface alongside network performance data.

When Citrix performance drops, the cause could be the XenServer host, a VM under load, a congested switch port, or a saturated WAN link. Most Citrix-specific tools don't show the network. Most network tools don't show what Citrix infrastructure is experiencing. That leaves you pulling data from two separate systems and correlating it manually. PRTG puts both in the same place: Citrix host and VM metrics sit alongside network device data in one dashboard, on the same timeline.
XenServer hosts share resources across every virtual machine running on them. Continuous monitoring of CPU load and memory on the host level means your team sees resource pressure building across all VMs at once, with configurable thresholds that trigger alerts while performance is still intact. PRTG continuously polls host-level metrics including CPU usage and memory, with configurable thresholds that alert your team before resource pressure turns into a Citrix performance problem.
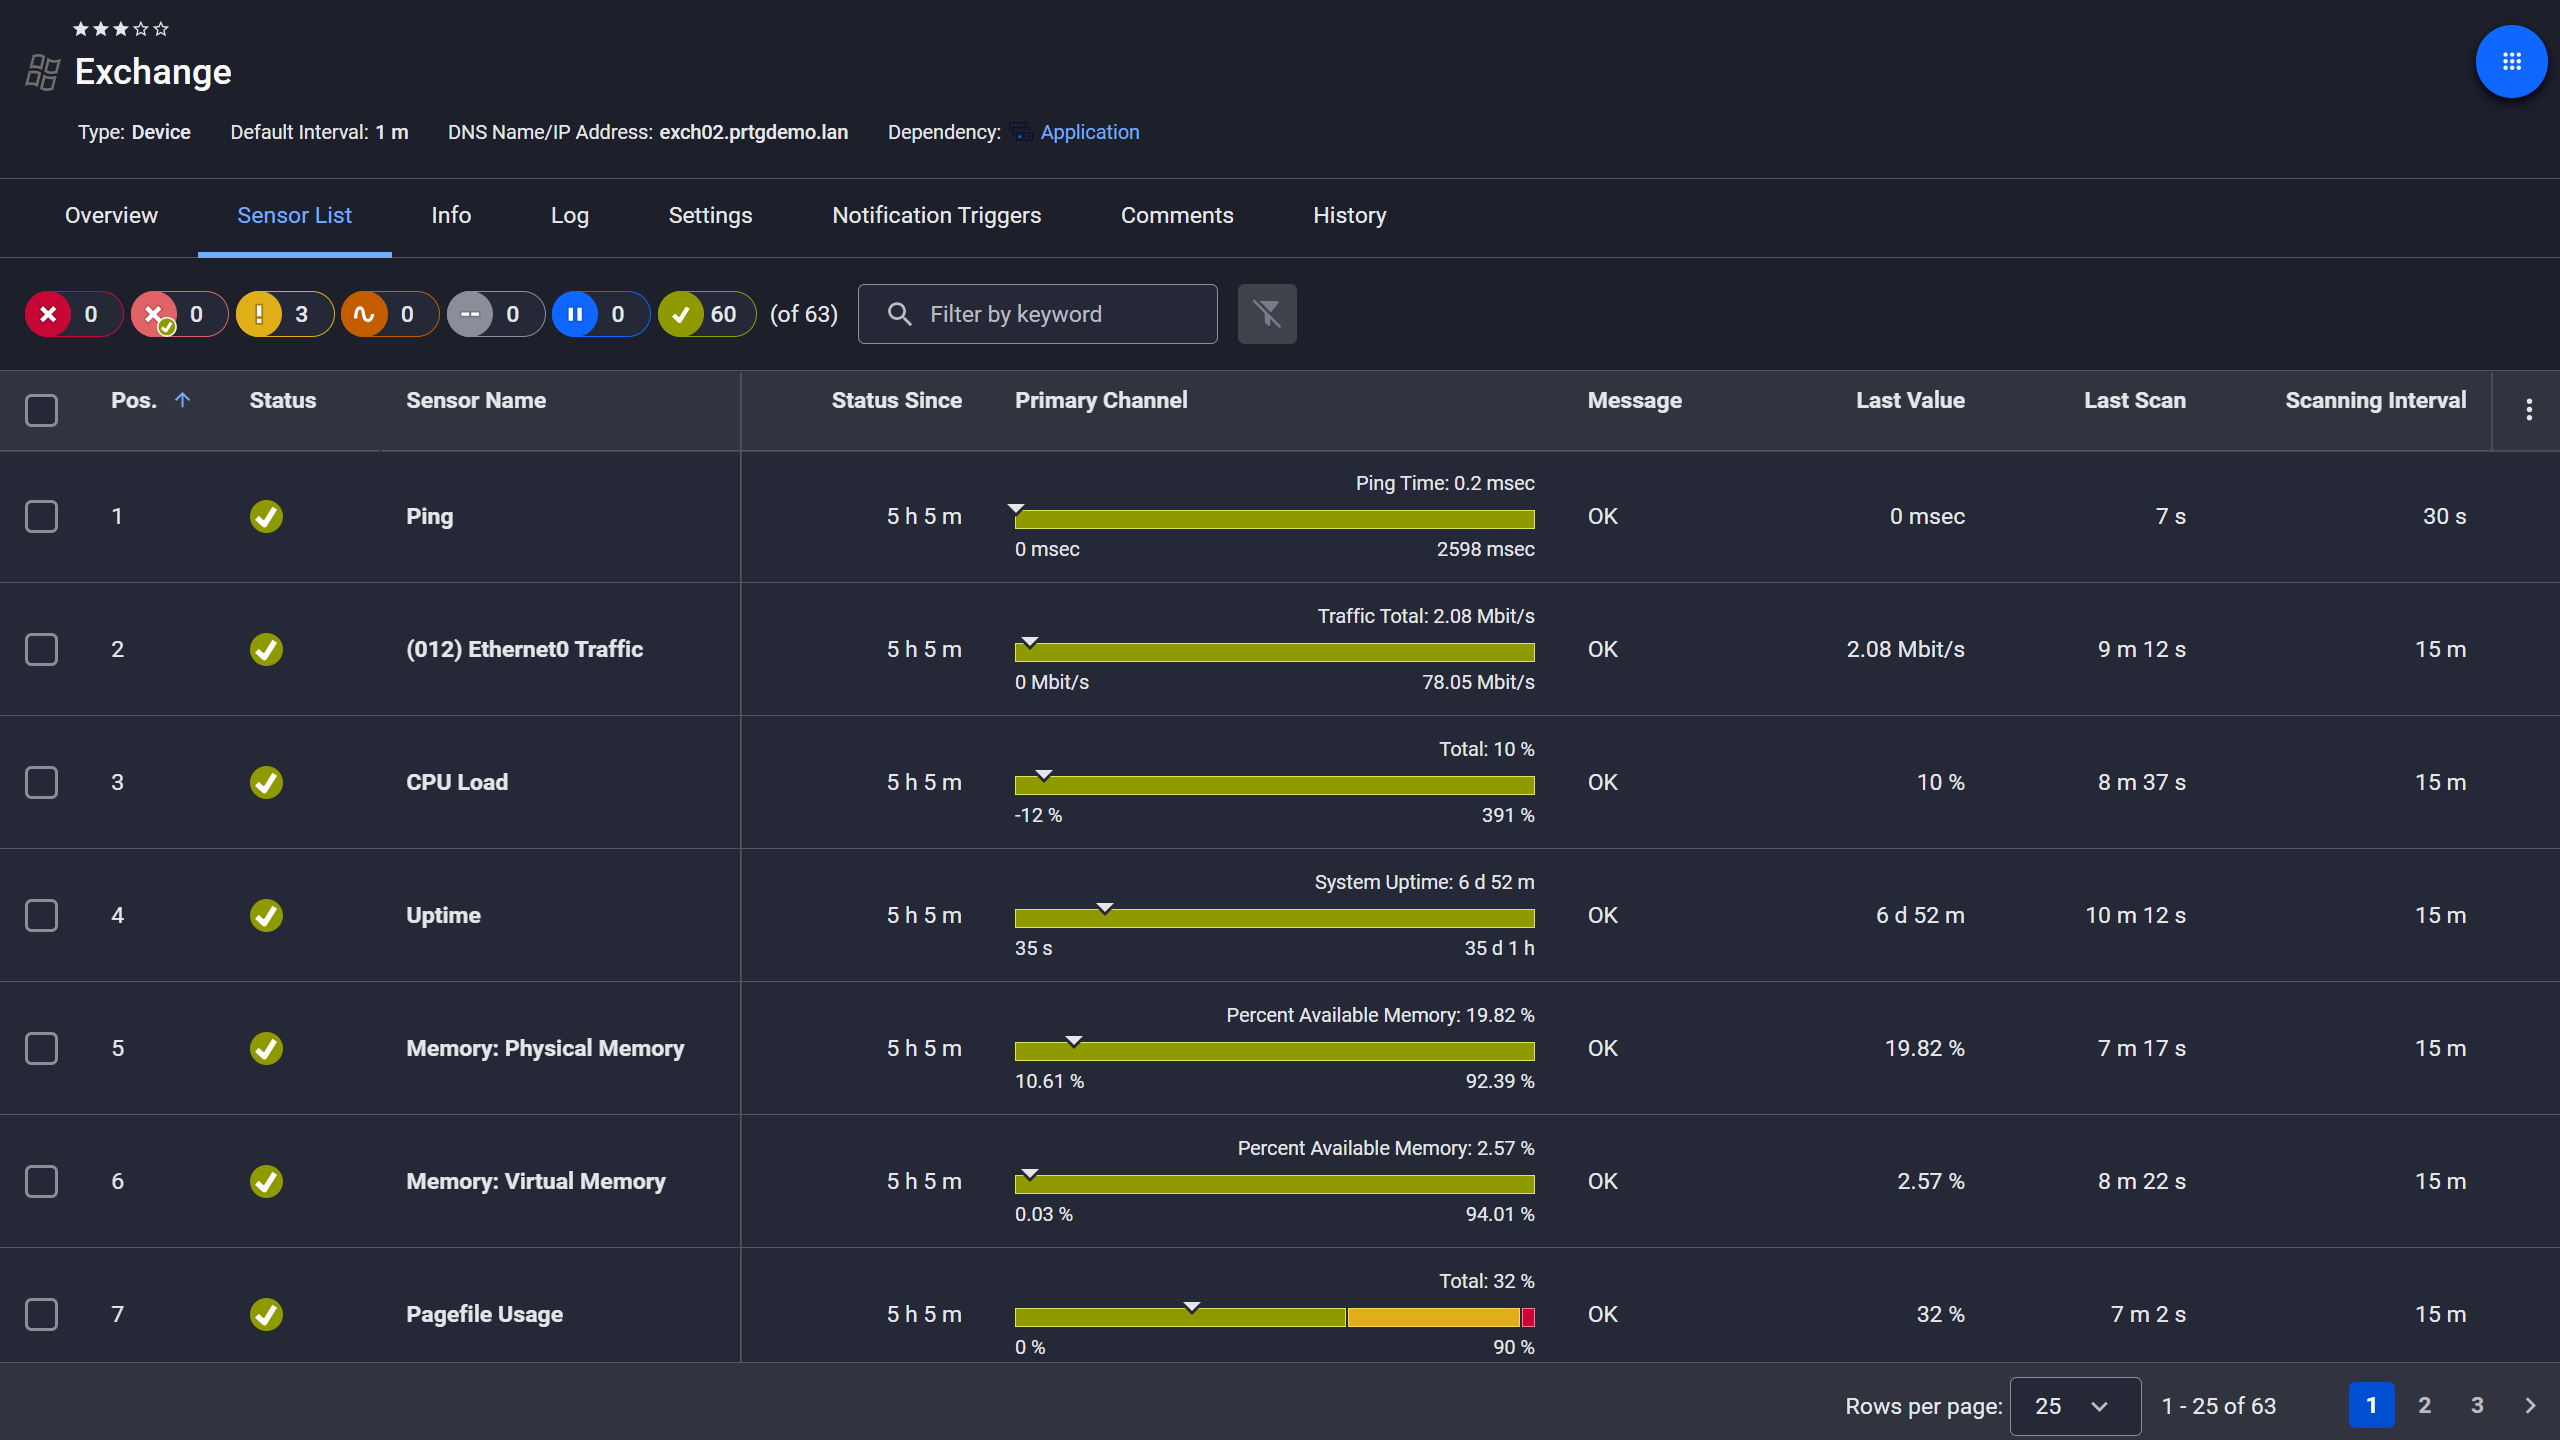
Exchange server, fully under control
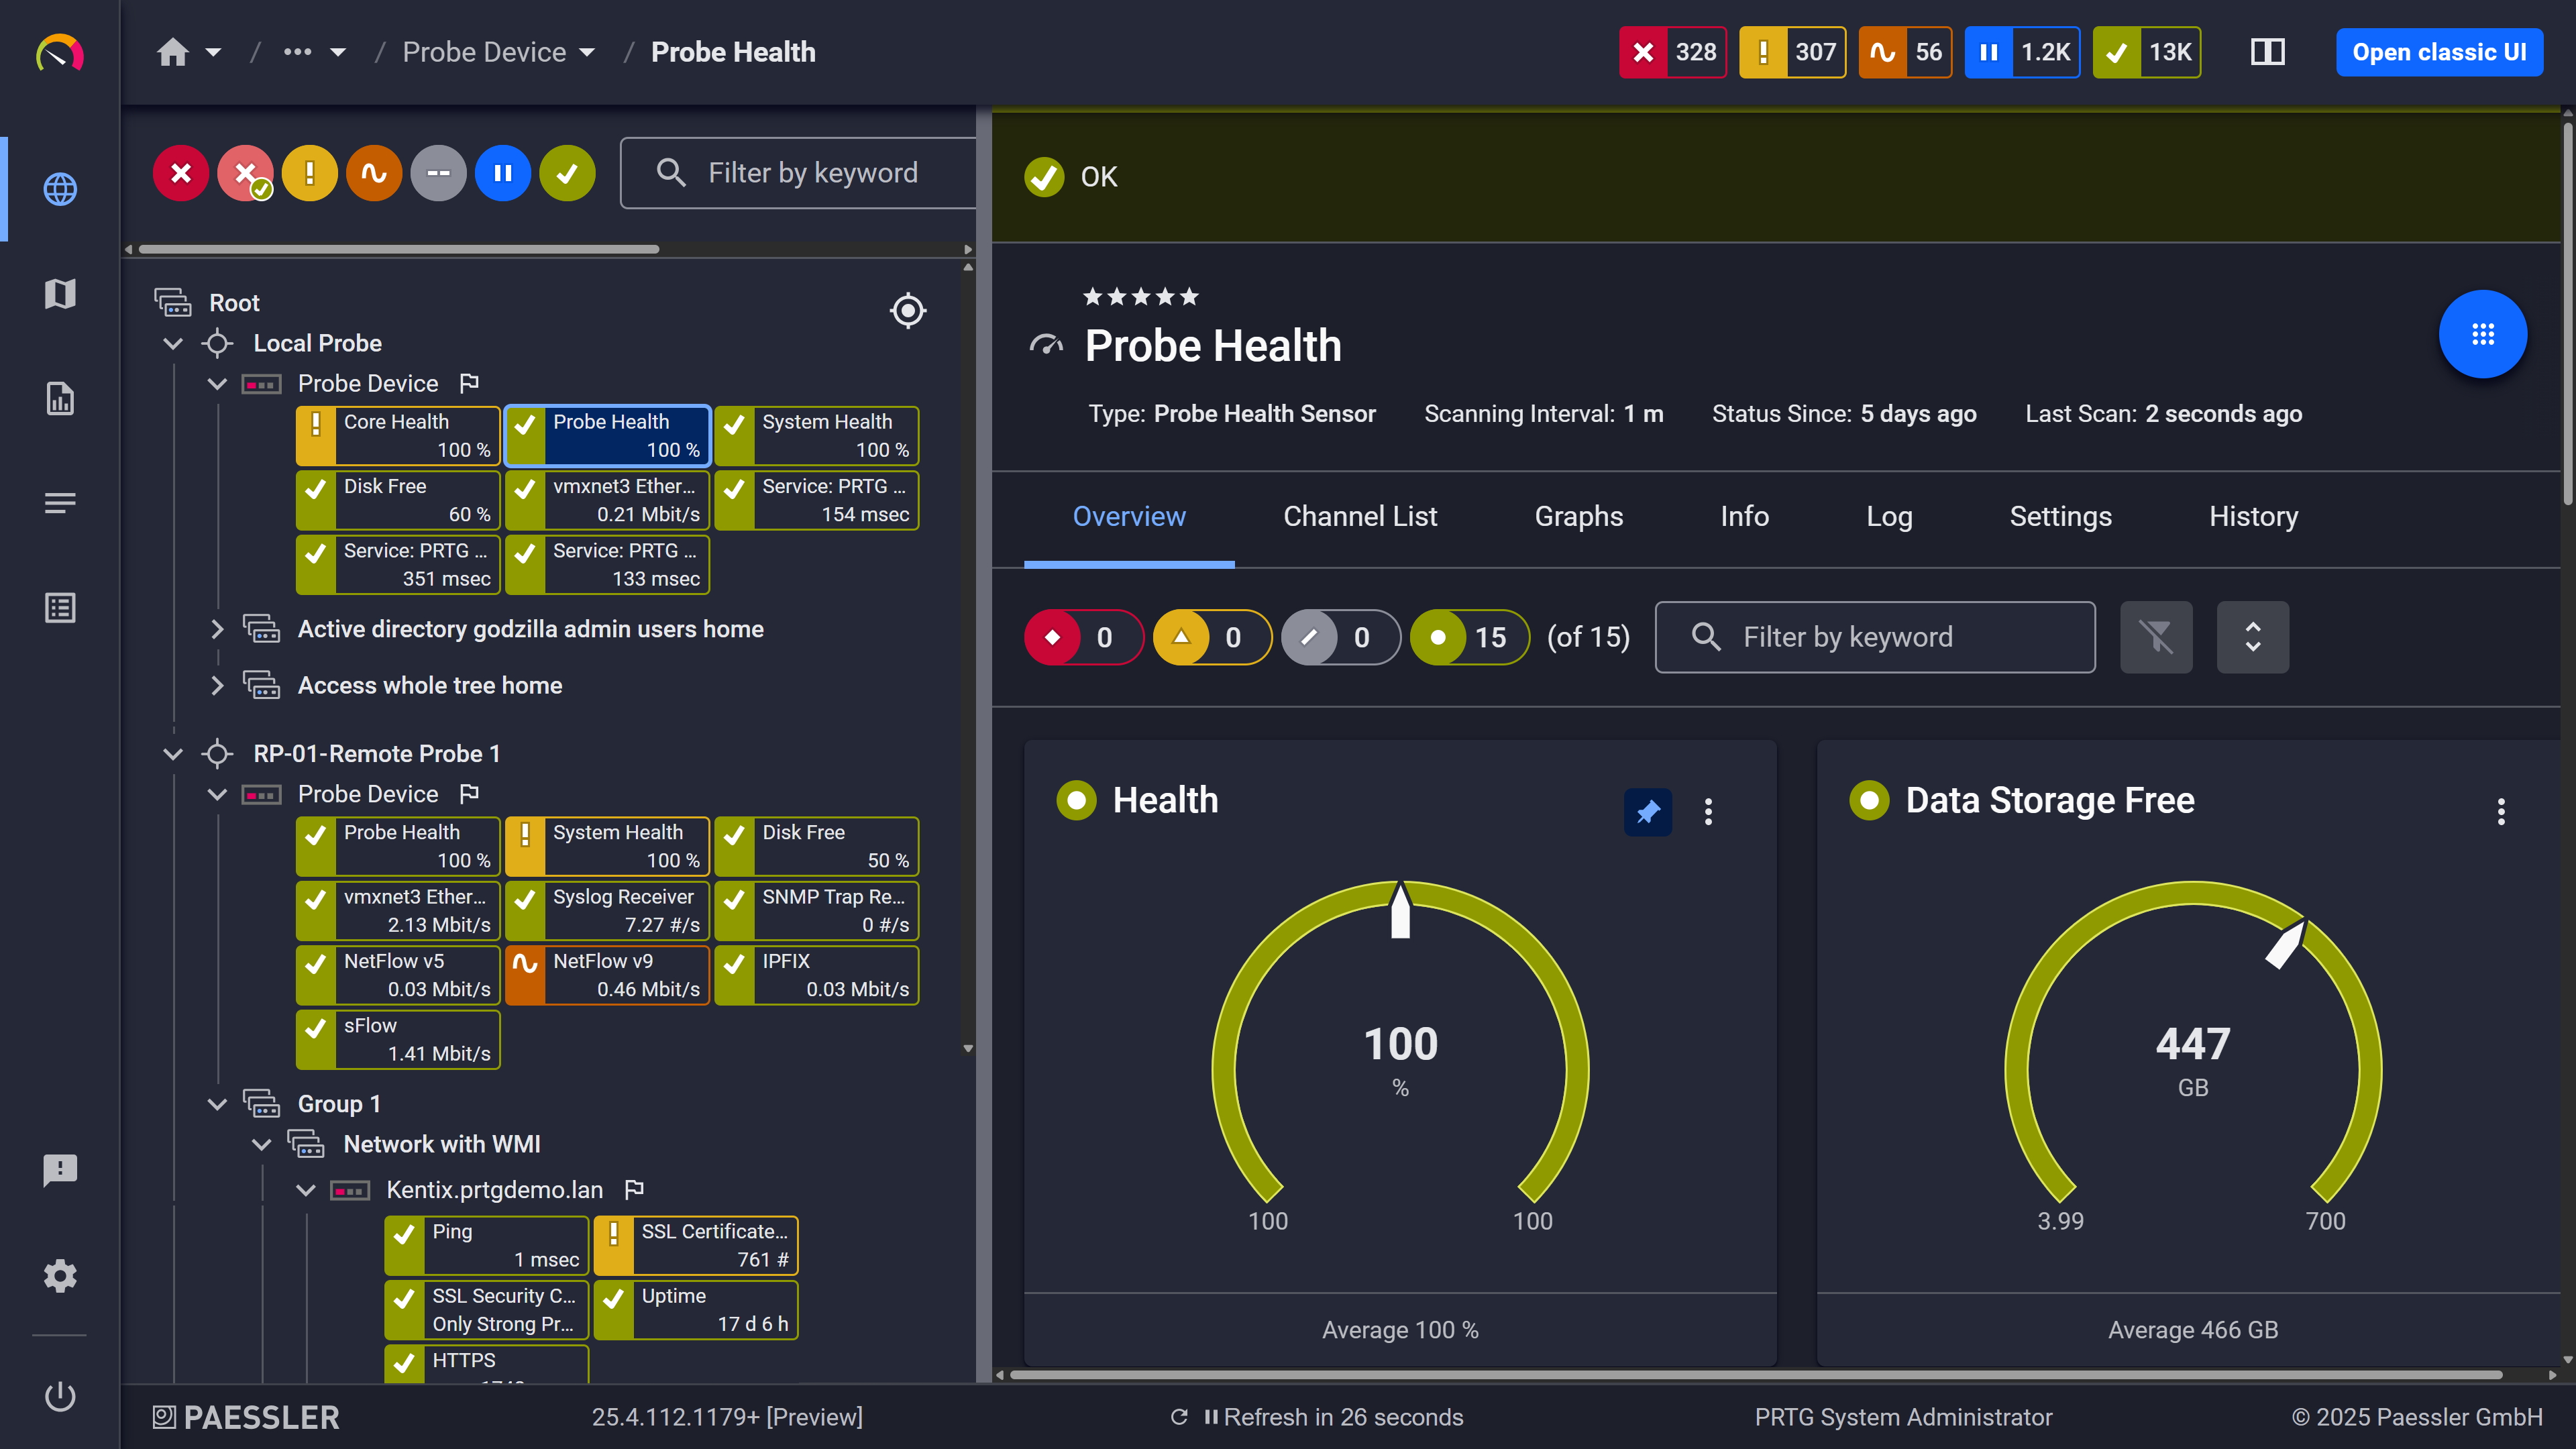
Probe health at a glance

Live graphs, real-time performance data
The Broker Service, StoreFront, or XML Service can stop while the server is still up and responding to ping. Users lose access, but nothing looks wrong from the outside. PRTG's WMI Service Monitor sensor checks whether specific Windows services are actually running, by name, and sends notifications the moment one stops or enters an unexpected state. Also useful: you can configure PRTG to attempt an automatic service restart on failure, so the system responds without waiting for someone to notice.
Start monitoring your infrastructure in minutes. No professional services, no complex configuration, no risk.
Citrix infrastructure isn't cheap, and decisions about adding capacity or resizing VMs are harder to justify when they're based on estimates. PRTG logs historical metrics automatically for every monitored sensor: host CPU trends, VM memory utilization over time, network load to your Citrix servers. No extra configuration. When it's time to back a resizing decision or document infrastructure performance, the data is already there.
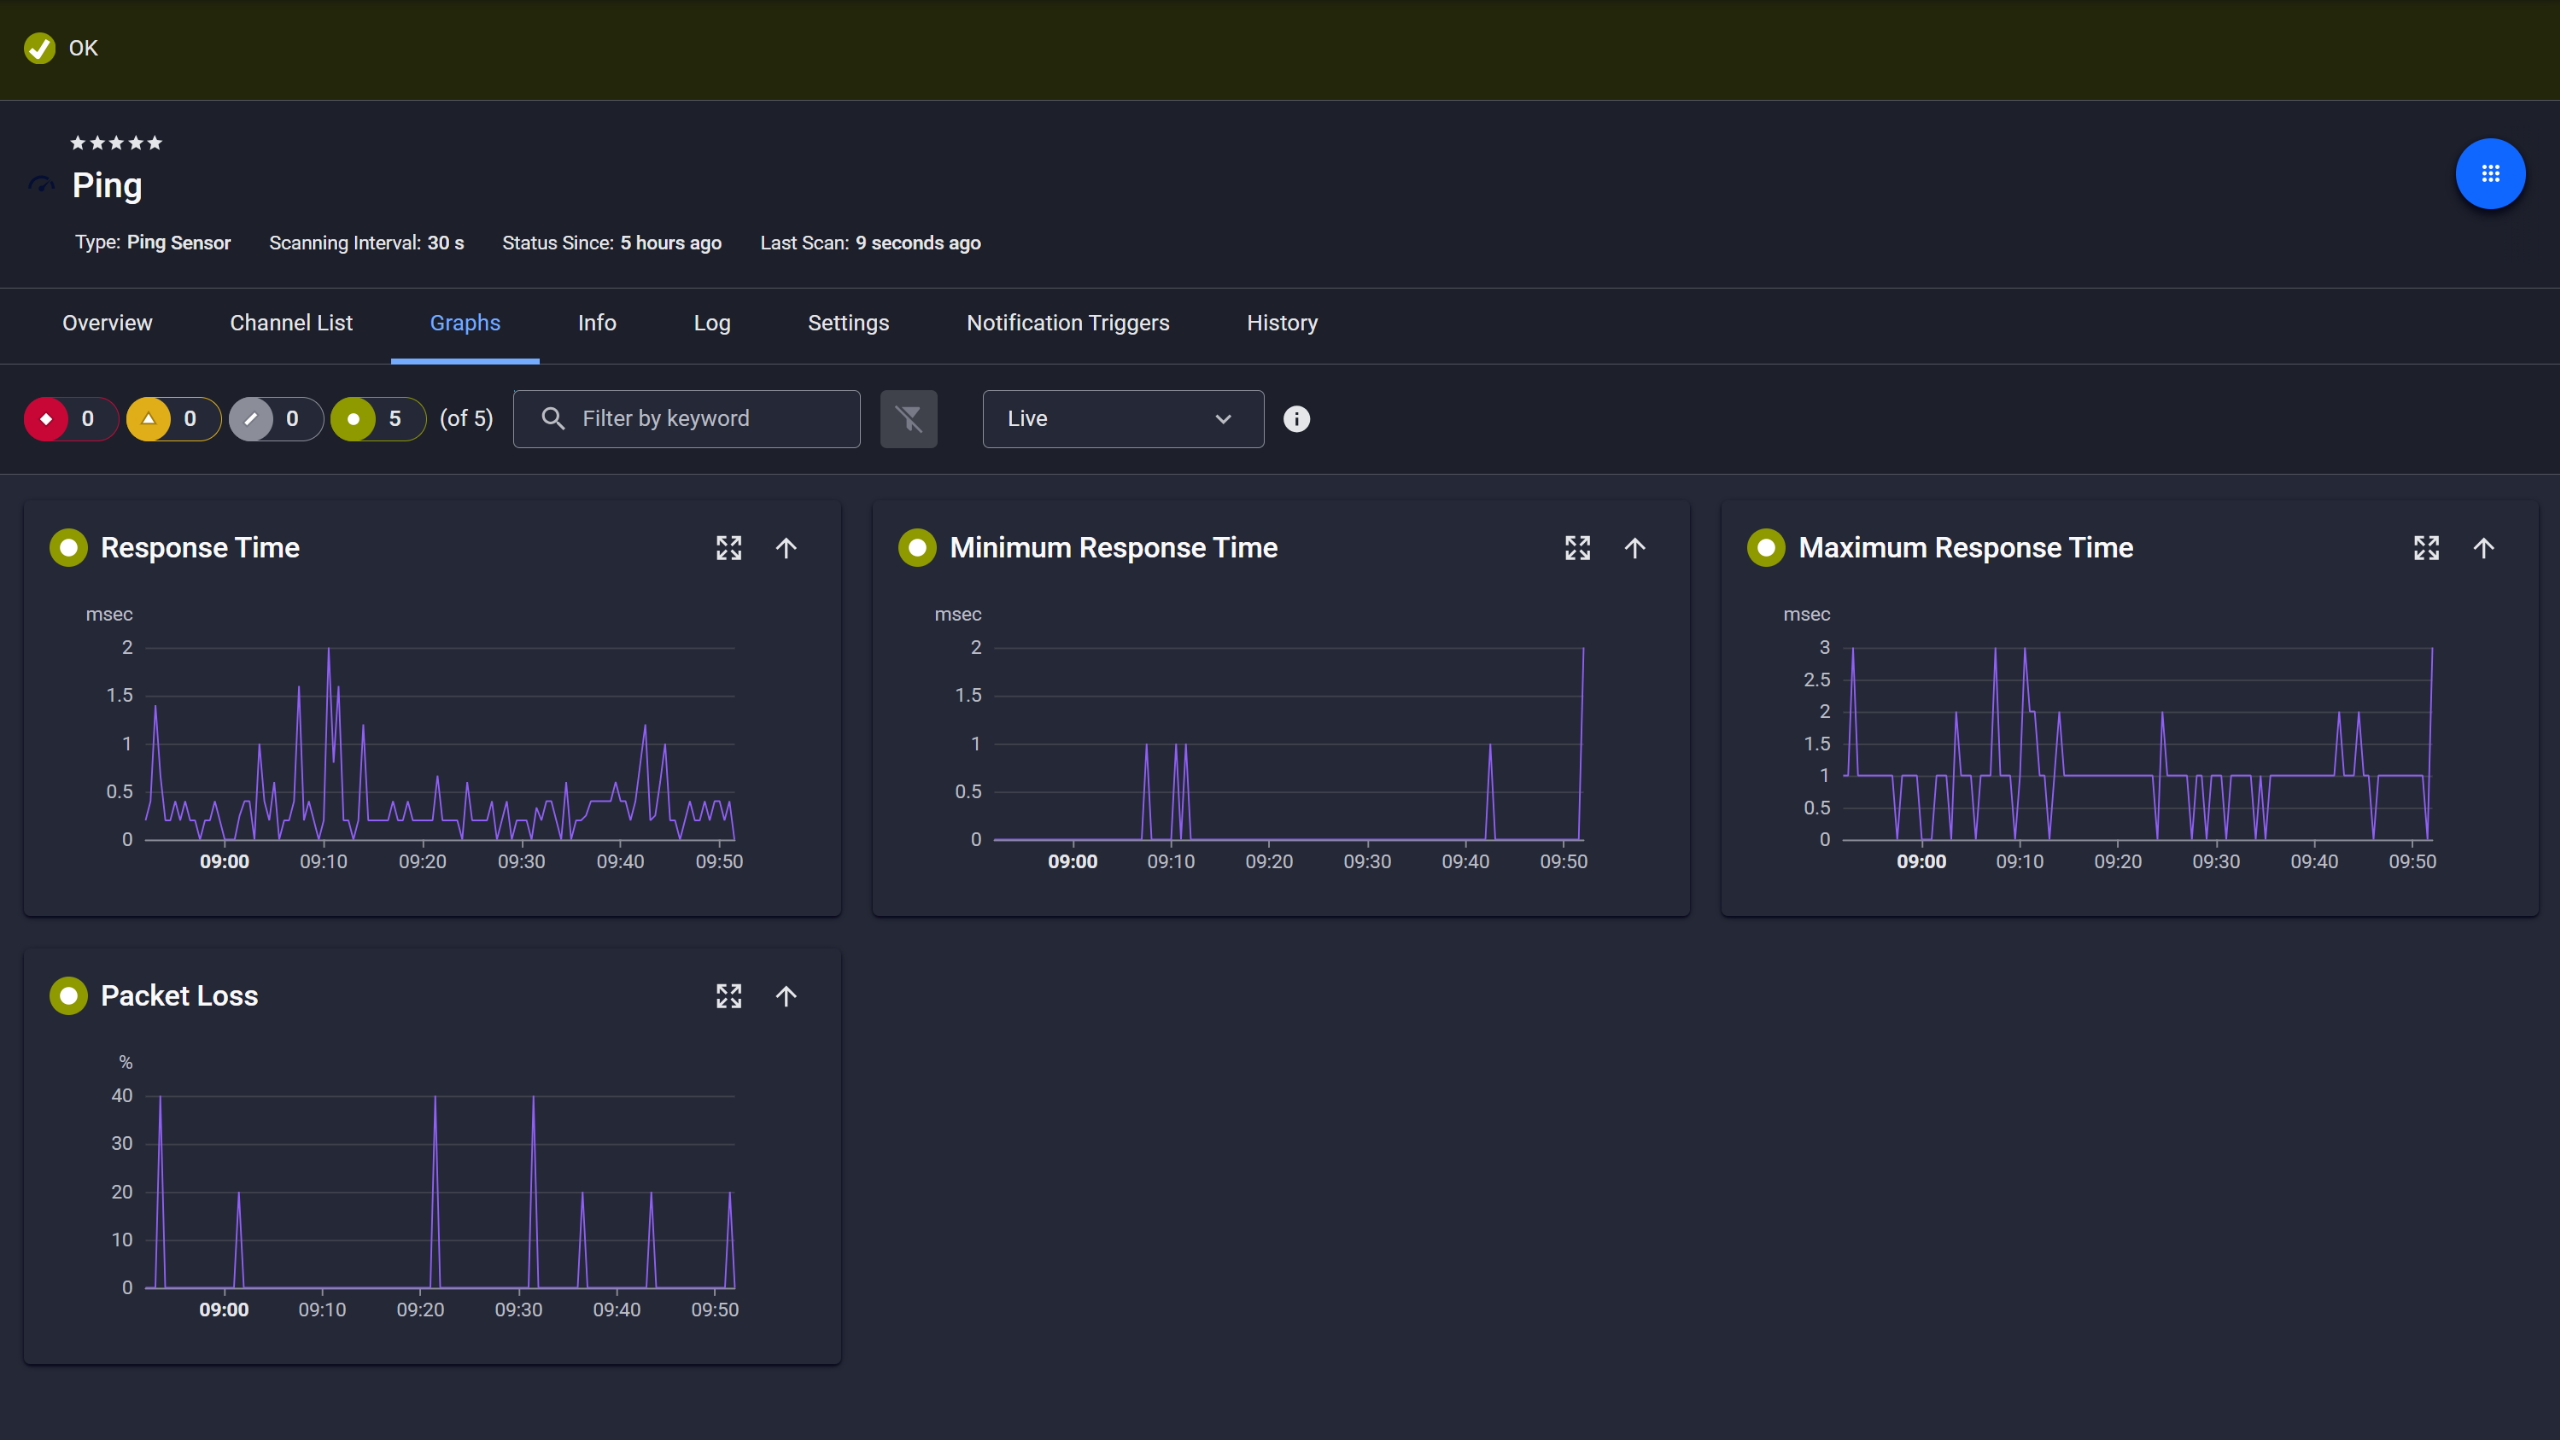
Ping response and packet loss
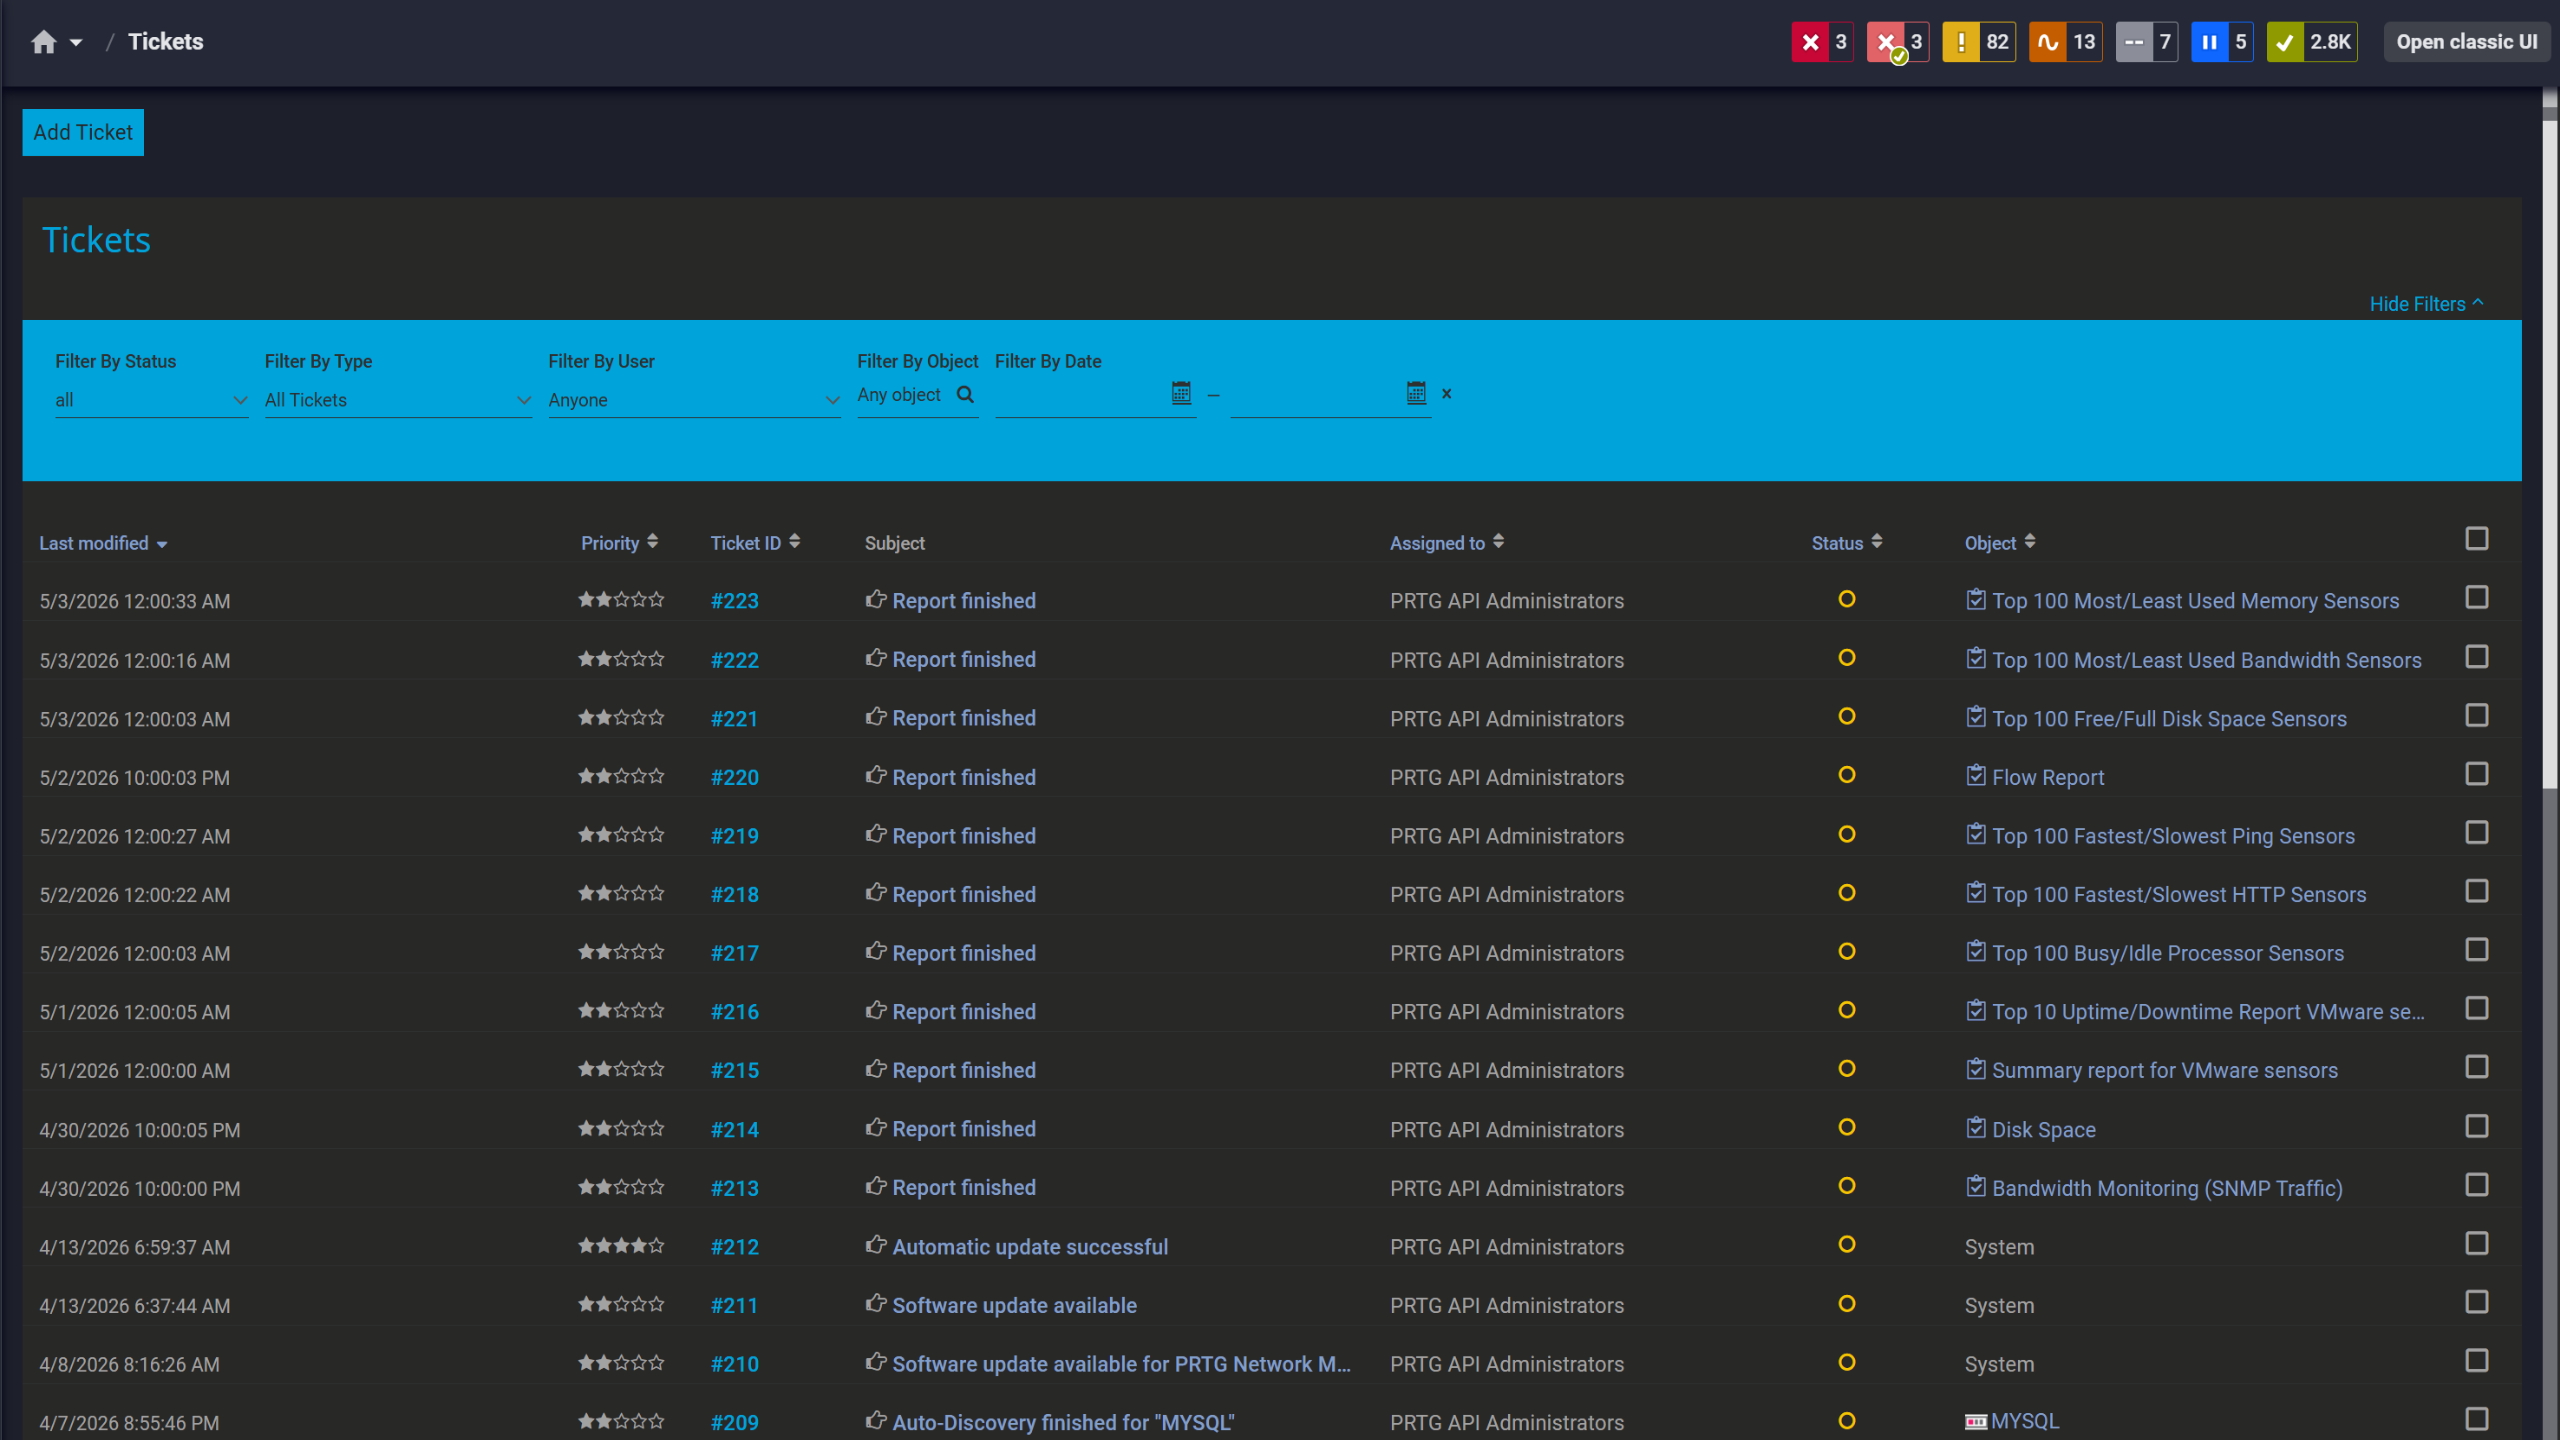
Tickets keep your team aligned

Full device list, instant overview
PRTG collects data from a Citrix environment using native sensors, standard protocols, and scripting support. Below are the main monitoring methods and what each one covers.
FEATURE | Without PRTG Without PRTG | With PRTG With PRTG |
|---|---|---|
XenServer host health | Without PRTG Manual checks or a separate tool | With PRTG Native sensor, continuous polling, threshold alerts |
Citrix service availability | Without PRTG Reactive, found out via user reports | With PRTG WMI Service Monitor sensor, alerted on state change |
Network and Citrix in one view | Without PRTG Two separate tools, manual correlation | With PRTG Single interface, same timeline |
Network and Citrix in one view | Without PRTG Manual collection or none | With PRTG Automatic, stored per sensor, graphed |
Alerts on infrastructure thresholds | Without PRTG None or manual | With PRTG Configurable thresholds, multi-channel notifications |
Choose the PRTG Network Monitor subscription that's best for you.
| License Name | License description | Price | License Details | Get started | Pricing Details | |
|---|---|---|---|---|---|---|
| PRTG 500 | $200 | per month paid annually | Buy nowBuy now | Enough to monitor multiple aspects of 50 devices | ||
| PRTG 1000 | $358 | per month paid annually | Buy nowBuy now | Enough to monitor multiple aspects of 100 devices | ||
| PRTG 2500 | $742 | per month paid annually | Buy nowBuy now | Enough to monitor multiple aspects of 250 devices | ||
| PRTG 5000 | $1,300 | per month paid annually | Buy nowBuy now | Enough to monitor multiple aspects of 500 devices | ||
| PRTG 10000 | $1,642 | per month paid annually | Buy nowBuy now | Enough to monitor multiple aspects of 1000 devices |

More than the virtualization layer. A complete setup includes the host servers running XenServer, the VMs on top of them, the Windows OS layer on Citrix components, critical services like the Broker Service and StoreFront, and the network the whole environment runs on. Citrix Director handles session-level data and end-user experience analytics. PRTG covers the host, VM, OS, and network layers that Director doesn't show.
PRTG's native Citrix sensors target XenServer hosts and virtual machines. In Citrix Virtual Apps and Desktops (CVAD) environments, Windows-based components including Delivery Controllers, virtual delivery agents (VDAs), StoreFront servers, and other Citrix XenApp-era infrastructure can be monitored via WMI for OS-level health: CPU, memory, disk, services, processes. Session brokering analytics, logon phase data, and delivery group metrics require Citrix Director. For Citrix DaaS running on cloud infrastructure, the Microsoft Azure Virtual Machine sensor covers cloud-hosted VMs, and remote probes extend PRTG's reach into distributed or hybrid environments.
Yes. On-premises Citrix components are monitored via a local or remote probe. Azure-hosted virtual machines are covered by the Microsoft Azure Virtual Machine sensor. For cloud-first setups, PRTG Hosted Monitor handles the monitoring infrastructure without requiring an on-premises installation. Hybrid environments with on-premises XenServer hosts alongside cloud-hosted desktops or endpoints are supported within a single PRTG instance. Citrix Cloud deployments and SaaS-delivered infrastructure are reachable through the same setup, depending on how access is configured.
PRTG covers the Citrix infrastructure layer and the network in the same interface. When a performance complaint comes in and the root cause isn't immediately clear, you can check host resource usage, VM health, and network device metrics side by side without switching tools. Historical sensor data helps narrow things down: you can see when a metric started degrading and check whether it lines up with a change on the host, the network, or somewhere else. For latency issues or application performance questions that trace back to session-level data, Citrix Director is the right complement.
No. Citrix Director is built for session-level observability: logon duration, ICA and HDX metrics, end-user experience data, session analytics. PRTG covers the infrastructure and network layers the Citrix environment depends on. Most teams use both. They address different layers, and they work well alongside each other.
Citrix NetScaler, now called Citrix ADC, can be monitored via SNMP for interface statistics and traffic data, and via HTTP sensors for basic availability checks. Native deep analytics for ADC-specific metrics like load balancing statistics or SSL session detail are not available without custom sensors. For infrastructure monitoring of the ADC as a network device, SNMP coverage works out of the box alongside the rest of your Citrix infrastructure monitoring setup.
Network Monitoring Software – Version 26.1.116.1532 (February 9th, 2026)
Download for Windows and cloud-based version PRTG Hosted Monitor available
English, German, Spanish, French, Portuguese, Dutch, Russian, Japanese, and Simplified Chinese
Network devices, bandwidth, servers, applications, virtual environments, remote systems, IoT, and more
Choose the PRTG Network Monitor subscription that's best for you


