Custom alerts and data visualization let you quickly identify and prevent potential issues before they actually happen.
Collect and store historical data that can inform your predictive maintenance strategy and decisions. This is vital since maintenance operations and predictive maintenance rely on solid data.
How PRTG helps:
Your proactive approach to maintenance needs a granular alerting system to ensure that the right teams are informed at the right time – not only when maintenance is due but also if there are unusual metrics that indicate a potential problem with a specific OT device or an entire production line.
How PRTG helps:
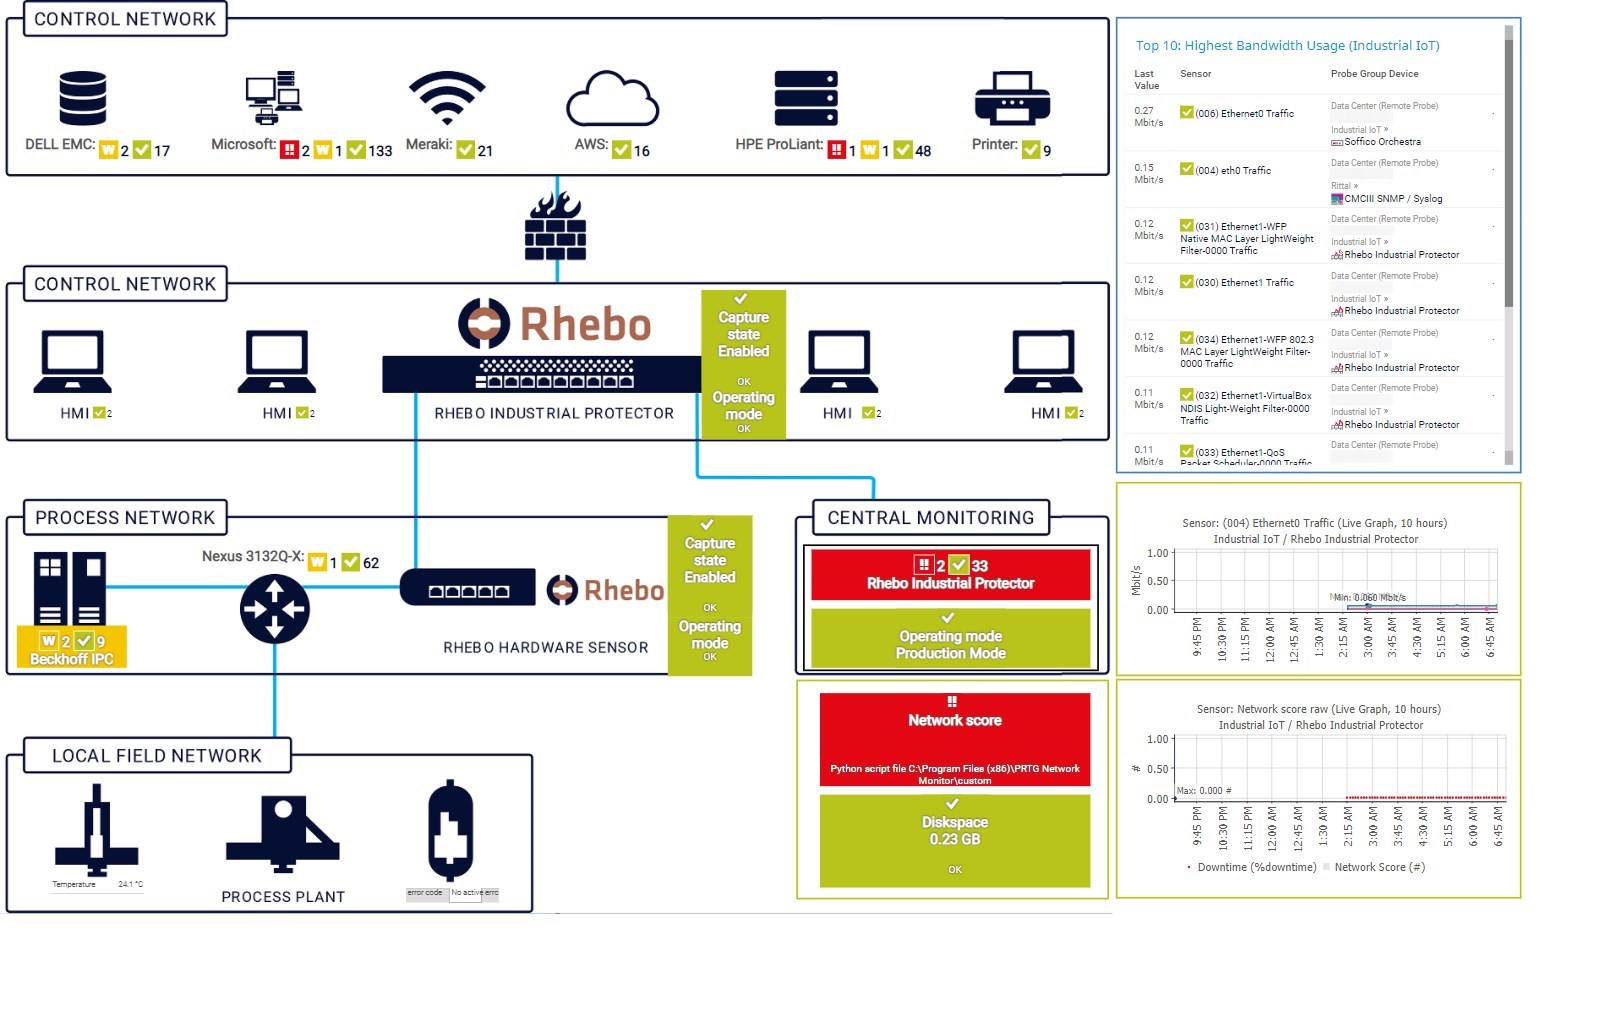
Diagnose network issues by continuously tracking IoT sensor data as well as your entire OT network. Show uptime, hardware health, equipment performance, maintenance processes, and other key metrics in real time. Visualize monitoring data in clear graphs and dashboards to identify problems more easily. Gain the overview you need to troubleshoot unplanned downtime, enhance the lifespan of your assets, and streamline workflows to enhance operational efficiency.

Device tree view of the complete monitoring setup
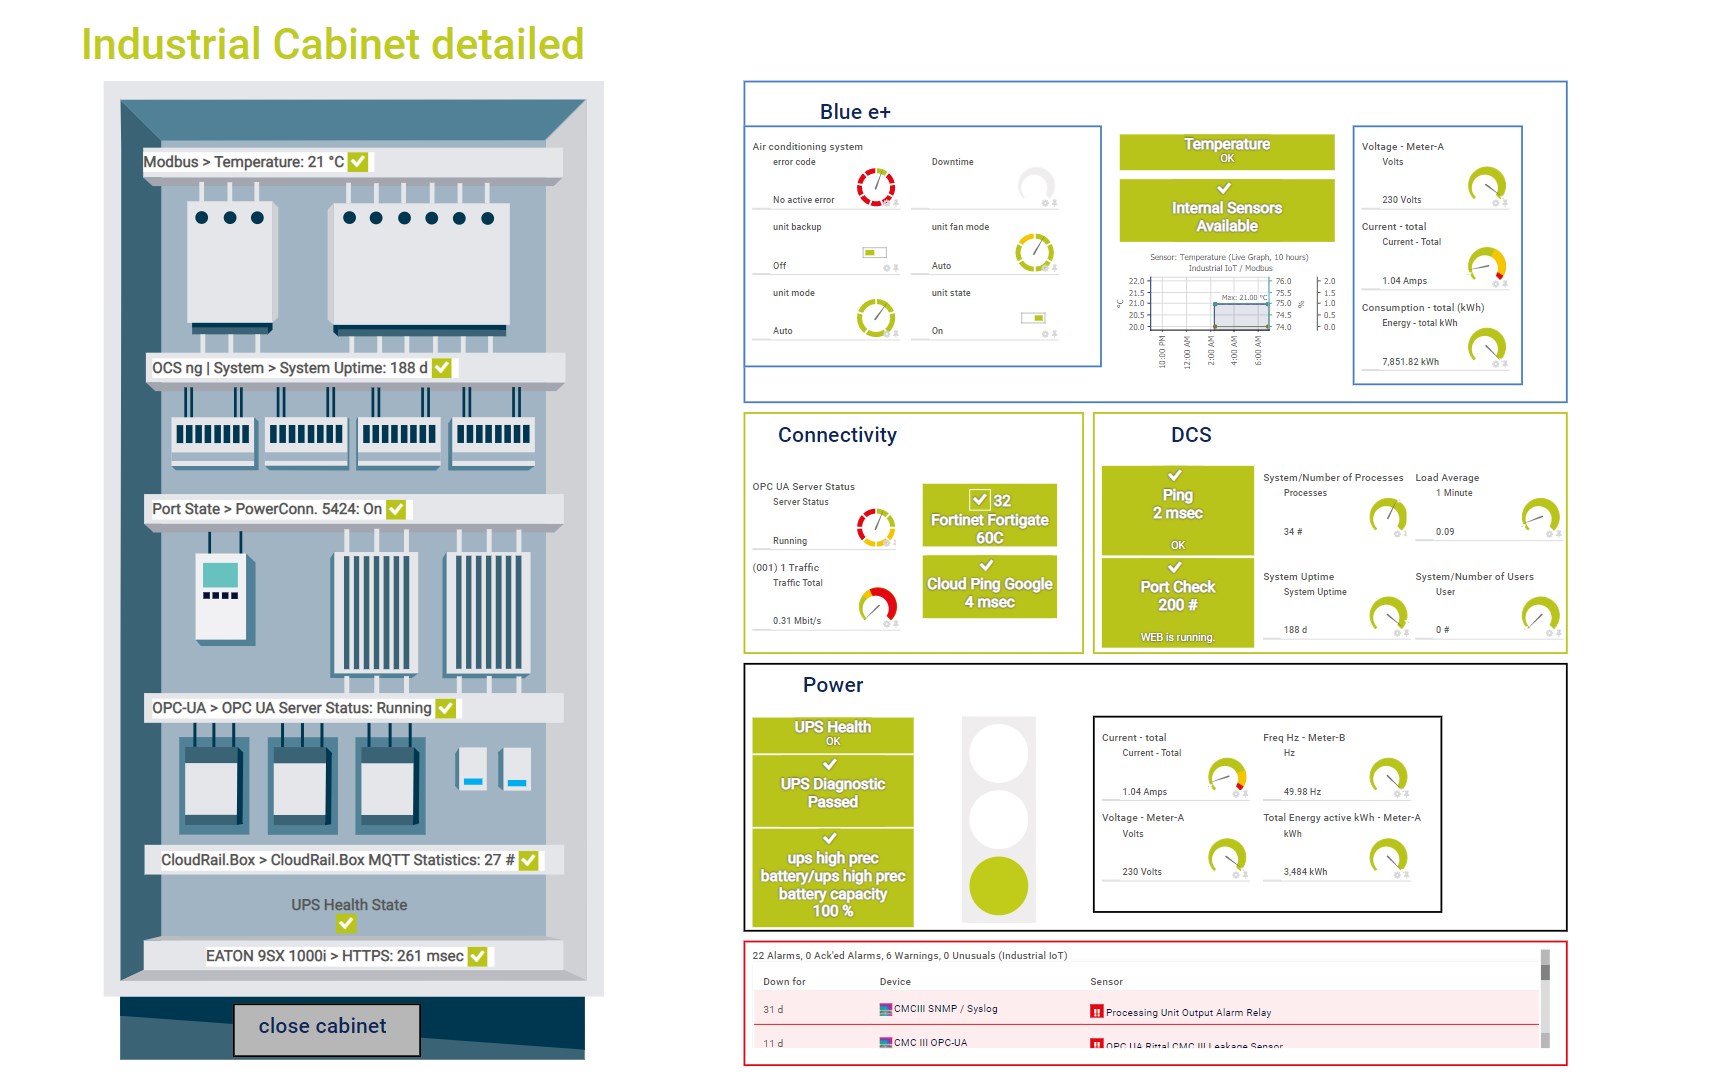
In-depth industrial cabinet monitoring, from environmental sensors to power health
Gain complete visibility and protect your critical industrial infrastructure with PRTG.

Custom PRTG dashboard for keeping an eye on the entire IT infrastructure

Live traffic data graph in PRTG
Awarded 3rd place in the
Software & IT category
Winner in the Software &
Computers category
While most maintenance maturity models focus on the equipment and machines on the factory floor, you must not forget the supporting IT/OT infrastructure. This includes the components that will collect real-time data about the production process and maintenance activities from the factory floor and transmit it to ERP systems or the cloud for analysis and processing. They form the basis of any OT maintenance strategy, and PRTG can help you monitor them.
IIoT (Industrial Internet of Things) sensors can make older machines “smart” (retrofitting), collect data analytics from the production line, monitor the health and performance of machines, regulate environmental conditions in the factory, and much more.
Monitor IIoT sensors to make sure they are functioning and transmitting data correctly.
Enclosures house important devices and systems, such as industrial Ethernet devices, UPS systems, and more.
Keep track of the state of the devices inside and of the enclosure itself using informative dashboards in PRTG.
PRTG comes with more than 250 native sensor types for monitoring your entire on-premises, cloud, and hybrid cloud environment out of the box. Check out some examples below!
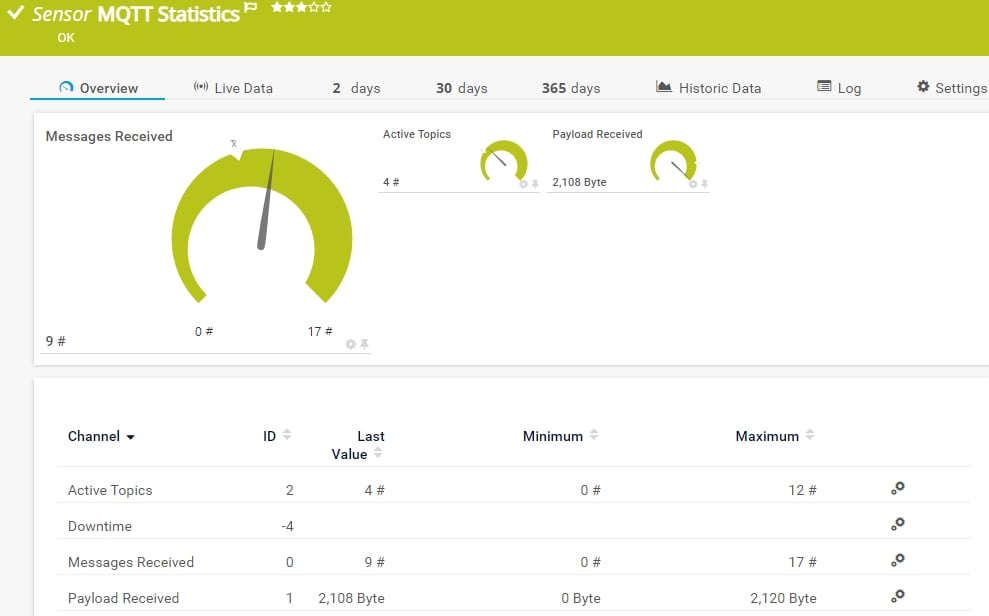
The MQTT Statistics sensor monitors a Message Queue Telemetry Transport (MQTT) topic. It can show the following:
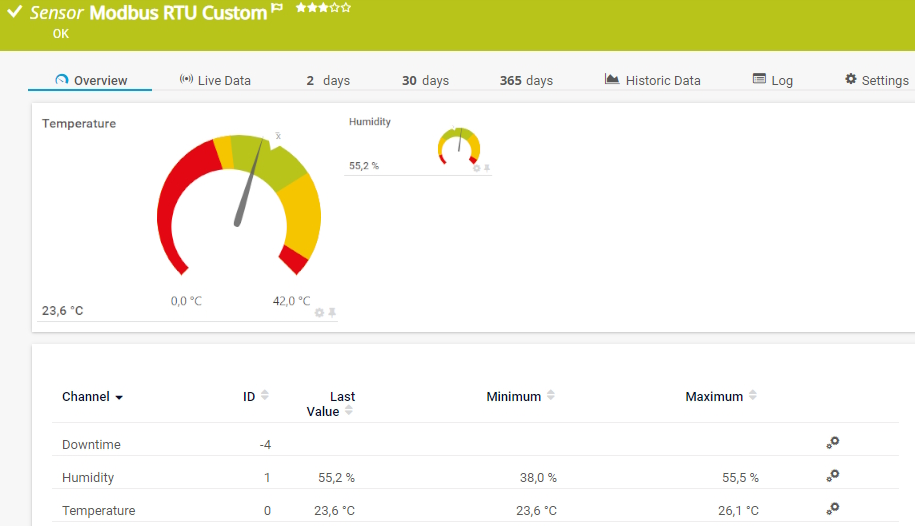
The Modbus RTU Custom sensor connects to a Modbus Remote Terminal Unit (RTU) server and monitors up to ten returned numeric values. It can show the following:
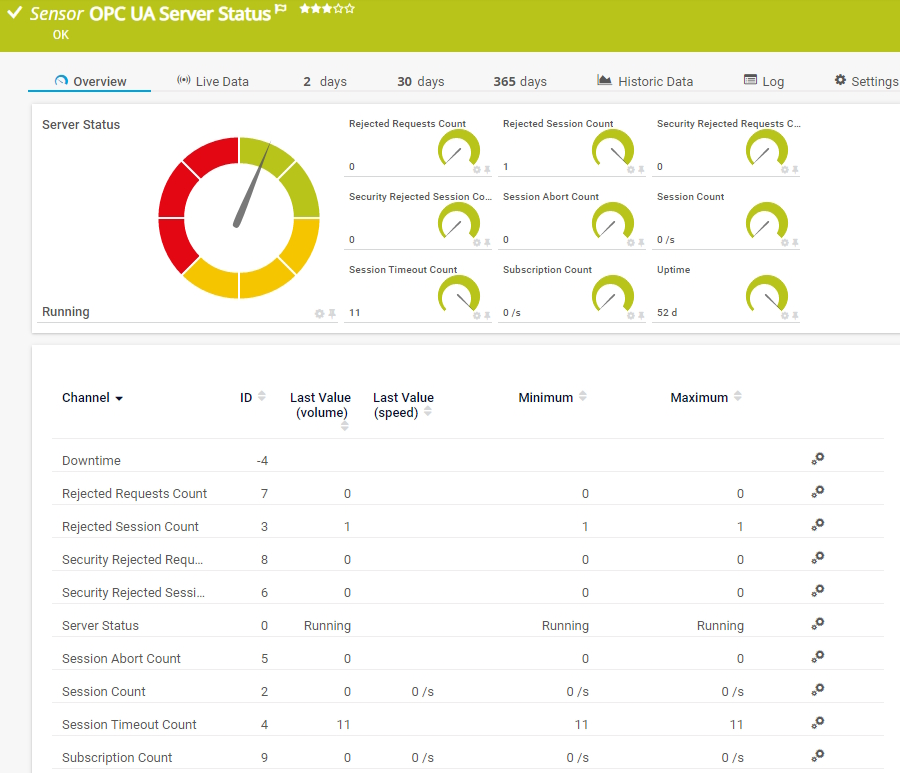
The OPC UA Server Status sensor monitors the server status, uptime, and diagnostic information of an OPC Unified Architecture (OPC UA) server. It can show the following:
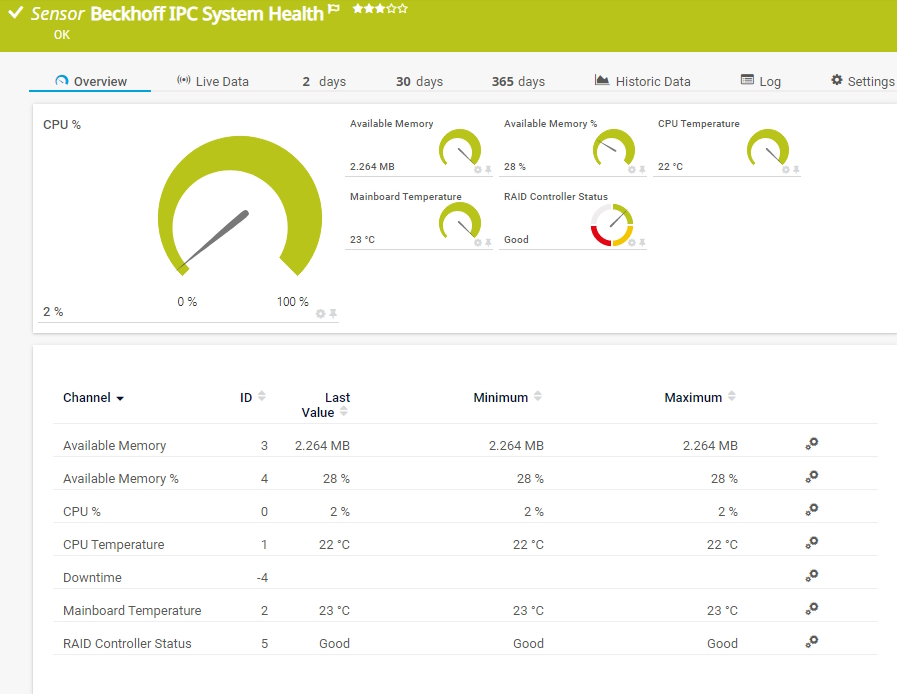
The Beckhoff IPC System Health sensor monitors the system health of a Beckhoff Industrial PC (IPC) via OPC Unified Architecture (OPC UA). It can show the following:
See the PRTG Manual for a list of all available sensor types.

Custom alerts and data visualization let you quickly identify and prevent potential issues before they actually happen.
PRTG is set up in a matter of minutes and can be used on a wide variety of mobile devices.


“Excellent tool for detailed monitoring. Alarms and notifications work greatly. Equipment addition is straight forward and server initial setup is very easy. ...feel safe to purchase it if you intend to monitor a large networking landscape.”
Partnering with innovative IT vendors, Paessler unleashes synergies to create
new and additional benefits for joined customers.
With condition monitoring and retrofitting, PRTG and Schildknecht DATAEAGLE make even older production plants competitive.
Moxa is a leading manufacturer of network devices for industrial environments. Together, MXview and PRTG allow for the monitoring of industrial ethernets.
With the combination of PRTG and Insys, the monitoring specialist Paessler and the industrial gateway manufacturer INSYS icom offer a practical possibility to merge IT and OT.
Real-time notifications mean faster troubleshooting so that you can act before more serious issues occur.
Network Monitoring Software – Version 26.1.116.1532 (February 9th, 2026)
Download for Windows and cloud-based version PRTG Hosted Monitor available
English, German, Spanish, French, Portuguese, Dutch, Russian, Japanese, and Simplified Chinese
Network devices, bandwidth, servers, applications, virtual environments, remote systems, IoT, and more
Choose the PRTG Network Monitor subscription that's best for you


Predictive maintenance is a proactive maintenance strategy that uses data analysis and predictive modeling techniques to predict when equipment or machinery is likely to fail. By monitoring various parameters and indicators, such as temperature, vibration, pressure, or performance metrics, predictive maintenance aims to detect potential issues and address them before they cause a breakdown or failure.
If you want to get more deep-dive information on predictive maintenance, read our IT Explained article.
There are several types of predictive maintenance techniques that organizations can employ based on their specific needs and the nature of their equipment. Here are some common types of predictive maintenance:
In industrial IT and IIoT, the so-called maintenance maturity model provides guidelines for organizations to move from reactive maintenance strategies toward data-driven proactive maintenance strategies. The reason? Reactive strategies cost more. Each step up in the maintenance maturity model brings its own time and cost savings.
Predictive maintenance software refers to computer-based applications or platforms that facilitate the implementation and management of predictive maintenance programs. These software solutions leverage data analysis, machine learning, and advanced algorithms to monitor equipment health, detect anomalies, and predict failures.
Predictive maintenance software can be tailored to specific industries, equipment types, or maintenance strategies. It enables organizations to implement and optimize their predictive maintenance strategies effectively, enhance equipment reliability, and reduce maintenance costs by moving from reactive to proactive maintenance practices.
Predictive maintenance and monitoring tools are related but distinct concepts in the realm of maintenance and asset management. While both involve the use of technology and data analysis, there are key differences between them.
Predictive maintenance is a comprehensive strategy that involves data analysis, modeling, and proactive maintenance planning based on predicted failures.
Monitoring tools, on the other hand, focus on real-time or periodic data monitoring to provide visibility into equipment health and performance for immediate or near-term actions. While predictive maintenance can utilize monitoring tools as a component of its overall approach, monitoring tools themselves do not necessarily incorporate the predictive modeling and analysis aspects of predictive maintenance.
In PRTG, “sensors” are the basic monitoring elements. One sensor usually monitors one measured value in your network, for example the traffic of a switch port, the CPU load of a server, or the free space on a disk drive. On average, you need about 5-10 sensors per device or one sensor per switch port.
Paessler conducted trials in over 600 IT departments worldwide to tune its network monitoring software closer to the needs of sysadmins. The result of the survey: over 95% of the participants would recommend PRTG – or already have.

Paessler PRTG is used by companies of all sizes. Sysadmins love PRTG because it makes their job a whole lot easier.
Bandwidth, servers, virtual environments, websites, VoIP services – PRTG keeps an eye on your entire network.
Everyone has different monitoring needs. That’s why we let you try PRTG for free.