Custom alerts and data visualization let you quickly identify and prevent cloud-related infrastructure issues.
Do you use cloud computing services in a variety of locations worldwide? Now you can check service accessibility and performance from your own location with Paessler PRTG’s Cloud HTTP v2 sensor.
It monitors the loading time of a web server from locations in Asia, Europe, and the USA, so you can determine your web service’s response times from all over the world.
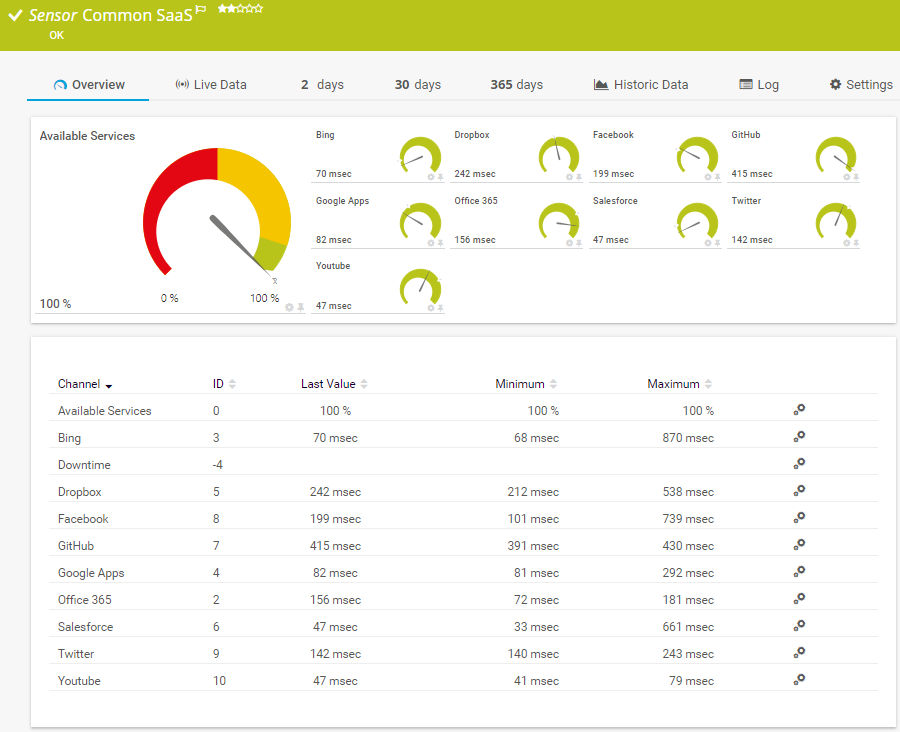
Or do you want to keep an eye on the availability of your software as a service provider? Then our common SaaS sensor has got you covered. It monitors the response times of several SaaS providers, for example Dropbox, GitHub, Google Apps, or Office 365.
Whether you’re running your own services on-premises or relying on global-scale service providers, PRTG’s Cloud Ping v2 Sensor can check the TCP ping response times of your devices from multiple locations around the world, for example, from the Asia-Pacific region, Europe, or the USA.
PRTG accesses the Amazon CloudWatch API, retrieves the data from every AWS account, and makes it centrally available. This makes PRTG the best choice for monitoring many different AWS accounts without having to constantly jump from one account to another.
PRTG comes with preconfigured AWS sensors out-of-the-box:
If you use cloud computing services from Microsoft like Azure or Microsoft 365, PRTG has got you covered as well:
Diagnose network issues by continuously tracking the status, cost, and availability of your cloud services. Show cloud application monitoring stats, bandwidth bottlenecks, uptime, and other key performance metrics in real time. Visualize monitoring data in clear graphs and dashboards to identify problems more easily. Gain the overview you need to troubleshoot the root causes of issues with your private cloud, public cloud, and multicloud environments.
IT infrastructure map in PRTG

Device tree view of the complete monitoring setup

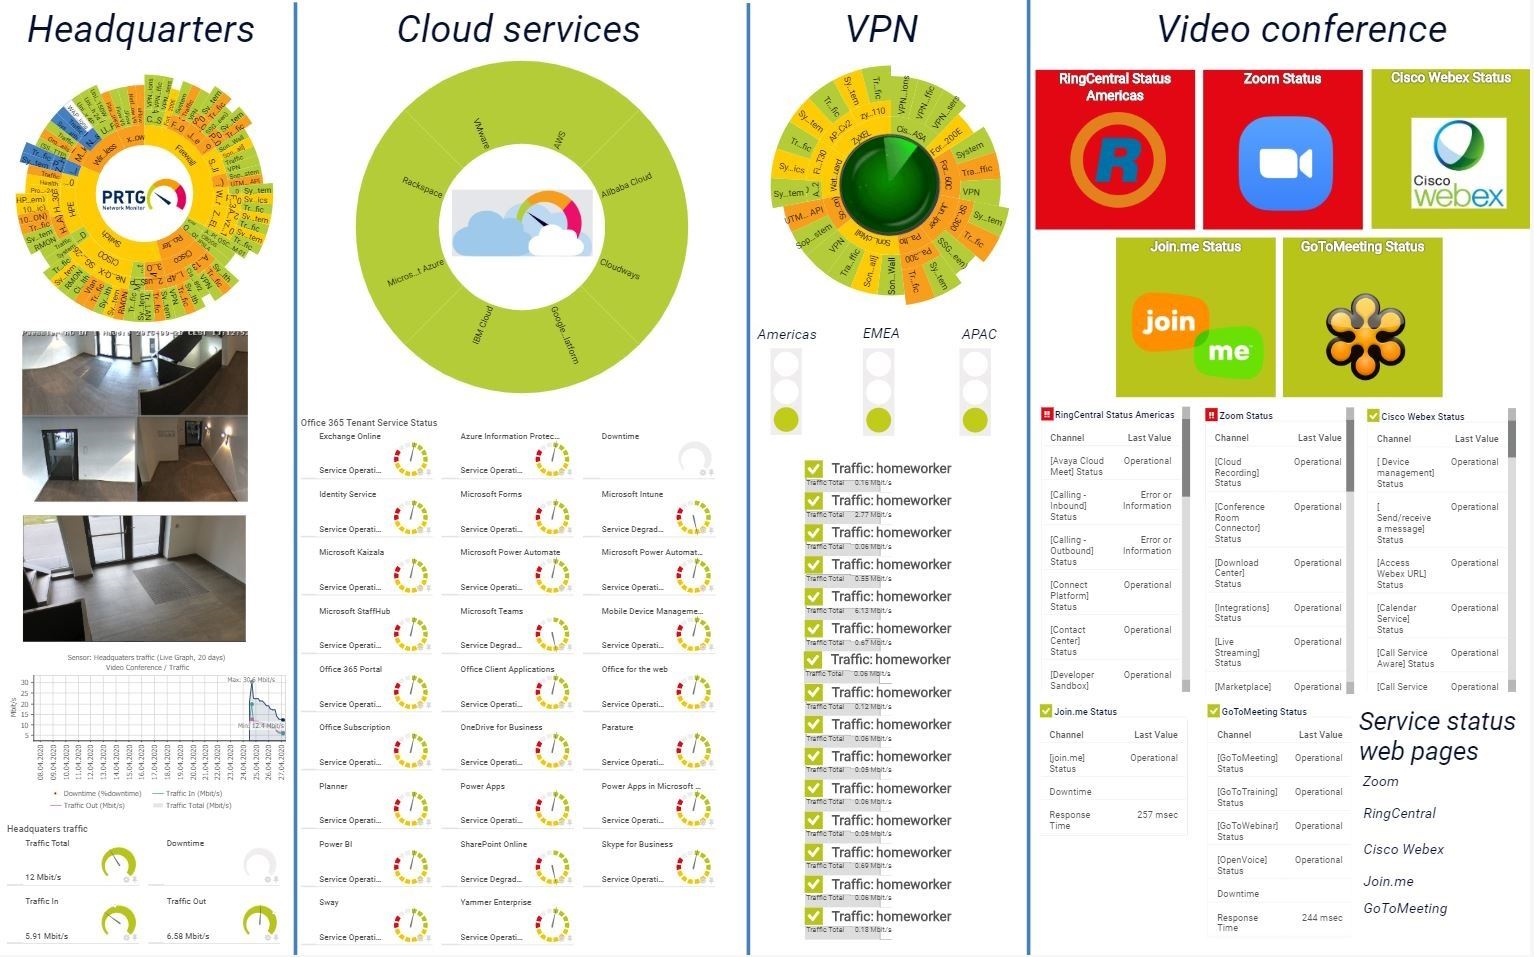
Custom PRTG dashboard for keeping an eye on the entire IT infrastructure
“All-around winning
network monitor”
“The real beauty of PRTG is the endless possibilities it offers”
“PRTG Network Monitor
is very hard to beat”
If you use cloud computing services such as AWS, Microsoft Azure, or Google Cloud, and need a comprehensive cloud monitoring tool, then PRTG makes sense for you.
Why? While Amazon offers its own CloudWatch solution for monitoring, for example, your IT department will often have separate accounts for different providers and services, which won’t be covered by CloudWatch.
With PRTG, all accounts from all IaaSs are monitored centrally. PRTG is a comprehensive cloud monitoring tool using a single pane of glass that you can read at a quick glance.
Many specialized departments require specific software for their work, software which is often only offered as a SaaS solution. Also, many companies are switching to services such as Microsoft 365. In fact, many email services are also cloud-based solutions.
In this case, an independent cloud monitoring software also makes sense. Why? As with IaaS, PRTG offers comprehensive cloud application monitoring that is easy and quick to configure.
Several PaaS services provide an environment for developers. These services can be used without any major administrative hassles or costly acquisition fees.
Here, too, a cloud monitoring platform makes sense. Why? Development work is highly sensitive, and system failures will incur high costs – especially when it’s not clear where the problem lies.
With PRTG, administrators instantly have everything in check and can immediately tell if issues result from the PaaS system, a malfunctioning router, or from somewhere completely different.
PRTG comes with more than 250 native sensor types for monitoring your entire on-premises, cloud, and hybrid cloud environment out of the box. Check out some examples below!
The Common SaaS sensor monitors the availability of several Software-as-a-Service (SaaS) providers. It can show the following:
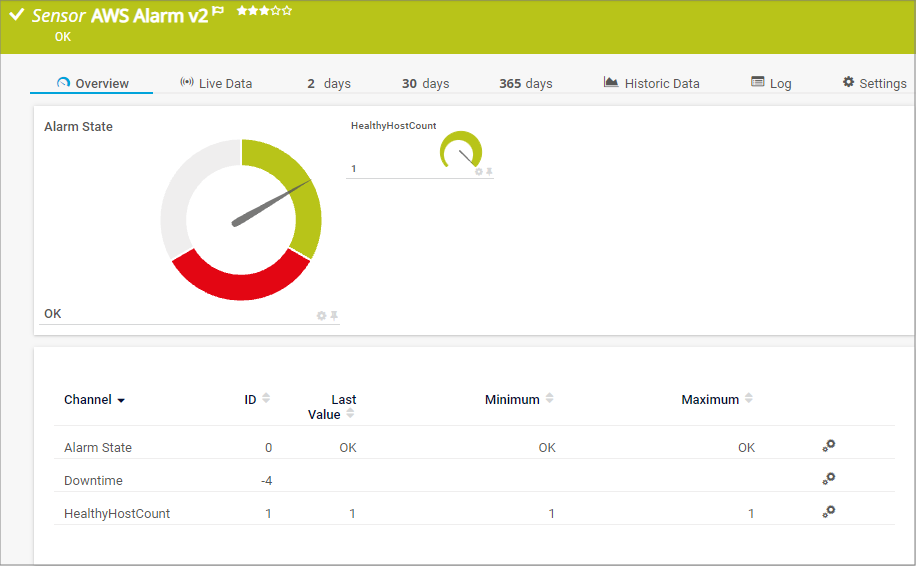
The AWS Alarm v2 sensor monitors the status of an Amazon Web Services (AWS) alarm by reading its data from Amazon CloudWatch via the AWS API. It can show the following:
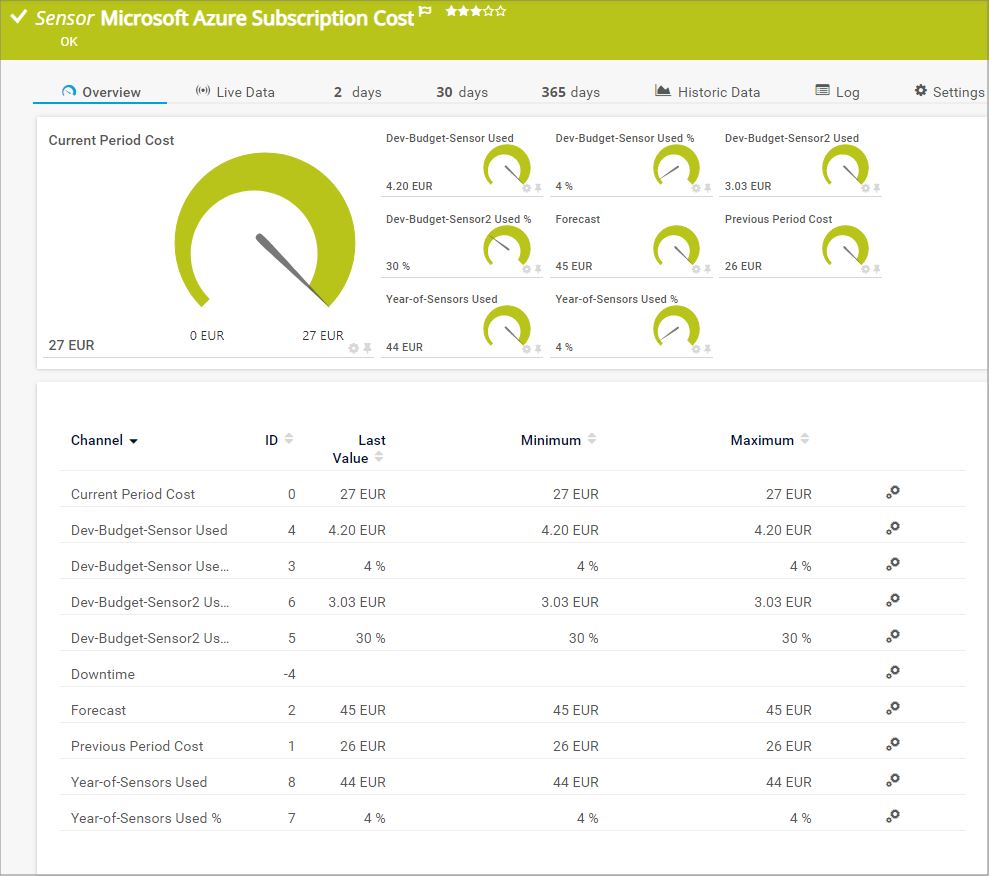
The Microsoft Azure Subscription Cost sensor monitors the cost in a Microsoft Azure subscription. It can show the following:
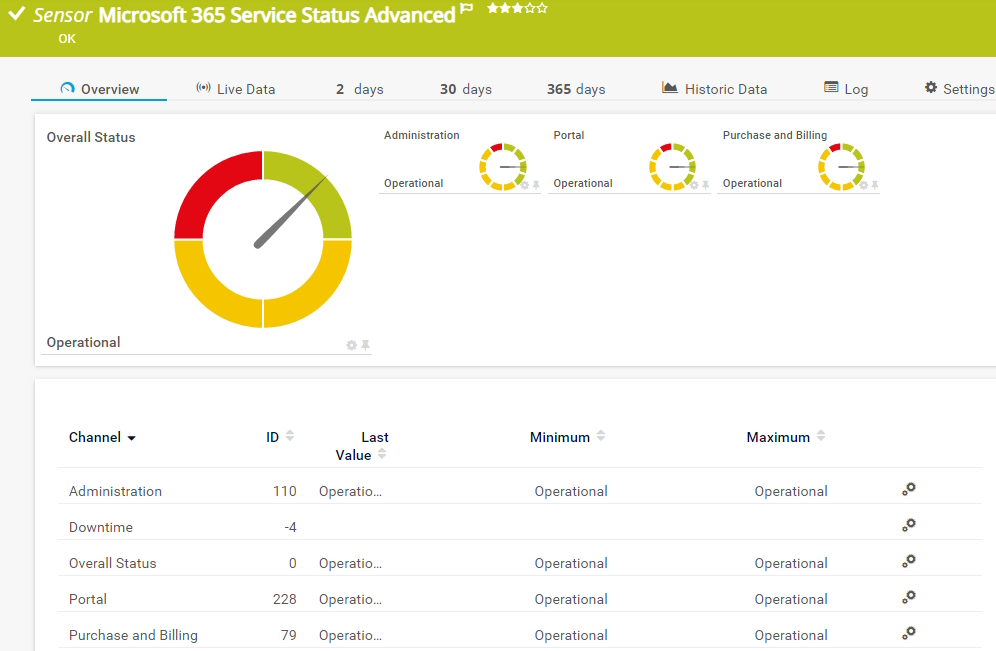
The Microsoft 365 Service Status Advanced sensor accesses the Microsoft API to monitor the detailed status of a service of a Microsoft 365 subscription. It can show the following:
See the PRTG Manual for a list of all available sensor types.
Real-time notifications mean faster troubleshooting so that you can act before more serious issues occur.

Custom alerts and data visualization let you quickly identify and prevent cloud-related infrastructure issues.
PRTG is set up in a matter of minutes and can be used on a wide variety of mobile devices.

By joining the Meraki Partners ecosystem, Paessler has become one of the technology providers that is entitled to lead the pack in integrating Cisco Meraki’s cloud networking platform with their solutions.
What does this mean for you?
Partnering with innovative IT vendors, Paessler unleashes synergies to create
new and additional benefits for joined customers.
Combining their tools to a powerful solution for advanced analysis and automation, KnowledgeRiver and Paessler enable IT teams to ensure best performance for their infrastructure and networks.
Paessler is member of the mioty alliance, composed of companies that use mioty to create innovative IoT and IIoT solutions such as the retrofitting of industrial environments.
Combine the functionality of Sigfox and Paessler for the most comprehensive, cost-effective, and easy-to-use IoT solution available.
Real-time notifications mean faster troubleshooting so that you can act before more serious issues occur.
Network Monitoring Software – Version 26.1.116.1532 (February 9th, 2026)
Download for Windows and cloud-based version PRTG Hosted Monitor available
English, German, Spanish, French, Portuguese, Dutch, Russian, Japanese, and Simplified Chinese
Network devices, bandwidth, servers, applications, virtual environments, remote systems, IoT, and more
Choose the PRTG Network Monitor subscription that's best for you


Cloud monitoring is the process of overseeing and managing the performance, availability, and security of applications and infrastructure hosted in a cloud environment. It involves tracking various metrics, logs, and events to ensure optimal functioning, identify potential issues, and facilitate timely responses to maintain a reliable and efficient cloud infrastructure.
Cloud monitoring tools like PRTG enable real-time visibility, analysis, and proactive management of resources in the cloud.
Tools for monitoring cloud services have various benefits:
No, there isn’t. PRTG monitors all cloud services, no matter the vendor or cloud provider. It comes with preconfigured sensors for monitoring AWS, Microsoft Azure, and Microsoft 365 for easier integration. However, using one of the many custom sensors of PRTG, you can keep an eye on any cloud-based resource you like.
Yes and no. PRTG is proprietary monitoring software that offers various licenses for infrastructures of all sizes in on-premises, cloud, and hybrid environments. However, there is also a freeware edition of PRTG that includes 100 sensors at no cost for life.
In PRTG, “sensors” are the basic monitoring elements. One sensor usually monitors one measured value in your network, for example the traffic of a switch port, the CPU load of a server, or the free space on a disk drive. On average, you need about 5-10 sensors per device or one sensor per switch port.
Paessler conducted trials in over 600 IT departments worldwide to tune its network monitoring software closer to the needs of sysadmins. The result of the survey: over 95% of the participants would recommend PRTG – or already have.

Paessler PRTG is used by companies of all sizes. Sysadmins love PRTG because it makes their job a whole lot easier.
Bandwidth, servers, virtual environments, websites, VoIP services – PRTG keeps an eye on your entire network.
Everyone has different monitoring needs. That’s why we let you try PRTG for free.