Custom alerts and data visualization let you quickly identify and prevent poor availability, bottlenecks, and other issues with your Google Cloud platform.
While Windows remains the backbone of the enterprise network, GCP has an increasingly important role – from docs and file storage to simplifying the deployment, management, and scaling of containerized applications using Google Kubernetes engine for Devops and running virtualized services on Google Compute Engine.
So, yes. Windows might be the engine that powers your organization, but Google Cloud Services are the turbocharger. And that means they need to be monitored just as closely as other network components to minimize the risk of disruption.
Specialized preconfigured sensors take care of monitoring APIs, application performance, availability, connectivity, and other key metrics 24 hours a day, 365 days a year, taking the effort out of optimizing performance and running a more efficient, stable, and reliable network.

Automate Google Cloud monitoring: With PRTG, you can get a comprehensive view of your applications, virtual environment, and storage on Google Cloud to optimize costs, gain actionable insights, improve performance, and ensure security.
Diagnose network issues by continuously tracking the availability, connectivity, and performance of your Google Cloud services. Show response times, user access, data flow, bandwidth usage, latency, and custom metrics in real time. Visualize monitoring data in clear graphs and dashboards to identify problems more easily. Gain the overview you need to troubleshoot all kinds of issues with your cloud environment.
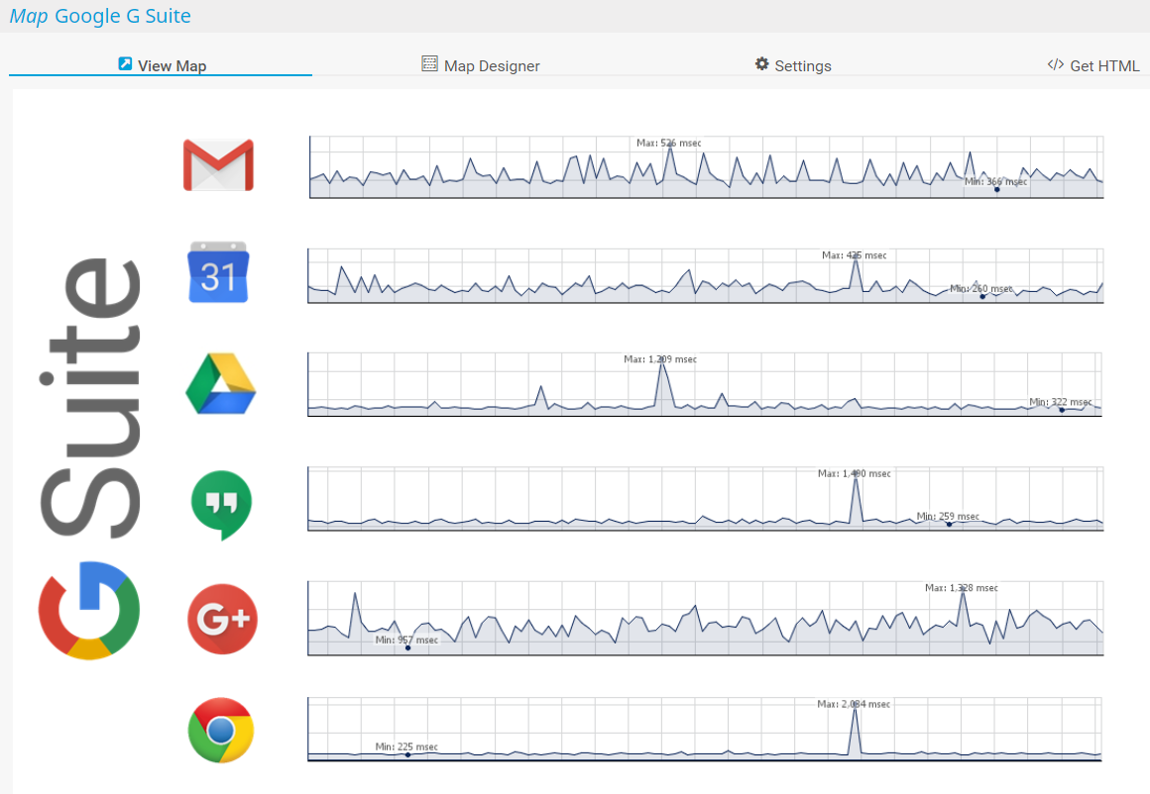
Usage data for Google Suite applications in PRTG

Device tree view of the complete monitoring setup

Custom PRTG dashboard for keeping an eye on the entire IT infrastructure

Live traffic data graph in PRTG
“All-around winning
network monitor”
“The real beauty of PRTG is the endless possibilities it offers”
“PRTG Network Monitor
is very hard to beat”
Monitoring your ERP system with PRTG is the best way to stay on top of things and deal with problems before they cause real trouble and even become business critical. Here’s why PRTG is the ideal solution for you.
Set alerting policies in PRTG that suit your Google Cloud infrastructure monitoring needs best.
As soon as collected metrics exceed or fall below a defined threshold, PRTG notifies you visually using a clear traffic lights system and sending you custom notifications via SMS, email, push notification, and more.
PRTG offers various visualization options such as charts, graphs, network maps, or dashboards. This way, you always have all important monitoring data on hand, including the availability of the Google Cloud Platform stack and resource usage.
What’s more: with our easy-to-use drag-and-drop map editor, you can easily create your own dashboards from scratch.
Google offers native monitoring capabilities that can, however, be tricky to set up and tend to get pricey as you start to scale. In comparison, our PRTG Google Cloud monitoring solution is not just cost effective but also very easy to set up and use.
You can also choose between different user interfaces, for example, smartphone apps for monitoring on the go – at no extra cost.
PRTG comes with more than 250 native sensor types for monitoring your entire on-premises, cloud, and hybrid cloud environment out of the box. Check out some examples below!
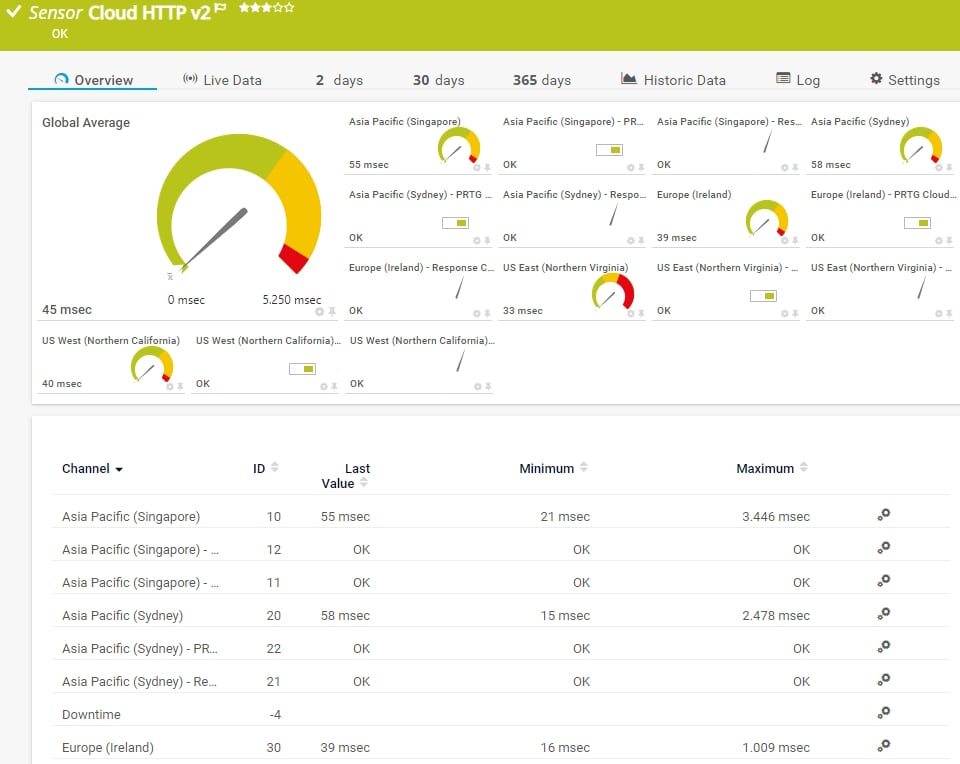
The Cloud HTTP v2 sensor monitors the loading time of a web server via HTTP from different locations worldwide (Asia Pacific: Singapore, Asia Pacific: Sydney, Europe: Ireland, US East: Northern Virginia, US West: Northern California) via the PRTG Cloud. It can show the following:
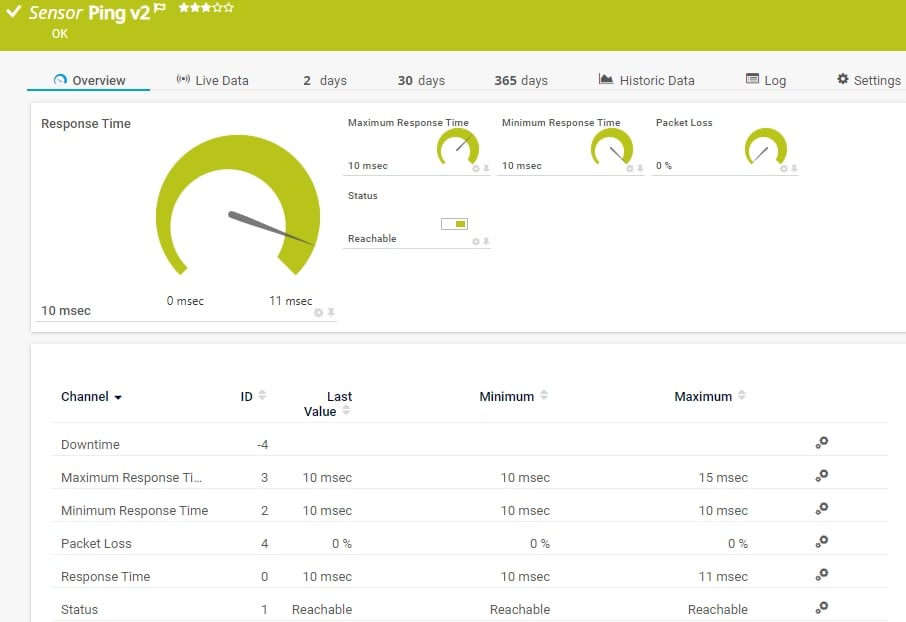
The Ping v2 sensor sends an Internet Control Message Protocol (ICMP) echo request ("ping") from the probe system to the parent device to monitor its availability. It can show the following:
• Response time
• Packet loss
• Target status
• Minimum and maximum ping time
See the PRTG Manual for a list of all available sensor types.

Custom alerts and data visualization let you quickly identify and prevent poor availability, bottlenecks, and other issues with your Google Cloud platform.
PRTG is set up in a matter of minutes and can be used on a wide variety of mobile devices.


“Excellent tool for detailed monitoring. Alarms and notifications work greatly. Equipment addition is straight forward and server initial setup is very easy. ...feel safe to purchase it if you intend to monitor a large networking landscape.”
Partnering with innovative IT vendors, Paessler unleashes synergies to create
new and additional benefits for joined customers.
Combining PRTG’s broad monitoring feature set with IP Fabric’s automated network assurance creates a new level of network visibility and reliability.
Paessler is member of the mioty alliance, composed of companies that use mioty to create innovative IoT and IIoT solutions such as the retrofitting of industrial environments.
Combine the functionality of Sigfox and Paessler for the most comprehensive, cost-effective, and easy-to-use IoT solution available.
Real-time notifications mean faster troubleshooting so that you can act before more serious issues occur.
Network Monitoring Software – Version 26.1.116.1532 (February 9th, 2026)
Download for Windows and cloud-based version PRTG Hosted Monitor available
English, German, Spanish, French, Portuguese, Dutch, Russian, Japanese, and Simplified Chinese
Network devices, bandwidth, servers, applications, virtual environments, remote systems, IoT, and more
Choose the PRTG Network Monitor subscription that's best for you


Google Cloud is a suite of cloud computing services provided by Google. It offers a variety of tools and services for businesses, developers, and organizations to build, deploy, and manage applications and infrastructure on Google's global network. Here are some key components and features of Google Cloud:
PRTG is a proprietary software tool that can track the health and performance of all the Google Cloud services and workflows your network depends on, including BigQuery, Cloud SQL, and other Google database services, cloud storage, persistent disks, virtual machines, and other cloud-based Google applications.
Available for Windows-based on-premises servers or as a cloud-hosted solution, it's capable of monitoring unlimited local, remote, and virtual devices, bringing critical system data together in one simple, intuitive interface you can access from anywhere: at the office, at home, or on the go.
PRTG's preconfigured sensors integrate with Google Cloud Platform and collect data about key metrics for all the GCP services and resources on your network. The data is gathered in a centralized dashboard alongside all your other hardware and software metrics, creating a golden source of truth for your entire network's health and performance.
Once you download PRTG, the automatic network discovery does a lot of the work. Key in your preferred IP range and it will detect every network component in that range – including GCP services – and assign the appropriate sensors. Once that's done, you can pick your preferred performance thresholds. Just make sure you set the right permissions for the GCP account you want to monitor before you set up the sensors, or they won't be able to read the data.
In PRTG, “sensors” are the basic monitoring elements. One sensor usually monitors one measured value in your network, for example the traffic of a switch port, the CPU load of a server, or the free space on a disk drive. On average, you need about 5-10 sensors per device or one sensor per switch port.
Paessler conducted trials in over 600 IT departments worldwide to tune its network monitoring software closer to the needs of sysadmins. The result of the survey: over 95% of the participants would recommend PRTG – or already have.

Paessler PRTG is used by companies of all sizes. Sysadmins love PRTG because it makes their job a whole lot easier.
Bandwidth, servers, virtual environments, websites, VoIP services – PRTG keeps an eye on your entire network.
Everyone has different monitoring needs. That’s why we let you try PRTG for free.