
- English
- Deutsch
- Español
- Français
- Italiano
- Português
Internet connectivity isn't binary. A connection can be reachable but degraded, stable by ping but saturated at the WAN interface, or fully pingable while DNS is broken and nothing actually loads. Reliable internet connection monitoring checks each of these layers independently: reachability, latency, jitter, bandwidth, DNS resolution, and application-layer responses. Every change gets timestamped and stored.
Paessler PRTG covers all of these layers from a single platform, with dedicated sensors for each check and no additional agents or third-party integrations required. Alerts fire the moment a threshold is breached, and historical data is retained per sensor. That gives you a full record of connection behavior, useful for active troubleshooting and ISP escalation documentation alike.
Supported protocols: ICMP, SNMP, HTTP/HTTPS, DNS, NetFlow v5/v9, IPFIX, sFlow, jFlow
Supported technologies: Routers, modems, firewalls, WAN interfaces, DNS servers, ISP gateways, web servers, external IP addresses

The first sign of an internet outage shouldn't be a user complaint. The Ping v2 Sensor polls any reachable IP address (your ISP gateway, an external DNS server, a target host) via ICMP echo requests at configurable intervals. The moment response time exceeds your defined threshold, PRTG sends an alert via email, SMS, or push notification. Every polling result is logged automatically with a timestamp and duration, so you have a full incident record before a single support ticket lands.
Sporadic connection instability, the kind users complain about, but that disappears before IT gets to it, leaves a trace in PRTG. The Ping Jitter Sensor sends a series of ICMP requests per polling cycle and calculates statistical jitter, logging execution time and jitter value every cycle. Network performance issues that come and go don't vanish from the record. They're in the graph when you go looking. Polling runs at intervals, so single-second micro-outages may not surface. But sustained degradation patterns always do.
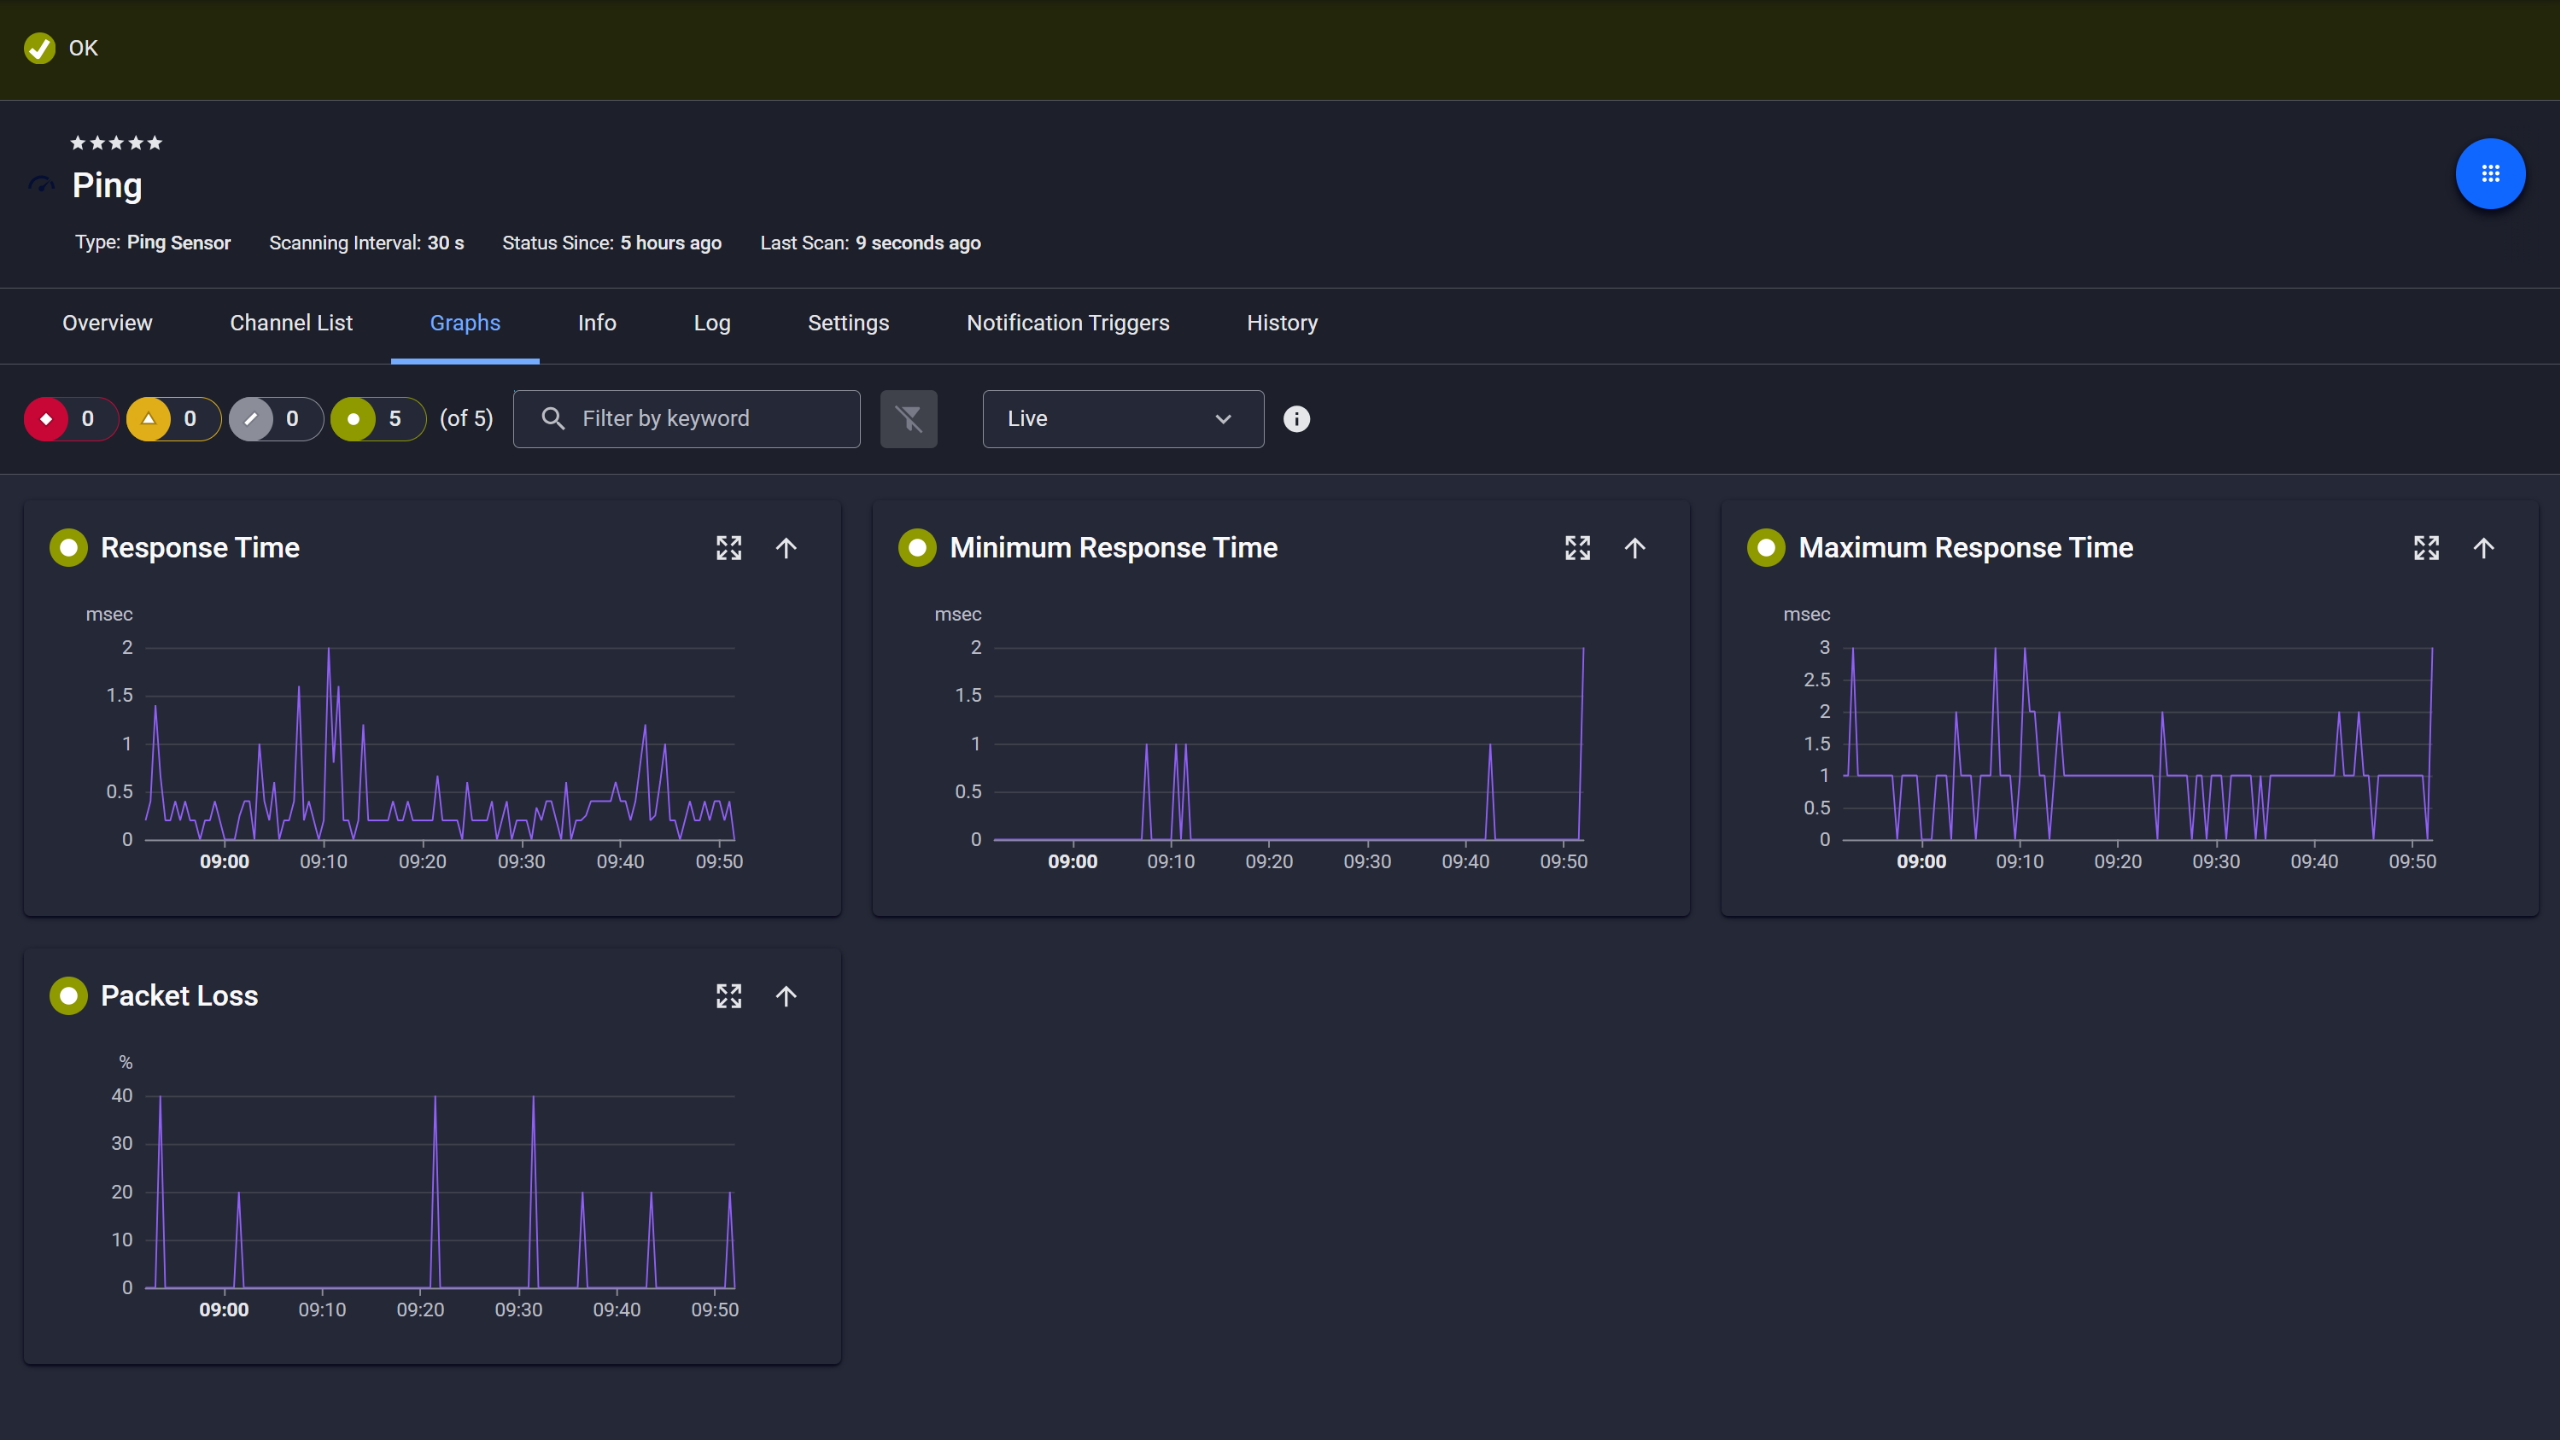
Ping response and packet loss

Live graphs, real-time performance data
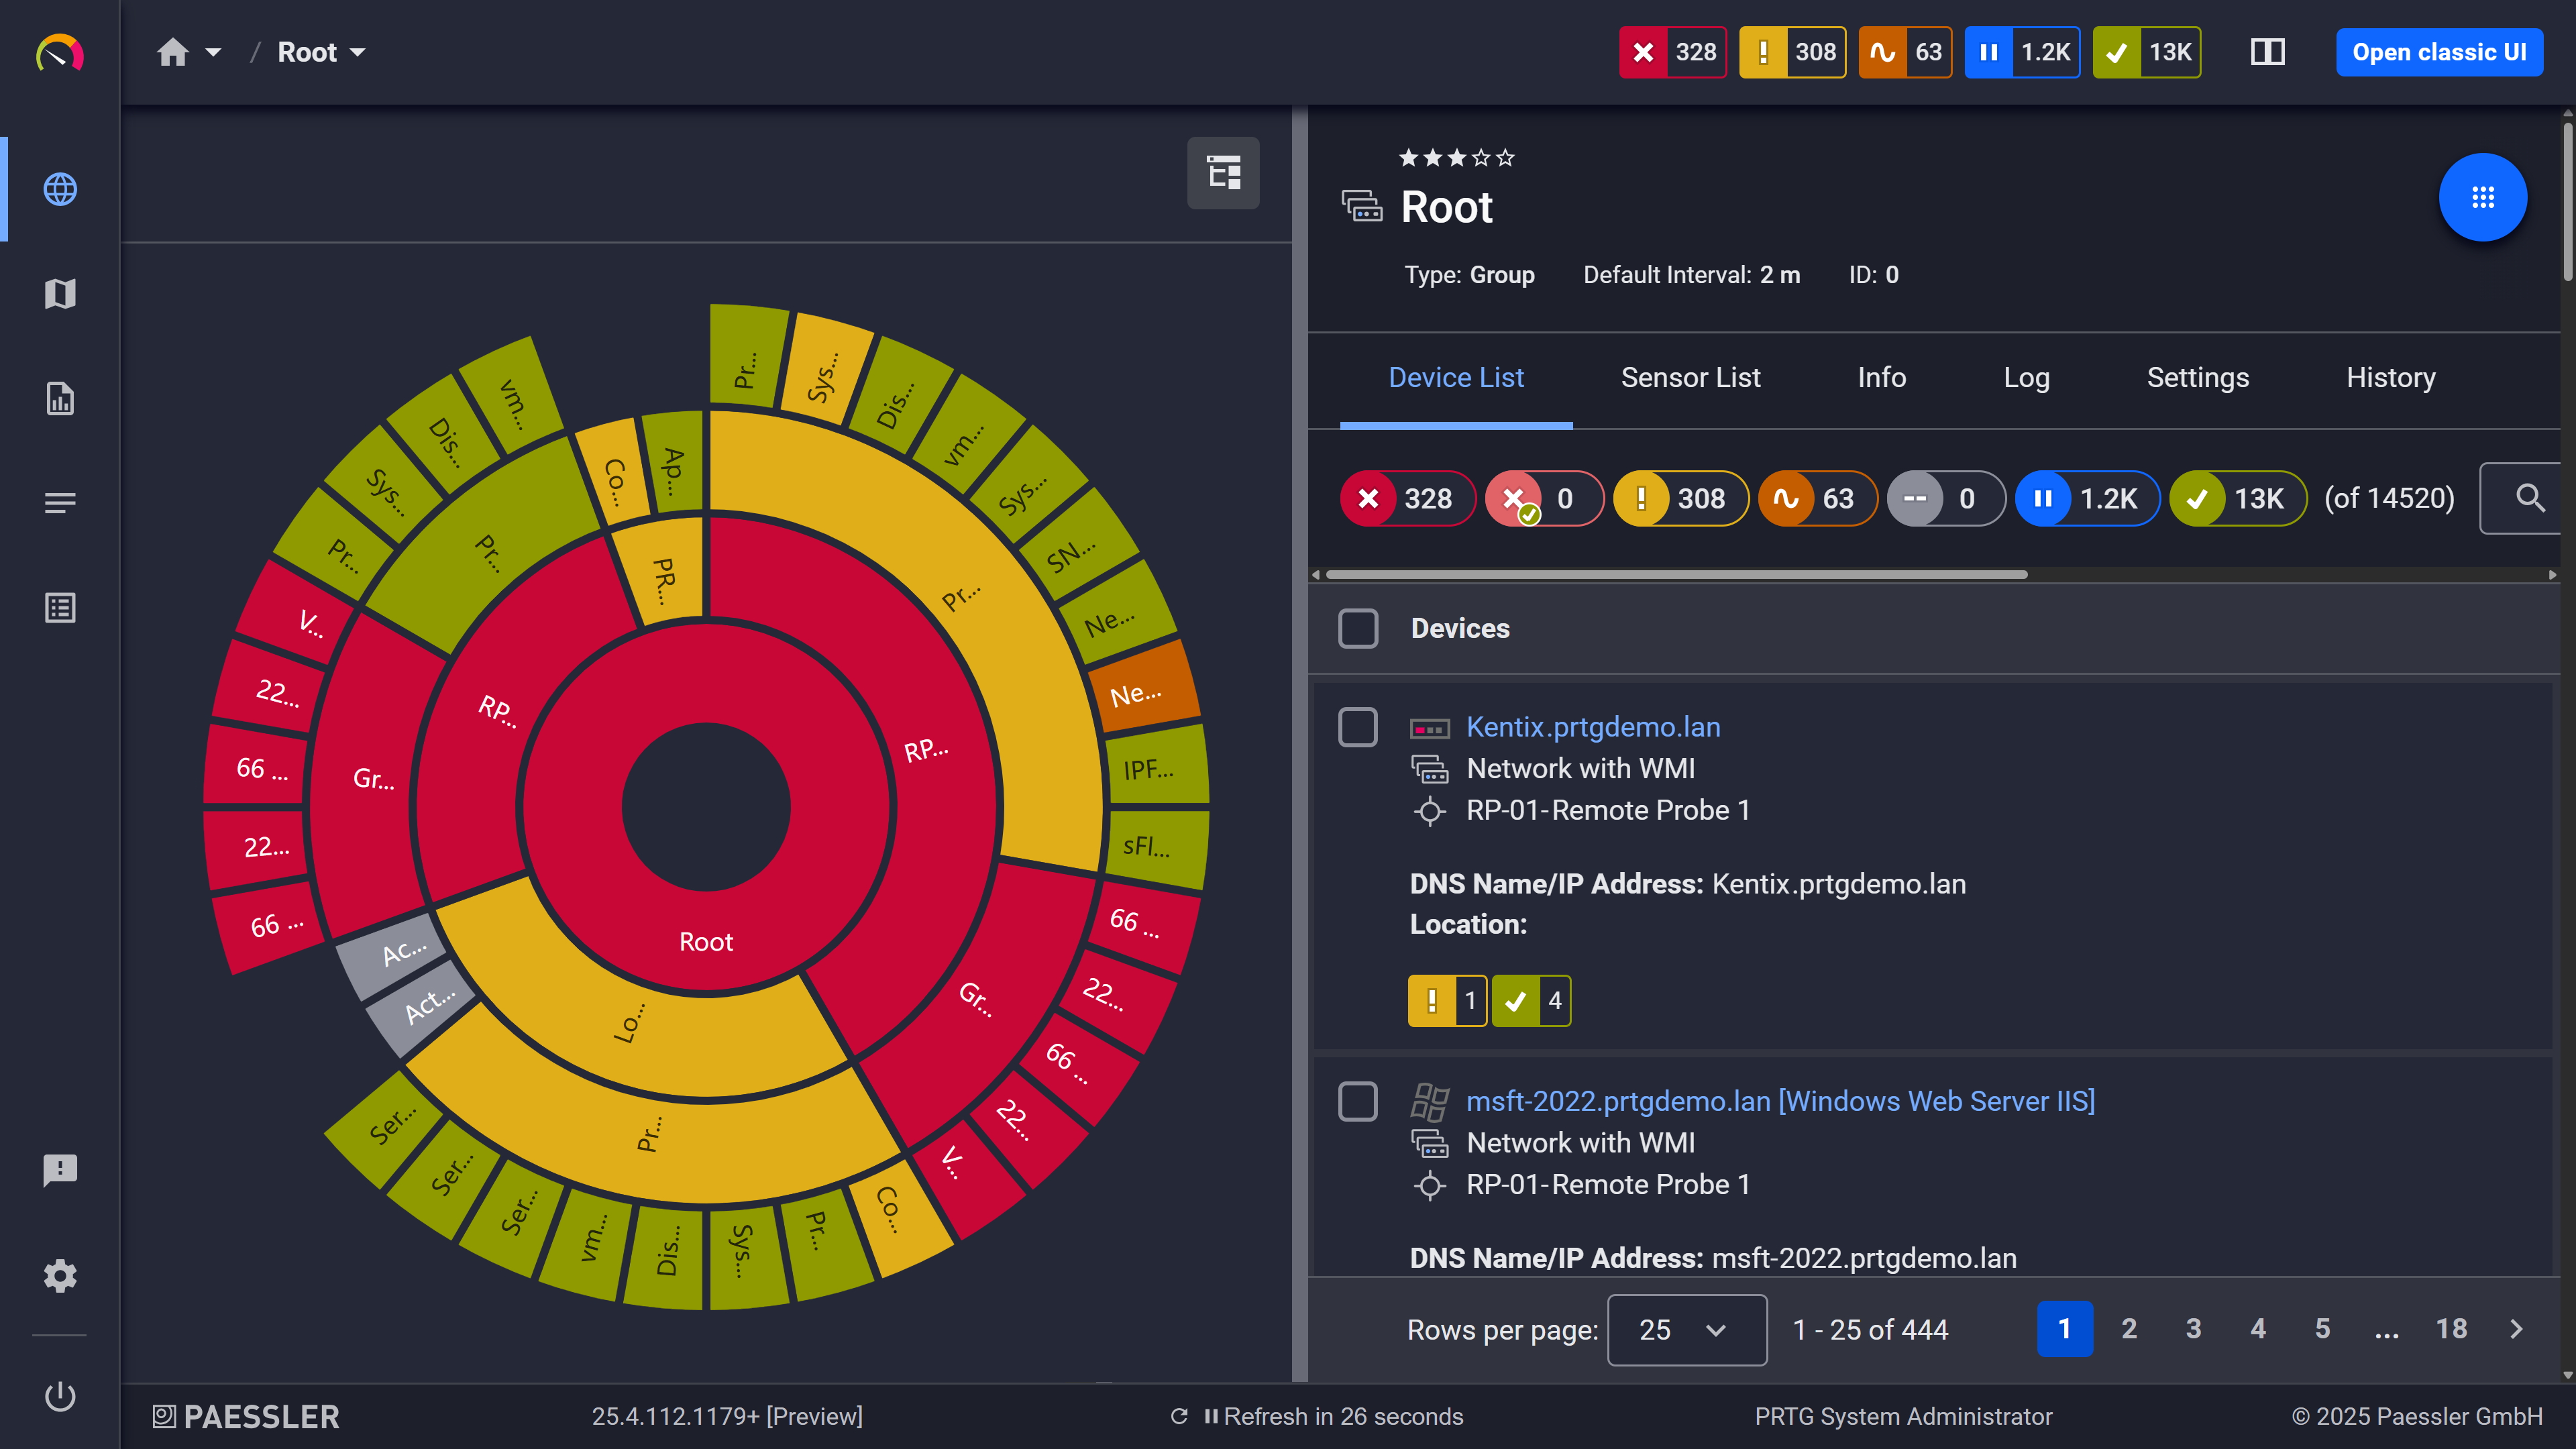
Your entire network, visualized instantly
"The internet is slow" describes two completely different problems with different fixes. A saturated WAN link needs a capacity conversation. ISP-side degradation needs an escalation call. Without data, you're guessing which one it is.
The SNMP Traffic Sensor measures traffic in and out on your WAN interface in real time and historically. That one data point tells you whether the link is hitting capacity or whether internet speed is normal while connection quality drops. Sustained drops in connection speed with normal bandwidth utilization point to the ISP. A maxed-out WAN interface points to capacity. Two different problems, two different responses. You'll know which before you pick up the phone.
Start monitoring your infrastructure in minutes. No professional services, no complex configuration, no risk.
When internet service provider (ISP) performance degrades, the response is almost always "it's not on our end." Without documented evidence, troubleshooting that conversation goes nowhere. PRTG gives you two complementary tools to build the case.
The Traceroute Hop Count Sensor shows the number of network hops to any external target and alerts you when the hop count changes, which can indicate upstream path changes or reroutes. Separately, a Ping v2 Sensor pointed at your ISP's gateway IP builds a continuous, timestamped latency and availability record against an external reference point you don't control. Together, these give you documented data rather than anecdote when you open an ISP escalation ticket.

Scheduled reports, always on time
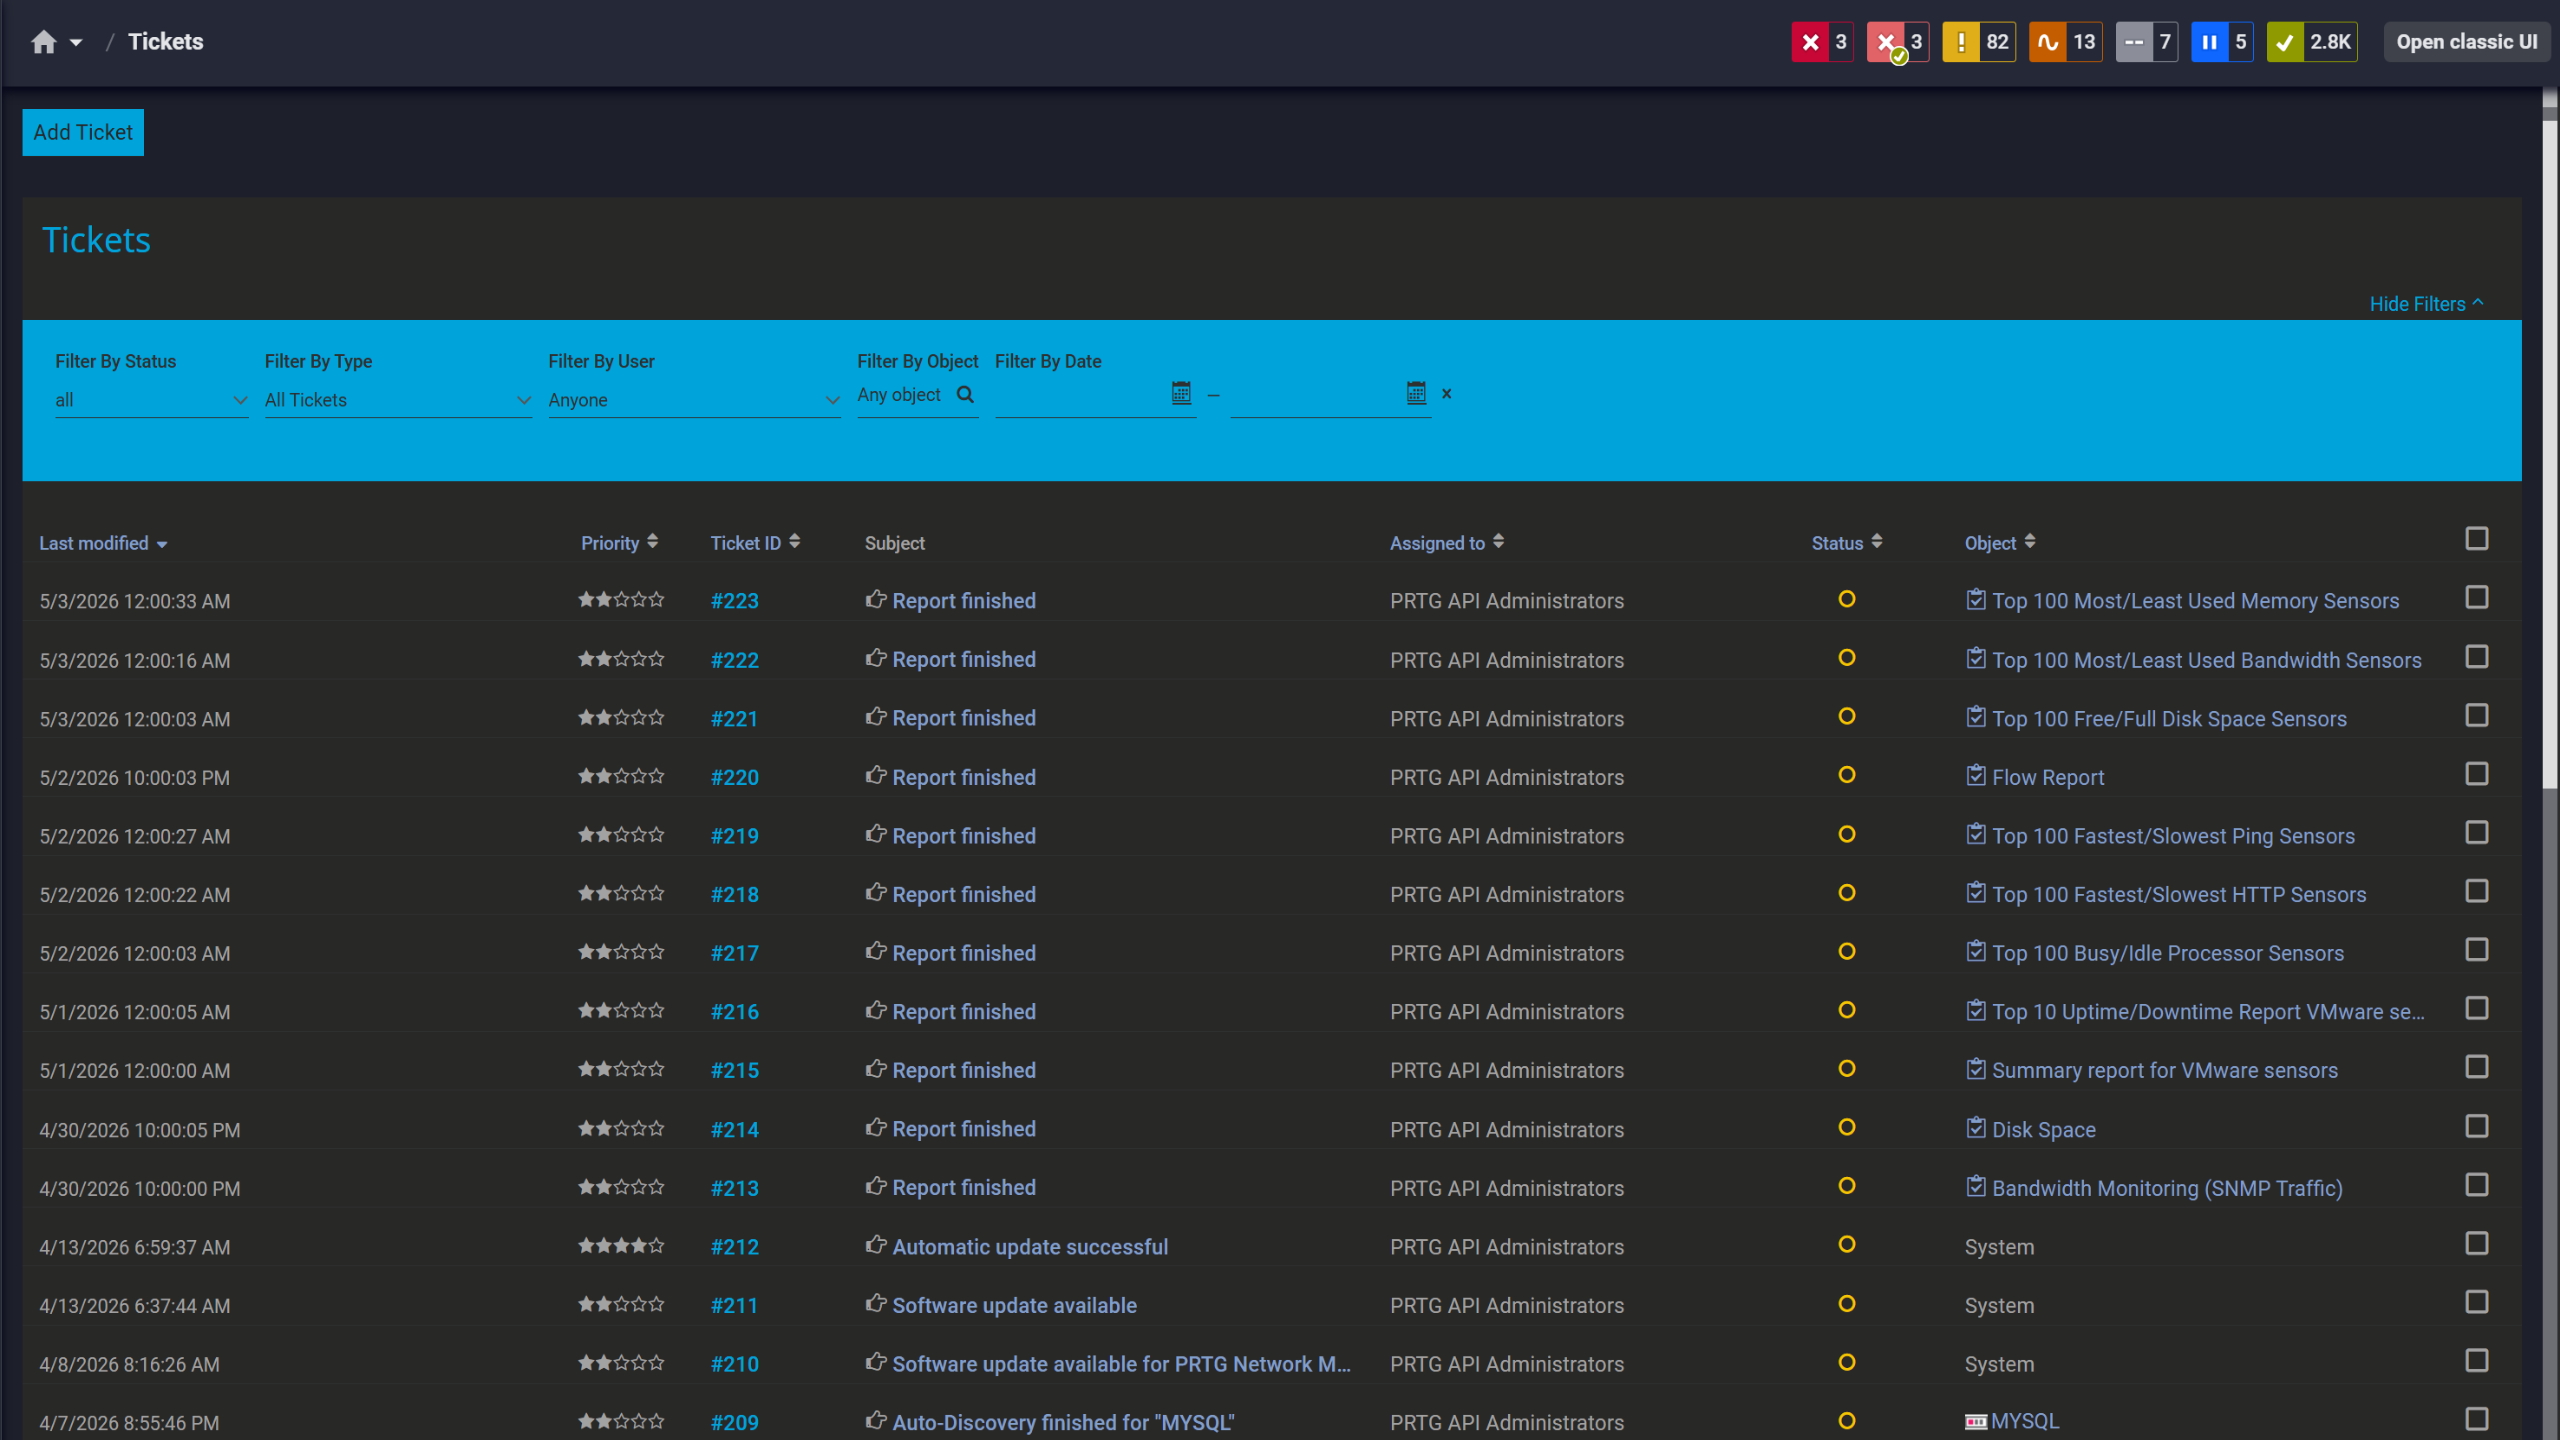
Tickets keep your team aligned
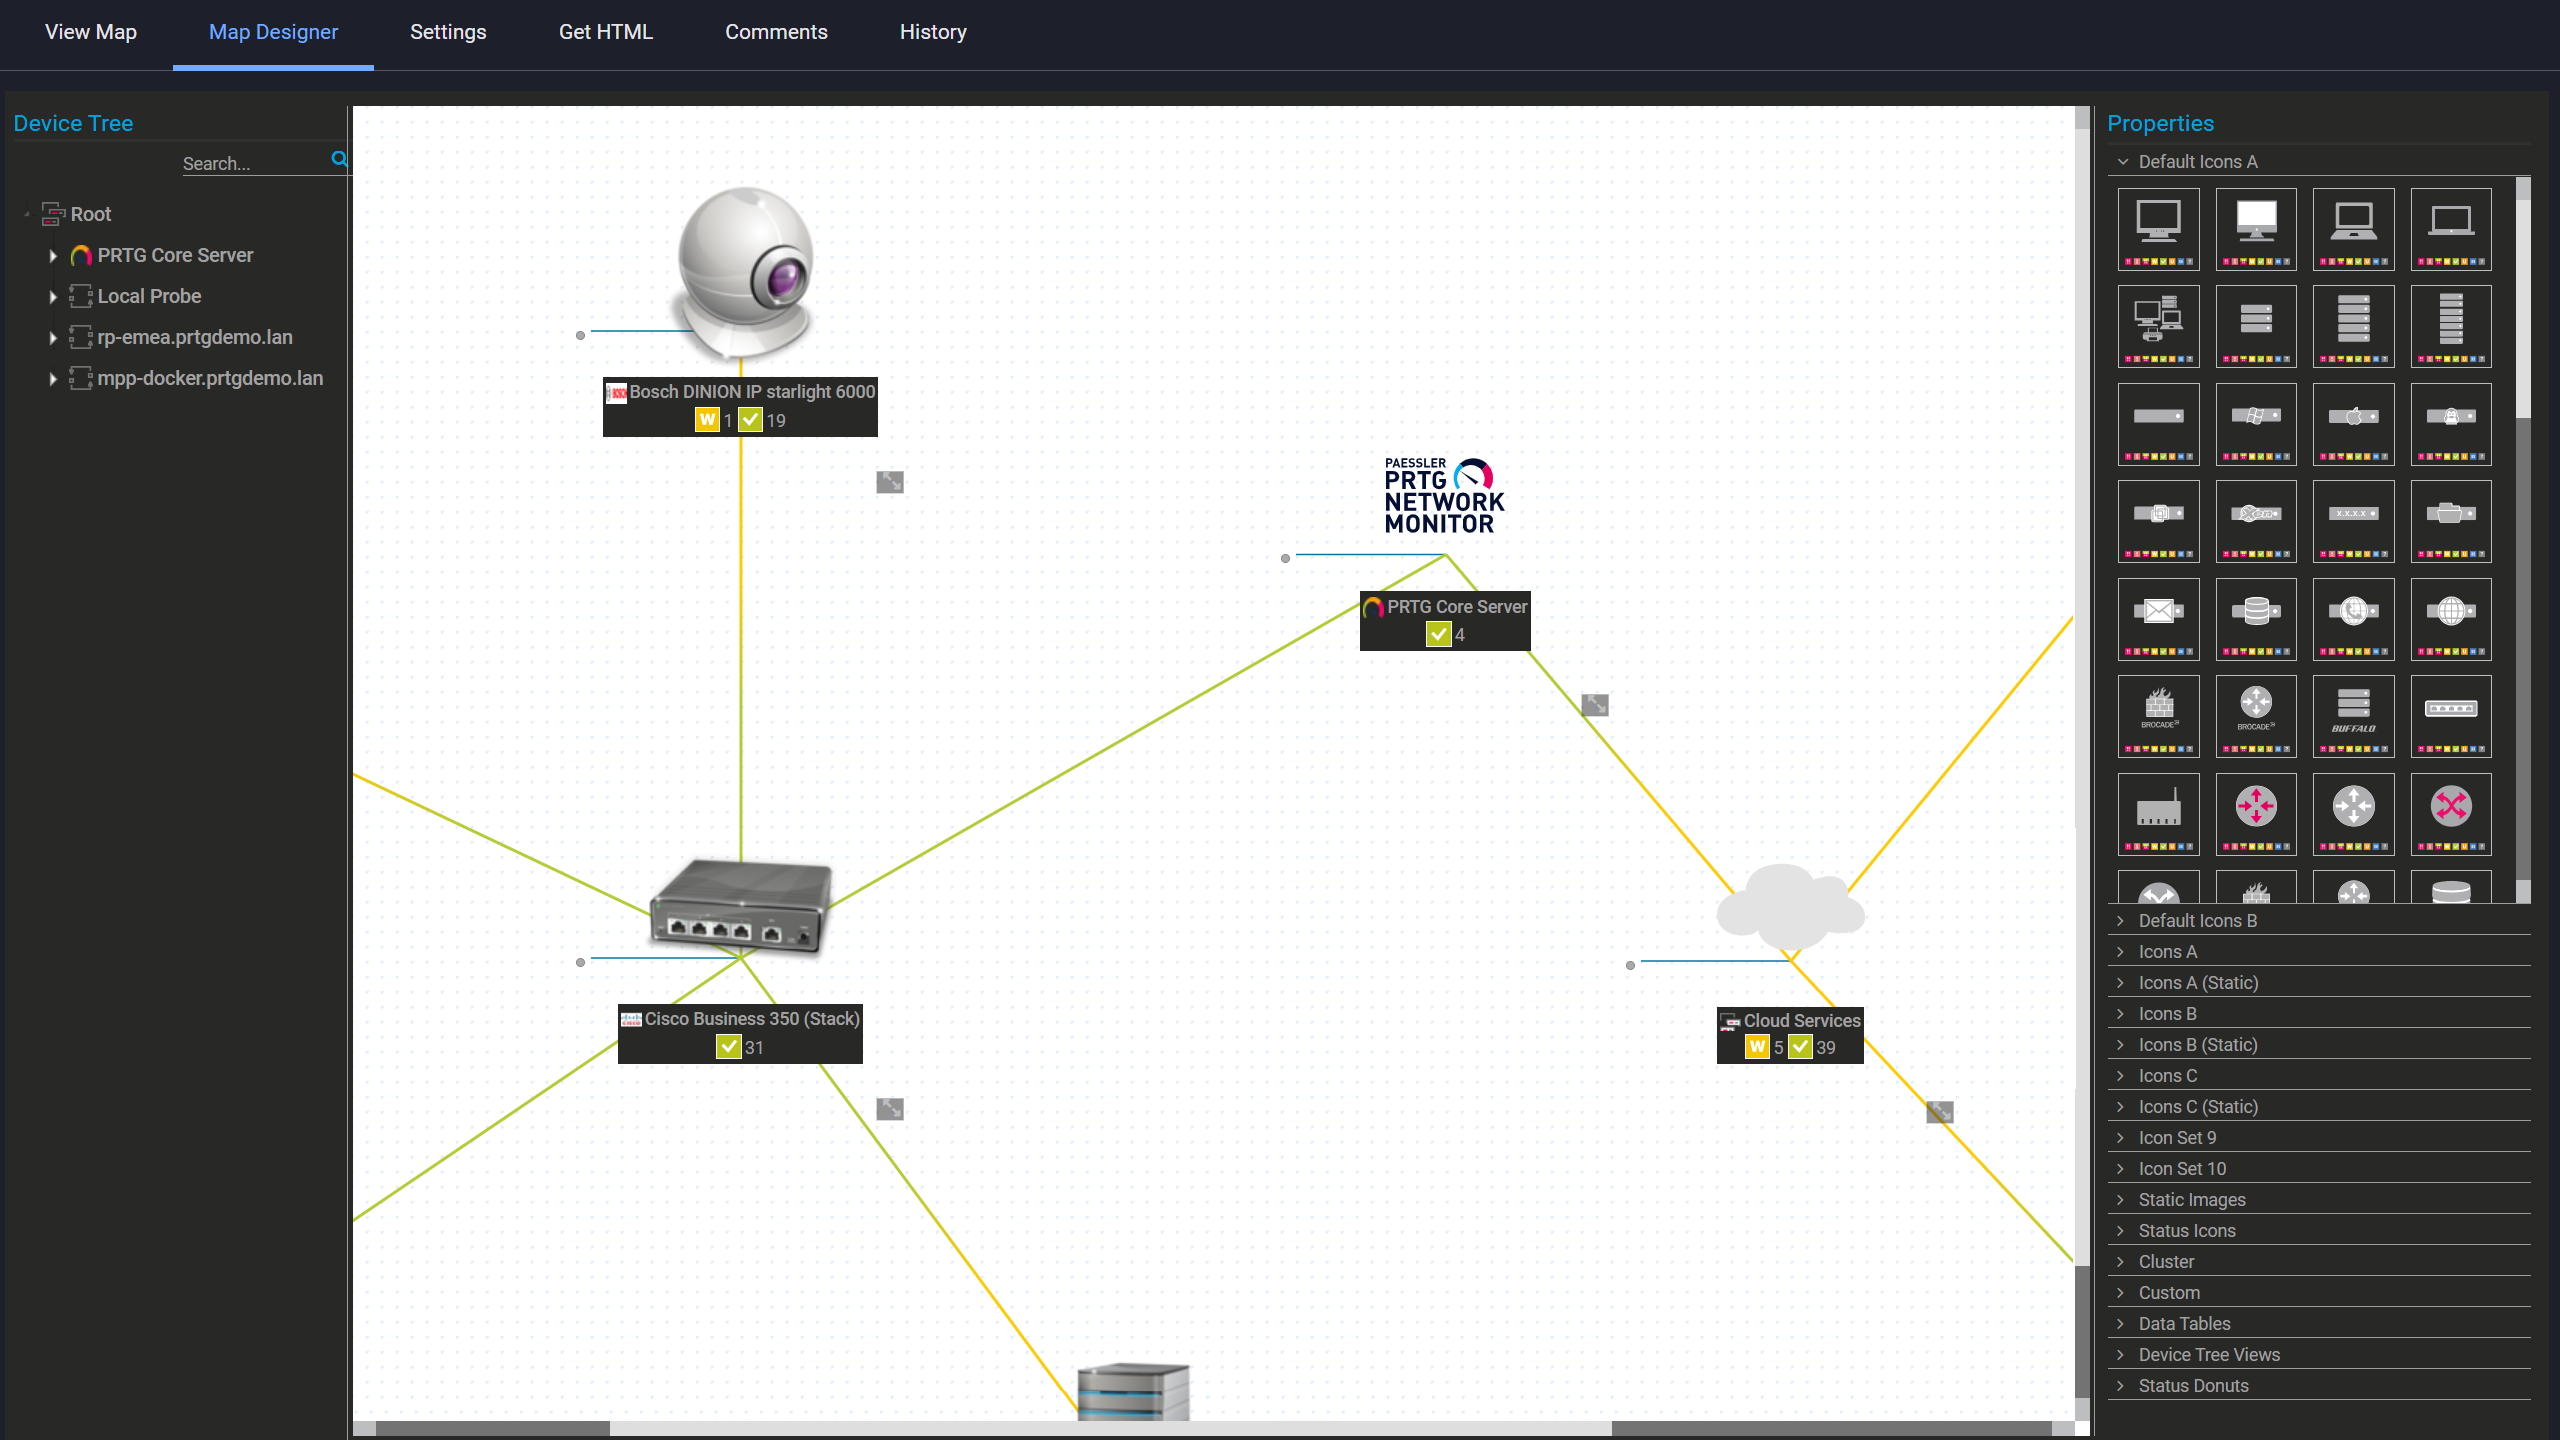
Custom maps with live status
Branch offices and remote sites without on-site IT staff are visibility blind spots. You don't find out something's wrong until someone at that site calls.
A PRTG remote probe installed at each site monitors local connectivity independently, keeping polling going regardless of what's happening between that site and your core server. When the connection is up, results flow into one central dashboard. When that link goes down, the probe continues polling locally; the core server flags the probe as disconnected, which is itself a visible alert state that tells you exactly where to look.
Beyond the core reachability sensors, PRTG covers additional layers of internet connection health as part of a complete network monitoring setup. Here's what each method does and where it fits.
What do you need to know? | Checking Manually Checking Manually | With PRTG With PRTG |
|---|---|---|
Is the internet down? | Checking Manually Users call IT | With PRTG Alert sent as configured, e.g. with timestamp |
Did something happen earlier? | Checking Manually Unknown, no record | With PRTG Full polling history per sensor, exportable |
Is the link congested or broken? | Checking Manually Run an internet speed test (one point in time) | With PRTG Continuous SNMP Traffic Sensor data, real-time and historical |
Did the upstream path change? | Checking Manually Manual traceroute, no history | With PRTG Traceroute Hop Count Sensor alerts on hop count changes; Ping v2 Sensors on external IPs build the latency record |
Status across multiple sites | Checking Manually Phone calls from branch staff | With PRTG One dashboard, all locations via remote probes |
Choose the PRTG Network Monitor subscription that's best for you.
| License Name | License description | Price | License Details | Get started | Pricing Details | |
|---|---|---|---|---|---|---|
| PRTG 500 | $200 | per month paid annually | Buy nowBuy now | Enough to monitor multiple aspects of 50 devices | ||
| PRTG 1000 | $358 | per month paid annually | Buy nowBuy now | Enough to monitor multiple aspects of 100 devices | ||
| PRTG 2500 | $742 | per month paid annually | Buy nowBuy now | Enough to monitor multiple aspects of 250 devices | ||
| PRTG 5000 | $1,300 | per month paid annually | Buy nowBuy now | Enough to monitor multiple aspects of 500 devices | ||
| PRTG 10000 | $1,642 | per month paid annually | Buy nowBuy now | Enough to monitor multiple aspects of 1000 devices |

A speed test runs once and gives you a number. PRTG runs continuously, stores every result, and sends you an alert when something goes wrong. If your connection degrades overnight, a speed test won't tell you. PRTG already has the record by the time you check in the morning.
Not at the IP level, which is where PRTG operates. The sensors don't see the physical medium underneath. They see the network interface. That said, if you want wireless-specific metrics, PRTG can monitor access points and switches via SNMP separately. For standard internet connection monitoring, the ICMP and SNMP sensors work the same either way.
It depends on what you want to measure. Reachability and latency checks (Ping v2, Ping Jitter) only need a reachable IP (no special hardware). WAN bandwidth via the SNMP Traffic Sensor requires SNMP enabled on the router or firewall. Flow-based traffic analysis requires the device to actively export flow data, and not all devices do. PRTG's sensor setup shows you exactly what each sensor needs before you deploy it.
Single-site setup: if the core server loses connectivity, outbound alerts via email or SMS may not get through until the connection comes back. The server also needs internet access to run cloud-based checks. Multi-site setup with remote probes works differently. Each probe keeps polling locally regardless of what's happening with the WAN link back to the core server. The core server flags the disconnection as an alert state. Classic probes will have a data gap for that period; multi-platform probes buffer and sync when the connection recovers.
Yes, with HTTP v2 Sensors pointed at Microsoft 365 endpoints. You'll get a continuous record of whether those URLs are reachable and returning valid responses from your network. What it won't catch is a Microsoft-side issue that doesn't affect the HTTP response code. For that you'd need Microsoft's own status pages. But for the question "can my users actually reach it from here," PRTG gives you the answer.
PRTG sends notifications via email, SMS, and push through the PRTG app. Each sensor has its own notification triggers, so you can set different thresholds, escalation paths, and on-call schedules per sensor. The right person gets alerted. Nobody needs to be watching a dashboard.
Network Monitoring Software – Version 26.3.124.1727 (September 16, 2026)
Download for Windows and cloud-based version PRTG Hosted Monitor available
English, German, Spanish, French, Portuguese, Dutch, Russian, Japanese, and Simplified Chinese
Network devices, bandwidth, servers, applications, virtual environments, remote systems, IoT, and more
Choose the PRTG Network Monitor subscription that's best for you



